


Introduction
The accuracy of permeability estimation directly impacts productivity prediction and reservoir heterogeneity assessment[1]. Currently, few logging methods are available to directly measure continuous permeability. Permeability is obtained mainly through laboratory core analysis[2,3,4]. In offshore oilfields, core samples are usually sparse due to operational cost. It is a challenge to accurately estimate continuous permeability with limited core data. Liu Yantang et al.[5] proposed a method to convert Modular Formation Dynamics Tester (MDT) mobility into effective permeability by mud filtrate conversion. Lu Kefeng [6] and Yang Dong[7] have proposed to convert wireline formation tester mobility into gas phase permeability with relative permeability data. However, all the above methods can only estimate permeability at discrete locations.
Penglai 19-9 oilfield, located at the northeast of Bohai bay, is a faulted anticline developed on paleouplift and complicated in Tanlu fault zone. The major pays are fluvial terrigenous clastic rock layers in the lower member of Minghuaz-hen Formation and the Guantao Formation in Tertiary System. The reservoirs are dominated by arkosic sandstone with a high porosity of 21.5% to 38.4%, and high permeability of 13.9 to 6049.8×10-3 μm2[8,9]. Shallow in burial depth, the reservoir rocks are largely unconsolidated with strong heterogeneous. It is a big challenge to accurately estimate permeability with logging. During the exploration phase, we thought that Penglai 19-9 oilfield had similar depositional environment, burial depth, mineral composition, log responses and reservoir physical property with neighboring oilfields. Therefore, we did not collect any cores from explorations wells of Penglai 19-9 oilfield. The permeability model from neighboring oilfield was used to estimate permeability in Penglai 19-9 oilfield (Fig. 1). During the development, we realized the following problems in permeability evaluation of Penglai 19-9 oilfield: (1) The permeability estimated by the model of neighboring oilfield does not match permeability from core taken from development wells; (2) Due to engineering requirements, two barrels of cores were taken from development wells of Penglai 19-9 oilfield, with 70% recovery rate. From core description and conventional core analysis, we found the reservoir has complex pore structure and strong heterogeneity. Due to the limited samples collected (altogether 74 samples) and poor porosity-permeability correlation (Fig. 2), we cannot estimate continuous permeability accurately based on permeability from core analysis. These problems bring uncertainty to productivity estimation. Therefore, it is critical to build a permeability model specific to Penglai 19-9 oilfield itself.
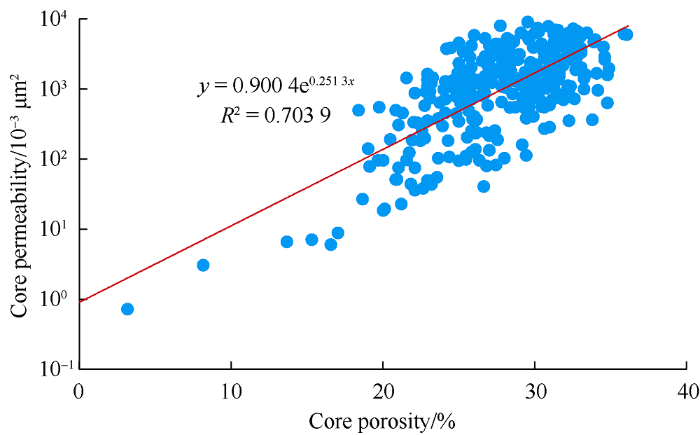
Fig. 1.
Correlation between core porosity and core permeability from core analysis of adjacent oilfields.
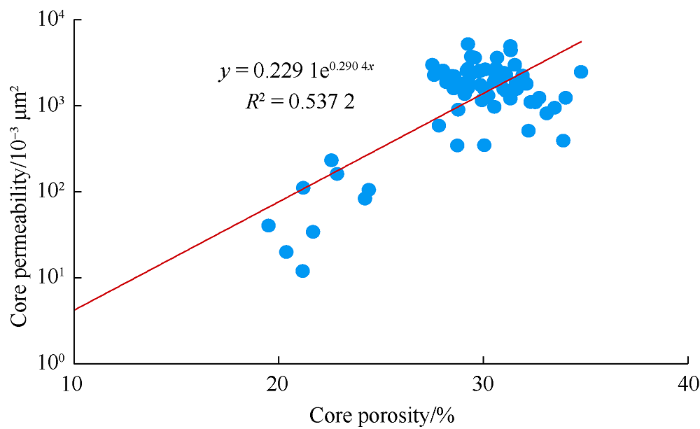
Fig. 2.
Correlation between core porosity and core permeability of development well in Penglai 19-9 oilfield.
Based on previous work, we analyzed 330 mobility points of pressure measurement while drilling and production data in 21 wells of Penglai 19-9 oilfield. Based on measurement mechanism of mobility in pressure measurement while drilling (PWD) and core relative permeability experiment data, we established a method to convert mobility from PWD into core permeability and calibrate the Timur permeability model with the converted permeability. This workflow provides a much more reliable permeability estimation for the production prediction of the Penglai 19-9 oilfield.
1. Formation permeability evaluation method based on PWD mobility
At present, the methods estimating permeability with mobility from PWD could only convert mobility from PWD of tested points to permeability of individual points by drilling fluid filtrate viscosity, and there was no method able to evaluate permeability continuously by using mobility from PWD. In this study, a continuous permeability model has been built based on logging porosity and irreducible water saturation and mobility from PWD with a large vertical distribution range.
1.1. The correlation between PWD mobility and water phase permeability
Mobility value characterizes the flowing capability of fluid in a porous medium. The higher the mobility, the better the flow capacity will be. Pressure measurement while drilling is designed to evaluate reservoir connectivity, define oil-water contact and detect overpressure or pressure deficiency with formation pressre. The formation mobility can be calculated by the equation (1) during the pressure measurement while drilling[10].
In this study, three most commonly used pressure measurement while drilling systems and their operative parameters were examined (Table 1). It is found that the pressure measurement while drilling tools have several common characteristics, including low pumping rate, short test time, and small sampled volume range. That means that the pressure range of pressure measurement while drilling is relatively small, and the pumping fluid is only the drilling fluid filtrate in the near borehole zone[11,12,13].
Table 1 Operative parameters of pressure measurement while drilling tools.
| Oilfield Service Company | Pressure measurement while drilling system | Pumping rate/(mL·s-1) | Pumping volume/mL | Test time/s |
|---|---|---|---|---|
| Schlumberger | Stetho-Scope | 0.20-2.00 | 0.5-14.5 | 180-1 200 |
| Halliburton | Geo-Tap | 0.05-7.70 | 2.5-50.0 | 32-4 192 |
| Baker hughes | Tes-Trak | 0.25-1.00 | 5.0-10.0 | 180-1 200 |
Through above analysis, mobility from PWD is in fact the mobility of drilling fluid filtrate in the near borehole zone. Because the invasion process during drilling operation in flushing zone with water-based drilling fluid is similar to the mechanism of oil displacement by water in relative permeability experiments[6,7,8], the product of mobility from PWD and viscosity of drilling fluid filtrate is more close to the water phase permeability under the residual oil saturation measured in relative permeability experiments than DST (Drill stem test) and MDT test results (Fig. 3). According to statistics, the viscosity of drilling fluid filtrate in Bohai Bay ranges from 0.40-0.85 mPa·s[5] while the on-site laboratory analysis results show that the drilling fluid filtrate viscosity of Penglai 19-9 oilfield is 0.5 mPa•s.
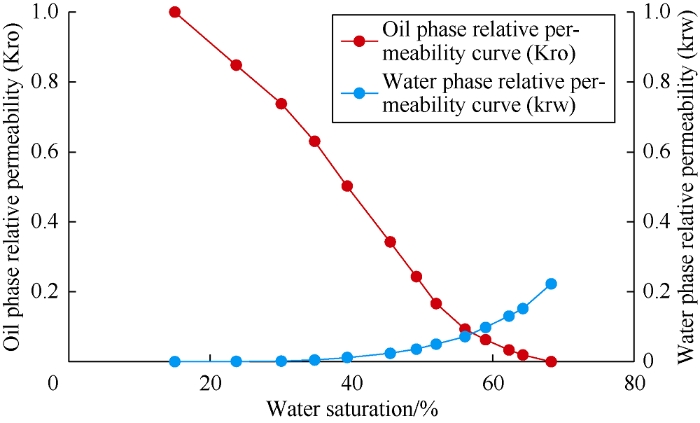
Fig. 3.
Oil-water relative permeability curve.
After determining the viscosity of the drilling fluid filtrate, the equation (2) can be used to convert mobility from PWD to the water phase permeability under residual oil saturation. Thus, it is clear that the product of mobility from PWD and viscosity of drilling fluid filtrate is the water phase permeability under residual oil saturation in relative permeability experiment.
1.2. Conversion method from PWD mobility to core permeability
Oil-water relative permeability curve reflects the flow law of oil-water two phases in porous media and is an important data in oilfield development design and reservoir engineering. Theoretical and experimental results show that there is a close relationship between relative permeability and fluid saturation[14]. The oil phase permeability under irreducible water saturation and the water phase permeability under residual oil saturation can be obtained by the relative permeability experiment.
Four sets of oil-water relative permeability experiments were designed by using 46 core samples from Penglai 19-9 and surrounding oilfields. Four kinds of white oils were selected as experimental oils (with the viscosity of 10.1, 39.6, 50.8, 141.8 mPa·s respectively). The water used in the experiment was potassium chloride solution, with a viscosity of 0.738 5 mPa·s and salinity of 72 924 mg/L. Specific experimental parameters and results are shown in Table 2. Core samples used in two groups of experiments with white oil of 39.6 mPa·s and 50.8 mPa·s were taken from Penglai 19-9 oilfield, they are the simulation experiments under formation temperature, pressure and oil viscosity. Since the oil viscosity varies widely on plane and vertical strata of Penglai 19-9 oilfield, and the depth range of coring data is limited, the cores used in the other two groups of experiments were taken from the surrounding oilfields of Penglai 19-9 oilfield, and the coring interval is similar in physical properties to that in Penglai 19-9 oilfield, but different in formation oil viscosity.
Table 2 Statistics on parameters and results of relative permeability experiments on core samples from Penglai 19-9 and adjacent oilfields.
| Sample No. | White oil viscosity/ (mPa•s) | Experimental temperature/°C | Experimental pressure/MPa | Core porosity/ % | Core per meability/ 10-3 μm2 | Irreducible water saturation/% | Oil phase permeability/ 10-3 μm2 | Residual oil saturation/% | Water phase permeability/ 10-3 μm2 |
|---|---|---|---|---|---|---|---|---|---|
| 1-013A | 10.1 | 35 | Constant pressure | 29.8 | 400.0 | 18.3 | 254.0 | 36.5 | 54.1 |
| 1-003A | 10.1 | 35 | Constant pressure | 31.8 | 734.0 | 19.8 | 595.5 | 22.8 | 176.4 |
| 1-007A | 10.1 | 35 | Constant pressure | 26.2 | 232.0 | 37.1 | 117.0 | 28.4 | 12.9 |
| 1-013A | 10.1 | 35 | Constant pressure | 27.1 | 161.0 | 35.2 | 78.3 | 24.5 | 19.1 |
| 1-016A | 10.1 | 35 | Constant pressure | 22.3 | 81.2 | 14.7 | 77.3 | 28.7 | 11.1 |
| 1-002A | 10.1 | 35 | Constant pressure | 28.8 | 1 220.0 | 23.2 | 1 127.6 | 15.6 | 465.5 |
| 1-017A | 10.1 | 35 | Constant pressure | 29.0 | 1 500.0 | 24.4 | 1 196.6 | 17.2 | 500.9 |
| 1-003A | 10.1 | 35 | Constant pressure | 24.1 | 40.5 | 40.6 | 10.9 | 24.3 | 1.4 |
| 1-009A | 10.1 | 35 | Constant pressure | 20.1 | 78.5 | 28.1 | 42.1 | 32.9 | 10.7 |
| 2-014A | 10.1 | 35 | Constant pressure | 24.4 | 272.0 | 31.8 | 122.0 | 26.7 | 19.4 |
| 2-010A | 10.1 | 35 | Constant pressure | 19.1 | 69.6 | 47.9 | 20.6 | 23.5 | 2.1 |
| 2-018A | 10.1 | 35 | Constant pressure | 25.9 | 5 800.0 | 5.8 | 4 679.0 | 21.3 | 811.4 |
| 2-010A | 10.1 | 35 | Constant pressure | 19.8 | 1 340.0 | 18.0 | 886.0 | 33.2 | 90.4 |
| 1-003A | 39.6 | 60 | 12.9 | 30.2 | 2 180.0 | 9.9 | 1 820.0 | 27.4 | 343.3 |
| 1-004A | 39.6 | 60 | 12.9 | 25.1 | 1 000.0 | 26.4 | 793.9 | 22.7 | 86.9 |
| 1-015A | 39.6 | 60 | 12.9 | 23.2 | 134.0 | 27.9 | 96.5 | 22.1 | 10.3 |
| 2-012A | 39.6 | 60 | 12.9 | 21.5 | 1 000.0 | 26.4 | 700.2 | 20.4 | 72.9 |
| 2-013A | 39.6 | 60 | 12.9 | 30.3 | 982.0 | 12.2 | 676.8 | 23.9 | 186.8 |
| 1-012A | 39.6 | 60 | 12.9 | 30.7 | 775.0 | 21.3 | 550.0 | 23.8 | 73.3 |
| 1-007A | 39.6 | 60 | 12.9 | 28.6 | 2613.0 | 13.3 | 2 221.6 | 9.3 | 655.3 |
| 1-008A | 39.6 | 60 | 12.9 | 29.9 | 914.0 | 16.9 | 886.4 | 21.1 | 293.6 |
| 1-025A | 39.6 | 60 | 12.9 | 31.6 | 3 070.0 | 14.2 | 1 920.0 | 31.0 | 464.0 |
| 1-016A | 39.6 | 60 | 12.9 | 29.1 | 2 640.0 | 15.0 | 1 230.0 | 31.7 | 274.0 |
| 2-009A | 39.6 | 60 | 12.9 | 28.0 | 5 730.0 | 10.7 | 4 910.0 | 20.0 | 872.7 |
| 2-002A | 39.6 | 60 | 12.9 | 23.0 | 1 950.0 | 10.5 | 784.2 | 28.5 | 300.3 |
| 2-001A | 39.6 | 60 | 12.9 | 25.4 | 1 840.0 | 11.5 | 1 060.0 | 27.5 | 243.6 |
| 2-008A | 39.6 | 60 | 12.9 | 33.2 | 1 130.0 | 22.8 | 390.0 | 28.0 | 78.0 |
| 1-004B | 50.8 | 53 | 11.5 | 31.6 | 193.0 | 23.6 | 135.0 | 25.3 | 24.8 |
| 1-008A | 50.8 | 53 | 11.5 | 31.0 | 410.0 | 25.7 | 180.0 | 31.1 | 72.3 |
| 1-017A | 50.8 | 53 | 11.5 | 31.1 | 480.0 | 19.9 | 327.2 | 21.4 | 62.1 |
| 1-012A | 50.8 | 53 | 11.5 | 29.2 | 393.0 | 32.7 | 146.0 | 34.2 | 26.8 |
| 1-019A | 50.8 | 53 | 11.5 | 30.1 | 1 010.0 | 17.7 | 890.6 | 20.9 | 265.4 |
| 1-005B | 50.8 | 53 | 11.5 | 26.8 | 1 230.0 | 14.1 | 715.5 | 23.0 | 154.0 |
| 1-006A | 50.8 | 53 | 11.5 | 22.9 | 443.0 | 21.4 | 355.3 | 21.9 | 53.3 |
| 1-025A | 50.8 | 53 | 11.5 | 33.3 | 2 010.0 | 29.7 | 889.0 | 21.2 | 361.0 |
| 1-020A | 50.8 | 53 | 11.5 | 27.9 | 2 370.0 | 27.0 | 998.0 | 28.4 | 460.0 |
| 1-023A | 50.8 | 53 | 11.5 | 34.0 | 1 980.0 | 25.6 | 832.0 | 22.9 | 431.0 |
| 1-027A | 50.8 | 53 | 11.5 | 32.8 | 1 350.0 | 30.9 | 643.0 | 24.2 | 214.0 |
| 1-014A | 50.8 | 53 | 11.5 | 24.4 | 1 230.0 | 24.6 | 467.0 | 24.6 | 210.0 |
| 1-015A | 50.8 | 53 | 11.5 | 26.0 | 2 410.0 | 42.5 | 656.0 | 16.2 | 154.0 |
| 2-015A | 50.8 | 53 | 11.5 | 33.4 | 5 790.0 | 15.6 | 1 990.0 | 24.4 | 1 110.0 |
| 2-024A | 50.8 | 53 | 11.5 | 30.9 | 1 230.0 | 22.9 | 525.0 | 24.1 | 275.0 |
| 2-019A | 50.8 | 53 | 11.5 | 25.6 | 854.0 | 29.8 | 377.0 | 30.2 | 89.6 |
| 1-005A | 141.8 | 50 | 10.0 | 34.1 | 3 490.0 | 24.1 | 1 360.0 | 22.0 | 715.0 |
| 2-013A | 141.8 | 50 | 10.0 | 25.0 | 1 670.0 | 27.8 | 488.0 | 24.0 | 187.0 |
| 2-006A | 141.8 | 50 | 10.0 | 24.8 | 832.0 | 28.9 | 332.0 | 26.4 | 111.0 |
Based on the above relative permeability experiment data of the 46 core samples, the correlations between water phase permeability under residual oil saturation and core permeability (equation (3), Fig. 4), and between water phase permeability under residual oil saturation and oil phase permeability under irreducible water saturation (equation (4), Fig. 5) were established, and the correlations are good.
Fig. 4.
Correlation between water phase permeability and core permeability under residual oil saturation.
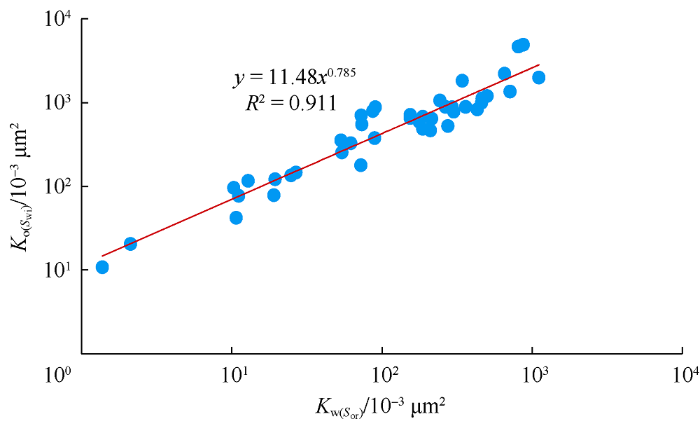
Fig. 5.
Correlation between the water phase permeability under residual oil saturation and the oil phase permeability under irreducible water saturation.
Therefore, after determining the viscosity of drilling fluid filtrate, substituting the water phase permeability under residual oil saturation calculated by equation (2) into equation (3) or (4), the mobility from PWD data can be converted into core permeability or oil phase permeability under irreducible water saturation. In order to verify the effectiveness of this method by using core permeability in the future, equation (3) was used to convert the mobility from PWD data into core permeability in this study.
1.3. Establishment of permeability model based on Timur formula
The emphasis of this study is how to use the scattered points to establish a continuous permeability model after transforming mobility from PWD to core permeability. Penglai 19-9 oilfield has abundant PWD data and the pressure points cover the whole main sand body vertically, so it is feasible to establish a continuous permeability model based on Timur formula.
Timur[15] established the classical Timur formula (5) by using the relative permeability data with core porosity and permeability data of 155 sandstone core samples from three North American oilfields. The general formula is formula (6).
Because the core samples in Penglai 19-9 oilfield are few and unrepresentative, a continuous permeability model based on Timur formula was established by using core permeability transformed from mobility from PWD, logging interpretation porosity and irreducible water saturation. The core permeability in equation (6) can be replaced by the core permeability transformed from mobility from PWD. In general, the accuracy of logging interpretation porosity is high, so the core porosity in equation (6) can be replaced by the logging interpretation porosity. Core irreducible water saturation can be fitted by conventional logging data and nuclear magnetic resonance logging data.
1.3.1. Calculation of irreducible water saturation
At present, the main methods to determine the irreducible water saturation include core experiment method and logging data prediction method. Core experiment method is a direct measurement method and the irreducible water saturation obtained is accurate, but coring is expensive and cannot obtain a continuous irreducible water saturation curve[16]. In this study, the irreducible water saturation is predicted by NMR logging combined with conventional logging data.
The irreducible water saturation is the key parameter to calibrate the Timur formula. Based on the classical formula for irreducible water saturation calculation equation (7)[17], equation (8) for calculating irreducible water saturation suit-able for Penglai 19-9 oilfield was fitted by using the data of irreducible water saturation and effective porosity calculated by NMR and shale content calculated by density and neutron curves of 8 evaluation wells.
The irreducible water saturation calculated by equation (8) is in good agreement with the core irreducible water saturation (Fig. 6). Fig. 7 shows that the absolute error between the fitted irreducible water saturation and core irreducible water saturation is within ±10%, which means that the fitted irreducible water saturation has accuracy high enough to meet the requirement of fitting Timur formula.

Fig. 6.
The comparison of fitted irreducible water saturation and core irreducible water saturation.
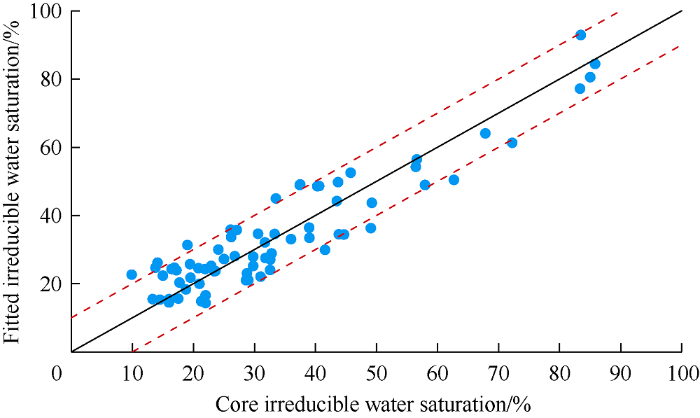
Fig. 7.
Accuracy analysis of fitted irreducible water saturation.
1.3.2. Establishment of permeability model
The permeability evaluation model of Penglai 19-9 oilfield was established by using core permeability data obtained from the conversion of mobility from PWD of more than 330 points in 21 wells and corresponding effective porosity and irreducible water saturation from logging interpretation to calibrate Timur general formula (6). The A, B, and C parameters in equation (6) obtained by calibrating Timur general formula are 2.60, 2.98, and 1.32, respectively. The fitting correlation is represented as equation (9) and the fitting correlation coefficient is 0.89 with high fitting accuracy. The permeability fitting chart of Penglai 19-9 oilfield under different porosity and irreducible water saturation conditions is established by equation (9) (Fig. 8), which makes it possible to evaluate formation permeability quantitatively and quickly.
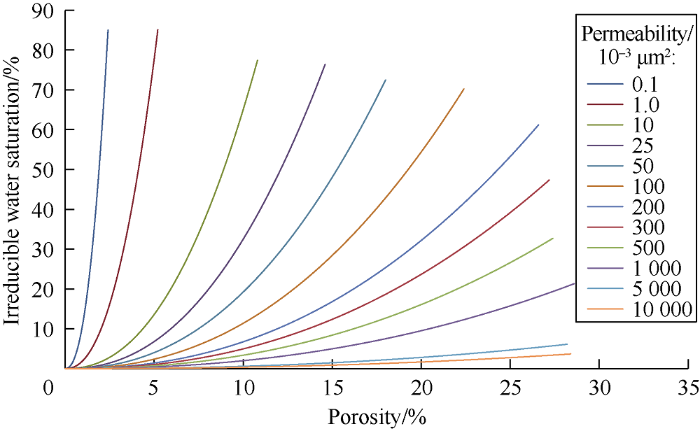
Fig. 8.
Fitted permeability chart of PL19-9 oilfield.
2. Application examples
2.1. An application example of the permeability model based on Timur Formula calibration
The calculated permeability results of Well A35 show that the permeability obtained by the new model is closer to the core measured value than that obtained by using the adjacent oil field model (Fig. 9). The relative error of calculated permeability by adjacent oilfield model is 112.5%-135.2%, while the relative error of that by the new model is 17.0%-35.5% (Table 3). In order to further verify the calculation accuracy of the new model, a well which wasn’t included in the establishment of the new model was selected, the core permeability by the conversion of mobility from PWD was compared with the permeability calculated by the new model and by the model of adjacent oilfields (Fig. 10). The results show that the result from the model in this paper is more consistent with the core permeability and higher in accuracy.
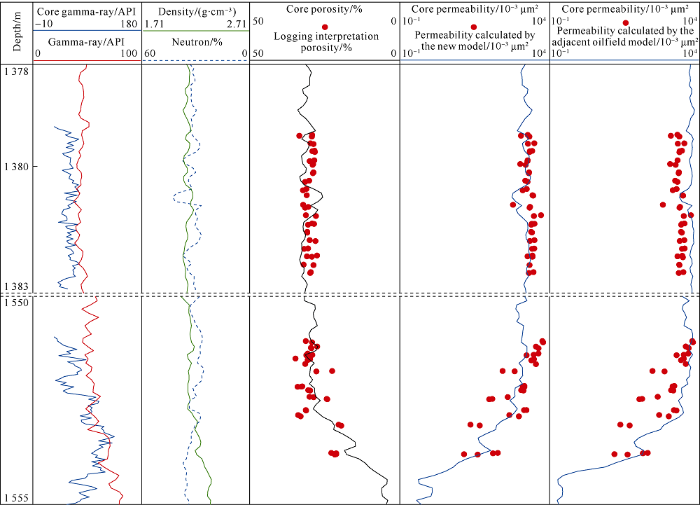
Fig. 9.
Comparisons of core permeability and permeability calculated by the new model and the adjacent oilfield model.
Table 3 Accuracy comparison of calculated average permeability of coring section of Well A35.
| Coring interval/m | Core permeability/ 10-3 μm2 | Calculated by adjacent oilfield model | Calculated by new model | ||||
|---|---|---|---|---|---|---|---|
| Permeability/ 10-3 μm2 | Absolute error/ 10-3 μm2 | Relative error/% | Permeability/ 10-3 μm2 | Absolute error/ 10-3 μm2 | Relative error/% | ||
| 1 379.2-1 382.5 | 1 939.4 | 4 562.0 | 2 622.6 | 135.2 | 1 609.8 | -329.6 | 17.0 |
| 1 551.1-1 553.8 | 1 512.0 | 3 213.4 | 1 701.4 | 112.5 | 975.0 | -537.0 | 35.5 |
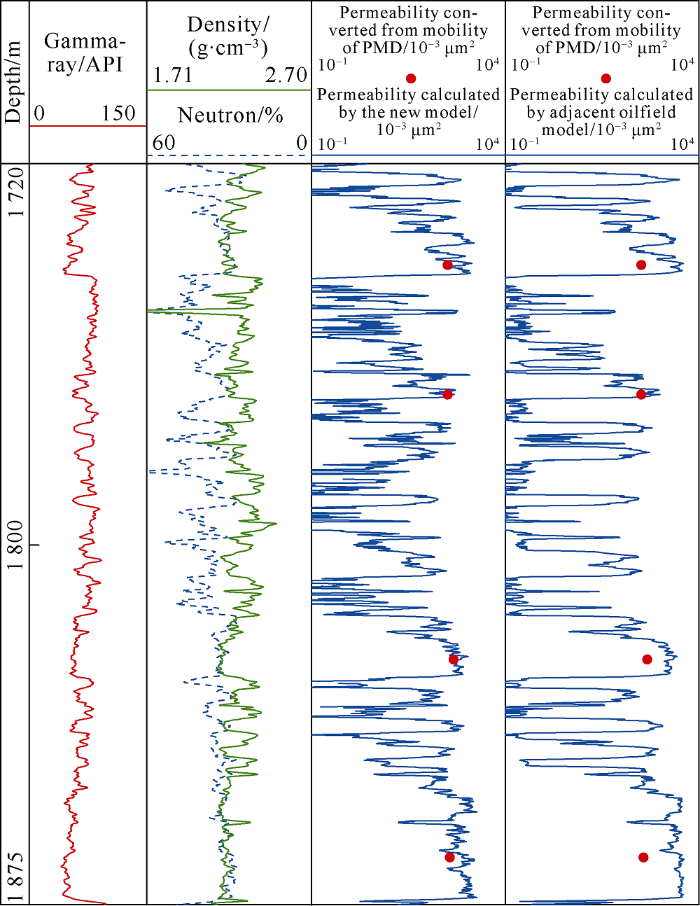
Fig. 10.
Comparison of permeability calculated by the new model and adjacent model with permeability after conversion PWD mobility.
2.2. Application of the new permeability model in productivity prediction
Reservoir permeability and fluid physical parameters under reservoir conditions are the most sensitive parameters affecting productivity prediction accuracy[18,19]. In theory, specific oil recovery index can be calculated by Dupuit formula (10). Generally, when well pattern parameters (re and rw) and fluid physical parameters (μo and Bo) change little, the specific oil recovery index and permeability are in linear relationship[20]. Therefore, the specific productivity index is actually determined by permeability or mobility, and productivity is predicted by using equation (11).
Due to the big difference of fluid properties in Penglai 19-9 oilfield horizontally, it is necessary to consider the effect of formation crude oil viscosity on productivity. Based on the new model and adjacent oilfield model, the correlations between specific productivity index and mobility of 16 wells in Penglai 19-9 oilfield have been established as equations (12) and (13). Compared with the adjacent oilfield model (Fig. 11a), the correlation between the specific productivity index and mobility fitted by the new model is better (Fig. 11b), which improves the prediction accuracy of specific productivity index significantly.
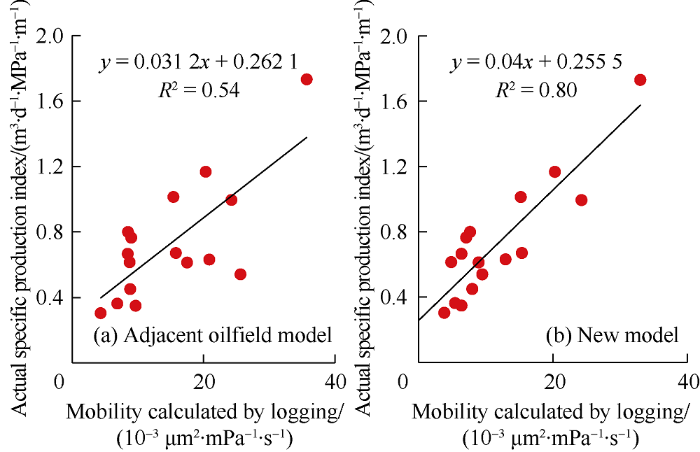
Fig. 11.
The correlations between mobilities calculated by the new model and adjacent oilfield model and actual specific production index.
By using equations (11) and (12), the production of four wells in Penglai 19-9 was predicted. It can be seen from Table 4, the specific productivity index and daily oil production predicted by using the new model are closer to the actual production data, indicating the new model can obviously improve the accuracy of productivity prediction, and has important guiding significance for the development well productivity prediction in the overall development plan of the oilfield.
Table 4 The comparison between productivities predicted by the new model and adjacent oilfield model with actual production data.
| Well number | Oil layer thickness/m | Pressure difference/ MPa | Viscosity of oil/ (mPa•s) | Adjacent Oilfield Model | New Model | Production Data | ||||||||
|---|---|---|---|---|---|---|---|---|---|---|---|---|---|---|
| Average permeability (thickness weighted)/ 10-3 μm2 | Specific productivity index/ (m3•MPa-1• d-1•m-1) | Oil production/ (m3•d-1) | Average permeability (thickness weighted)/ 10-3 μm2 | Specific productivity index/ (m3•MPa-• d-1•m-1) | Oil pro- duction/ (m3•d-1) | Specific productivity index/ (m3•MPa-1• d-1•m-1) | Pressure difference/ MPa | Oil pro- duction/ (m3•d-1) | ||||||
| A31 | 33.7 | 4 | 50 | 1 306 | 1.08 | 145.2 | 485 | 0.67 | 90.7 | 0.54 | 5.1 | 92.9 | ||
| A40 | 26.0 | 4 | 53 | 927 | 0.84 | 87.4 | 476 | 0.64 | 66.6 | 0.61 | 4.4 | 70.0 | ||
| A39 | 70.3 | 4 | 82 | 1 710 | 0.95 | 267.1 | 1 063 | 0.81 | 227.8 | 0.63 | 5.4 | 239.2 | ||
| A30 | 45.0 | 4 | 42 | 854 | 0.93 | 167.4 | 852 | 1.13 | 203.4 | 1.17 | 4.1 | 215.9 | ||
3. Conclusions
The product of mobility from PWD and viscosity of drilling fluid filtrate approaches infinitely to the water phase permeability under the residual oil saturation in relative permeability experiment. Based on this observation, a method to convert mobility from PWD to core permeability has been proposed and a permeability evaluation model based on Timur formula has been established.
Compared with permeability calculated by the neighboring oilfield model, the permeability calculated by the method proposed in this study has a better match with permeability from core analysis, proving the new model can improve the accuracy of permeability evaluation. This new method solves the problem of permeability evaluation when lacking of porosity and permeability data from core analysis.
The mobility calculated by the new method in this study is better correlated with specific productivity index. This method was applied to four wells in Penglai 19-9 oilfield for productivity prediction, and the results match well with the actual production data. This method can improve the accuracy of productivity prediction and is worth promoting.
Nomenclature
a, b, c—Correlation coefficients related to lithology;
A, B, C—Fitted coefficients related to pore structure;
Bo—Volume coefficient of the formation crude oil;
G—Shape factor;
h—Thickness of perforated oil layer, m;
Jos—Specific oil recovery index, m3/(d•MPa•m);
Jos_p—Specific oil recovery index of production well, m3/(d•MPa•m);
Kb—Permeability calculated by the adjacent oilfield model, 10-3 μm2;
${{K}_{\text{core}}}$—Core permeability, 10-3 μm2;
${{K}_{\text{core }\!\!\_\!\!\text{ Mb}}}$—Permeability converted from mobility from PMD, 10-3 μm2;
Kn—Permeability calculated by the new model, 10-3 μm2;
Ko—Oil phase permeability, 10-3 μm2;
${{K}_{\text{o}\left( {{S}_{\text{wi}}} \right)}}$—Oil phase permeability under irreducible water saturation, 10-3 μm2;
${{K}_{\text{w}({{S}_{\text{or}}})}}$—Water phase permeability under residual oil saturation, 10-3 μm2;
psf—Formation pressure near wellbore, MPa;
pr—Formation pressure, MPa;
pwf—Bottom hole flowing pressure, MPa;
p(t)—Pressure measured by pressure gauge at t, MPa;
Qo—Predicted oil production, m3/d;
re—Oil supply radius, m;
rp—Probe radius, cm;
rw—Wellbore radius, m;
Sor—Residual oil saturation, %;
Swi_core—Irreducible water saturation from core analysis, %;
Swi_log—Irreducible water saturation from logging interpretation, %;
Swi_Nmr—Irreducible water saturation from nuclear magnetic resonance logging, %;
t1—Starting time of pressure drop test, s;
t2—End of pressure buildup test, s;
t—Test time, s;
V—fluid volume extracted in pre-test, cm3;
Vsh—Shale content, %;
μmf—Viscosity of drilling fluid filtrate, mPa•s;
μo—Viscosity of formation crude oil, mPa•s;
ϕcore—Core porosity, %;
ϕlog—Effective porosity from logging interpretation, %;
ϕNmr—Effective porosity from nuclear magnetic resonance logging, %;
λMb—Mobility from PWD, 10-3 μm2/(mPa•s).
Reference
Logging facies division and permeability evaluation based on graph theory multi resolution clustering: A case study of Guantao Formation in Well W block of P oilfield in Bohai Sea
Logging facies classification and permeability evaluation: Multi-resolution graph based clustering
Accurate permeability estimation in a heterogeneous middle east carbonate field through facies classification and core-log integration
An interpretation method for permeability based on flow units and its applicability
New calculating methods of formation permeability from MDT mobility
Calculating gas phase permeability with drawdown fluidity tested by MDT for low permeability gas reservoir
Application of cable formation test data in productivity prediction of low permeability gas reservoirs
Geological characteristics and hydrocarbon accumulation pattern of Penglai 19-3 oilfield
Permeability characterization and directional wells initial productivity prediction in the continental multilayer sandstone reservoirs: A case from Penglai 19-3 oil field, Bohai Bay Basin
Application of Stethoscope pressure while drilling in Z Oilfield of South China Sea
Analysis and consideration of formation testing while drilling technology
Application of Geo-Tap in well E3S of Bozhong25-1 Oilfield
On real time data processing method of formation tester while drilling (Geo- Tap)
An investigation of permeability, porosity, and residual water saturation relationships
Study on the method of prediction of irreducible water saturation by combining mercury intrusion and NMR logging data
An approach for reservoir yield prediction using WFT and its applications
Improving permeability and productivity estimation with electrofacies classification and core data collected in multiple oilfields
Methodology for determining productivity of new oilfields
