


Introduction
Tight sandstone reservoirs are widely distributed and rich in resources, so it is an important field of global oil and gas exploration and development[1,2,3,4]. Tight sandstone reservoirs have poor physical properties, strong heterogeneity and complex pore structure and they are usually proximal reservoirs. Compared with conventional sandstone reservoirs, tight sandstone shows great difference in reservoir characteristics and logging response characteristics[5,6,7,8,9]. In particular, in the case of complex pore structure, the electrical response law of tight sandstone is complex, and a large number of "non-Archie" phenomena, that is, the resistivity increase rate and water saturation present a nonlinear relationship in log-log coordinates, and the existing saturation evaluation models are no longer applicable[10,11,12,13], which brings about great challenges to logging saturation evaluation of tight sandstone reservoir. At present, in the physical modeling of such complex reservoirs at home and abroad, the experimental equipment and test process used are still the traditional technical ones[14,15,16,17] designed for the medium to high porosity and permeability reservoirs, which aren’t high enough in measurement accuracy and applicability of the measurement results. In particular, there is no reliable experimental means to study the response law of the resistivity of tight sandstone reservoir with the change of fluid properties, and the conventional displacement experiment can’t realize the physical modeling at nearly 20 MPa pressure difference. Therefore, it is urgent to do systematic and in-depth basic research on petrophysics.
In view of the above problems, taking the tight sandstone reservoir in Member Chang 7 of the upper Triassic Yanchang Formation (hereinafter referred to as Member Chang 7) in Ordos Basin as study object, we designed a novel experimental method combining high speed centrifugal rock displacement with nuclear magnetic resonance T2 spectrum for tight sandstone. And by conducting micro CT Scanning, Scanning Electron Microscopy rock mineral Quantitative analysis (Quantitative Evaluation of Minerals by Scanning Electron Microscopy, referred to as “Qemscan”) and micro Scanning images stitching (Modular Automated Processing System, referred to as the “MAPS”) and other supporting test experiments, this paper attempts to establish a fine construction method of 3D digital core of tight sandstone. Based on the results of rock electrical experiments, the resistivity finite element numerical simulation method is used to study the electrical response of tight sandstone under the condition of medium and low water saturation, so as to build a variable rock electrical parameter saturation model based on pore structure to improve the logging evaluation accuracy of tight sandstone saturation.
1. Rock electrical test method for tight sandstone
As tight sandstone has poor physical properties and complex pore structure, conventional gas-driven rock electrical experiments are unable to displace the fluid in tiny pores of the core, so the core would have high water saturation, making it impossible to further study the electrical conductivity of tight sandstone. Out of the above reasons, we have worked out an experimental method of high-speed centrifugal displacement for rock electrical property (hereafter referred to as "centrifugal rock electricity") combined with NMR T2 spectrum measurement after centrifugation at different speeds (i.e., different water saturation). The centrifugal machine used in the experiment was URC-628 made by the US. CoreTest company, which can reach the maximum rotating speed of 16500 r/min.
As tight sandstone has small pore space and high content of micropore, three rotating speeds of 6000, 12000 and 15000 r/min were selected for centrifugation of each rock sample. In the specific operation, each core was first placed in the centrifuge gripper in the right direction and centrifuged for a period of time (about 2 hours) at a certain speed, and then the core was taken out and placed in the opposite direction and centrifuged for another period of time at the same speed. After set aside in the centrifuge for some time to reach equilibrium, the core was taken out of the centrifuge and measured for resistivity and the NMR T2 spectrum of the core at this water saturation. The main purpose of this operation is to ensure that the fluid in the core reaches equilibrium as far as possible before other petrophysical measurements are made. Compared with the conventional gas-driven and clapboard experiments, the joint centrifugal rock electricity and NMR T2 spectrum experiment has the following advantages: first, tight sandstone cores with a permeability of less than 0.1×10⁻³ μm2 can be displaced, solving the problem that it is difficult to reduce the water saturation of tight sandstone by conventional experimental methods; second, the experimental period is greatly shortened and the experimental efficiency is improved; the fluid distribution in the pores under different water saturation conditions can be analyzed, which is helpful to study the influence of pore structure on the electrical property of rock.
In order to verify the feasibility of the centrifugal rock electrical experiment method, before conducting the tight sandstone rock electrical experiment, a Bera sandstone sample was firstly selected, and conventional gas-driven rock electricity and centrifugal rock electricity experiments were carried out on the same Bera sandstone sample to compare the differences of experimental measurement results from the two methods. The Bera sandstone sample has a porosity of 18.6% and permeability of 109.9×10⁻³ μm2. The measurement results are shown in Fig. 1a. The results of centrifugal rock electrical property and conventional gas-driven rock electrical property experiments of the Bera sandstone sample with medium and high porosity and permeability are basically consistent. The n value is 1.82 by fitting the experimental data of centrifugal rock electricity, and the n value of gas-driven rock electric experiment is 1.78, the two are close to each other. This further shows that the centrifugal rock electrical test method is feasible and the measured results are accurate and reliable.
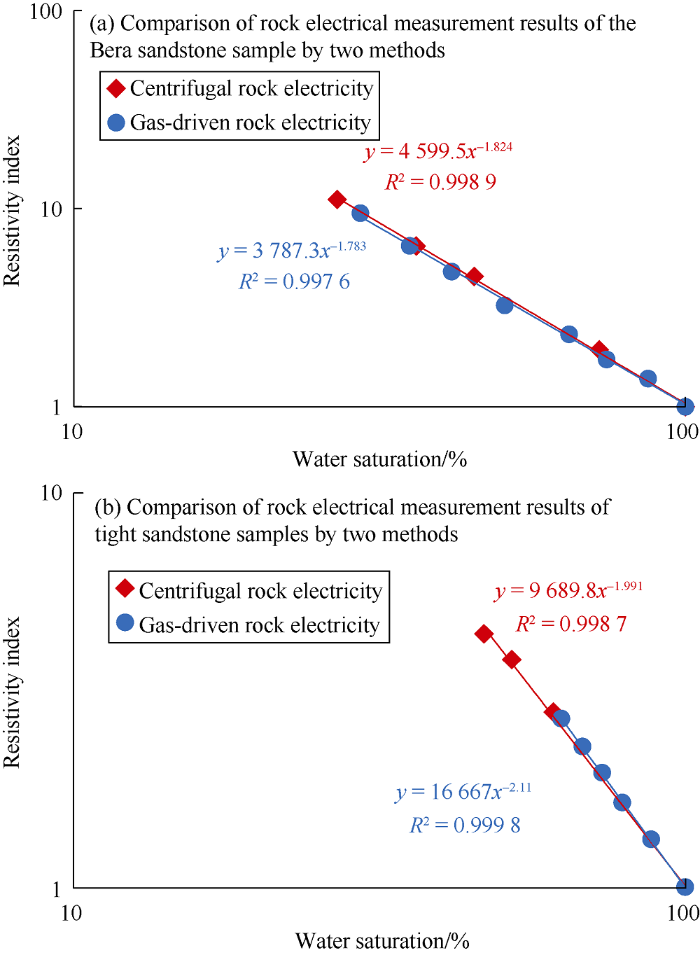
Fig. 1.
Comparison of two kinds of rock electrical measurement results of Bera sandstone and tight sandstone.
Three samples were selected from Member Chang 7 tight sandstone core to measure their electricity by conventional gas-driven method and centrifugal method, and the measurement results of the two experimental methods were compared. Take sample No.2 as an example, as shown in Fig. 1b, the core water saturation can be reduced to about 45% at the maximum rotation speed of 15000 r/min of the centrifuge. In contrast, the water saturation in gas-driven rock electrical experiment can only be reduced to about 60%. The fitted n value from centrifugal rock electrical experiment results is 1.99, while that from gas-driven rock electrical experiment results is 2.11. As smaller amount of water in the core was displaced in the gas-driven experiment, the n value measured by the rock electrical experiment is larger, and cannot truly reflect the oil-bearing situation of the tight sandstone reservoir. In comparison, the saturation n value obtained by centrifugal method is more reasonable. Comparing the results of the 3 tight sandstone samples obtained by the two experimental methods, it is found that the n values obtained by the gas- driven experiment are generally larger than those obtained by the centrifugal rock electrical experiment, which is mainly because the displacement pressure of the conventional gas-driven rock electrical experiment is about 200Psi (1.4 MPa), which corresponds to the rotating speed of about 7000 r/min in the centrifugal rock electrical experiment. Such low pressure in the gas-driven rock electrical experiment can’t displace the core water saturation to a lower range. Therefore, the results of conventional gas-driven rock electrical experiment cannot reflect the electrical response characteristics of tight sandstone under low water saturation.
2. Fine construction and numerical simulation of tight sandstone digital cores
The modified centrifugal rock electricity experiment method increases the displacement pressure, and can displacement water saturation to a low range, which can reflect the real situation of tight sandstone reservoir as much as possible, but limited by the physical properties of tight sandstone and experimental conditions, it is still difficult to reflect the whole process of accumulation in tight sandstone. For example, data analysis of oil-bearing tight sandstone samples from Member Chang 7 of closed coring wells in Longdong area, Ordos Basin shows that oil saturation of tight sandstone core samples can be up to 85%. Therefore, it is necessary to come up with a method to build 3D digital core of tight sandstone, so as to realize the characterization of micro-pores in tight reservoir, and then carry out numerical simulation of resistivity of tight sandstone closer to the true water saturation of reservoir to find out electrical response law of tight sandstone.
The traditional 3D digital core construction method uses the core CT scan data and adopts a single threshold method for image segmentation, that is, each pixel is regarded as either 0 or 1, and either pore or skeleton. In fact, for tight sandstone, each pixel of the micro-CT image represents a reservoir unit of a certain volume (equivalent to resolution scale), and there are also micro-pores invisible to micro-CT in the unit, but these micro-pores have a great impact on the conductivity characteristic of the rock sample. Therefore, it is necessary to carry out supporting Qemscan and MAPS experiments, and analyze the contribution of each type of pore to the total pores on the basis of identifying different mineral components. By carrying out supporting experiments, the contradiction between CT scan resolution and sample size can be effectively solved. The multi-component fine 3D pore lattice constructed by the fusion of multi-source experimental information can fully consider the contribution of micro-pores, laying a foundation for resistivity simulation. Fig. 2 shows the procedure and workflow of the 3D digital core construction based on multi-source experimental information and resistivity numerical simulation.

Fig. 2.
Construction of multi-mineral component 3D digital core and numerical simulation process of resistivity.
2.1. High precision supporting experiments
Member Chang 7 tight sandstone reservoir contains a large number of secondary dissolution pores, including intergranular dissolution pores, granular dissolution pores and moldic pores, etc. Moreover, the dissolution pores take the majority, while the residual primary intergranular pores take only a small proportion[18,19]. In this study, high precision micro-CT scanning technology, and the most advanced Qemscan and MAPS matching experiments, were combined to describe pore development characteristics.
A micron CT scanner produced by general electric company was used to obtain grayscale images and data of core samples by X-ray CT scanning. In consideration of the strong heterogeneity of the tight sandstone of Member Chang 7 reservoir, plug samples with a diameter of 25 mm were adopted in this study, and the space resolution of 7.6 micron was taken, which not only guarantees the representativeness of the scanned samples, but also makes it convenient to compare with the resistivity simulation results and experimental results directly. In grayscale image segmentation, as X-ray CT cannot recognize the pore space smaller than the scanning resolution, the segmentation threshold cannot be determined based on the porosity test results, but should be reasonably selected according to the distribution of gray values of the grayscale image. Limited by resolution, the porosity from 3D digital core is usually lower than that measured by experiment, especially for tight sandstone with poor physical properties. Comparing the porosity identified by CT with the porosity measured by experiment of 8 tight sandstone samples from Member Chang 7 shows that CT can only identify part (no more than 50%) of the pores at the space resolution of 7.6 μm. Therefore, for tight sandstone, it isn’t proper to build digital core by using porosity from high resolution CT scanning alone, rather the CT scanning should combine with other high resolution measurement methods able to characterize the types and sizes of micropores in tight sandstone.
In order to identify the mineral components of core samples, Qemscan 650F instrument made by FEI Company was used for experimental testing. Qemscan test can not only provide the distribution map of mineral components, but also output the two-dimensional grayscale image of the same section. The grayscale of the grayscale image is correlated with the atomic number of the mineral components. The higher the atomic number, the higher the gray value will be, while the density of the mineral component is positively correlated with the atomic number. Therefore, the relationship between gray scale and mineral components can be established through Qemscan test, that is, the relationship between gray value range of CT scanning and color of Qemscan. Fig. 3a is a micron CT image of No. 2 core sample. Fig. 3b shows the Qemscan test results of the same core sample in the same area. It can be seen that the rock skeleton is made up of mainly sodium feldspar, quartz and potassium feldspar, while the clay minerals consist of mainly chlorite, illite and kaolinite. Among them, chlorite is higher in content, and the porosity identified by Qemscan test is only 2.82%. Paired CT and Qemscan experiments were carried out on several tight sandstone core samples from Member Chang 7, and the distribution range of CT gray values of different mineral components can be determined according to the experimental results.

Fig. 3.
Examples of CT and Qemscan scan results of the same area of a tight sandstone sample from Member Chang 7 (corresponding mineral contents are indicated in parentheses).
The pore structure and fluid of the rock have significant impact on the electrical properties of the rock, but X-ray CT can only identify a large part of pores in tight sandstones. In order to simulate resistivity accurately, the types and size distribution of unrecognized pores must be quantitatively analyzed. In this work, the distribution of micropores was studied by MAPS test. In core MAPS test, the rock section is divided into units, and SEM image of each unit is taken, and then the unit images are spliced together to form SEM images of the section, so as to realize image scaling and other functions with an accuracy of up to 100nm. With this method, the residual intergranular pore, feldspar dissolution pore and interstitial micropore can be identified. Fig. 4 shows the different types of pores observed in the MAPS experimental image of No. 2 core sample.

Fig. 4.
MAPS of different pore types in tight sandstone samples from Member Chang 7.
2.2. Fine construction method of three-dimensional digital core
On the basis of the above high-precision supporting experiments, multi-source experimental information was fused to construct the 3D digital core of multi-mineral components according to the workflow shown in Fig. 2.
Firstly, CT and Qemscan scan results of the same region in a tight sandstone sample were selected, and the two scanned images were registered to establish the corresponding relationship between the gray value range measured by CT experiment for different mineral components and the experimental colors of Qemscan, namely, the gray value distribution interval on the CT image corresponding to each mineral component was determined. Then, the experimental results of Qemscan were used to register the experimental results of MAPS. In specific operation, a certain number of images with the same nanoscale resolution were scanned in the selected area of the core samples that have been measured in the Qemscan experiment. And then ImageJ software was used to piece together all the collected images to form a two-dimensional backscattered electron image with nanoscale resolution. The locations with obvious features on the Qemscan image were selected, and then the locations with the same features were found on the MAPS image, and the location registration was conducted on the two images. In other words, the pore development characteristic images of MAPS after registration by Qemscan experiment were obtained. The distribution, size and content of each pore type inside the core can be obtained by magnifying local parts of the MAPS image after registration. Based on the above multi-source experimental information, multi-component 3D digital core was constructed by multi-threshold segmentation of CT experimental data, and the total porosity of the digital core was calculated. According to the core porosity measured in the laboratory and the experimental results of X-ray diffraction analysis (XRD), the multi-threshold segmentation parameters of CT images were adjusted until the total porosity calculated by the 3D digital core was close to that measured in the laboratory.
According to statistics of a large number of MAPS images of Member Chang 7 tight sandstone samples, the pore space in tight sandstone is divided into: residual intergranular pore, dissolution pore in potassium feldspar and calcite, micropore in illite and kaolinite, intercrystalline pore in quartz and sodium feldspar, and micropore in chlorite. The contribution ratios of the above five types of pores to the total pores were calculated, and the total porosity of multi-component 3D digital core was expressed as:
Fig. 5 shows the micro CT image of No. 2 sample (Fig. 5a) and the multicomponent three-dimensional digital core constructed by the above method (Fig. 5b). The gas tested porosity of the sample was 10.0%, while its single threshold segmentation processing porosity is only 3.8%. The porosity calculated from the fine pore lattice established by this method is 10.3%, which is very close to the experimental porosity. The 3D tight sandstone digital core constructed by combining multi-source experimental information including high-resolution CT scan, Qemscan and MAPS data fully considers the contribution of micropores and provides accurate input information for the next resistivity numerical simulation.
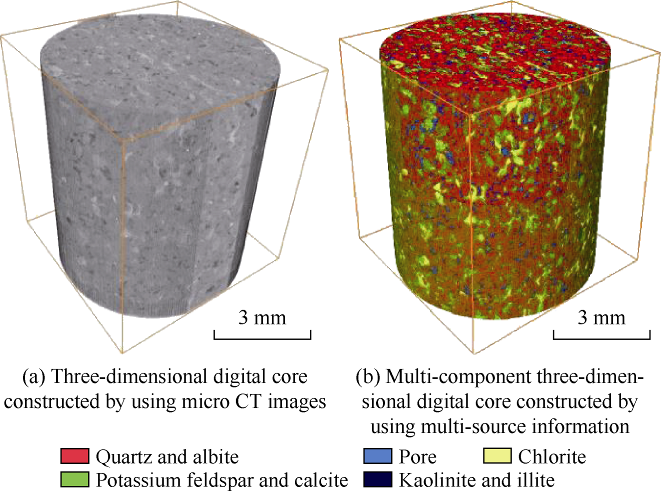
Fig. 5.
A three-dimensional digital core construction example of No.2 plug sample of tight sandstone.
2.3. Finite element numerical simulation method for resistivity characteristics
Finite element method (FEM) is a numerical simulation method, its basic principle is the variational principle, which converts partial differential equations into algebraic equations to solve [20,21]. First, the functional corresponding to the partial differential equation is established, which is the solution of partial differential equation when taking the extreme value. For a given 3D digital core, an electric field is applied at both ends, and the final voltage distribution on each pixel determines the energy E of the entire 3D digital core. According to the variational principle, solving the voltage distribution on each pixel is transformed into a question of solving the system energy extremum, and finally determining the effective conductivity of digital core. In order to make the energy E minimum, the partial derivatives of energy with respect to the variable uj (node voltage) are all zero, i.e.
In the numerical solution process, when the sum of squares of the gradient vector formed by partial derivatives of energy E to voltage at j nodes is less than a given allowable error, the equation can be approximately considered valid, that is, the voltage distribution and effective electrical parameters in the 3D digital core are determined.
In the finite element resistivity simulation program, each element is considered as a unit, and the conductivity of a unit depends on the mineral composition represented by the voxel point. In the algorithm, the global matrix (also known as the overall stiffness matrix) occupies a large amount of computer memory space. In order to ensure the accuracy of numerical simulation, the physical quantities such as voltage, current and energy in the program are defined as double precision. In this study, based on the numerical simulation algorithm of resistivity of homogeneous sandstone and the multi-mineral components three-dimensional digital core of tight sandstone, the equivalent resistivity of different mineral components were determined to simulate the resistivity of tight sandstone.
The resistivity index was simulated by finite element method, and then numerical simulation result of saturation exponent n was simulated by the relationship between resis-tivity index and water saturation. The simulation results of n obtained are basically consistent with the experimental results. Fig. 6 shows the simulated relationships of resistivity index and water saturation of two core samples. It can be seen from the figure that the numerical simulation results are close to the experimental results within the range of rock-electric test saturation, which verifies the accuracy of the algorithm. For the two tight sandstone samples with relatively better physical properties, their relationships between resistivity index and water saturation from experiment both show down warp under medium-low water saturation. Rock electrical experiment data show that the tight sandstone samples from Member Chang 7 reservoir have lower gas displacement degree. The rock electrical experimental results of high-speed centrifugal displacement were used to scale the numerical simulation results in the medium-high water saturation interval, and the numerical simulation results were effectively extended in the medium- low water saturation interval. Combining the results of rock physical experiments and numerical simulation, it can be seen that the relationship between resistivity index and water saturation curve corresponding to the micro pore of tight sandstone presents a bending phenomenon; and the n value is affected by the pore structure, that is, with the continuous decrease of water saturation, the n value tends to decrease gradually.
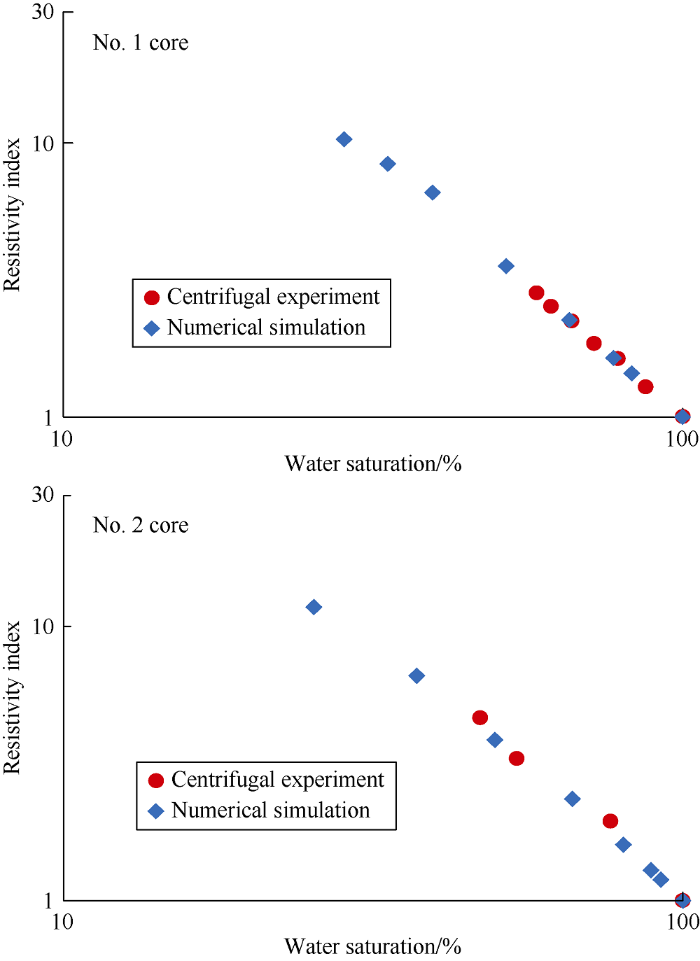
Fig. 6.
Comparison of centrifugal rock electrical test and numerical simulation results of two tight sandstone samples.
3. Electrical response rule of tight sandstone
An experiment of high-speed centrifugal displacement combined with nuclear magnetic resonance T2 spectrum was conducted on 19 cores of tight sandstone of Member Chang 7 and the correlation of rock electricity response is shown in Fig. 7. The relationship between porosity and formation factor of Member Chang 7 tight sandstone is approximately a straight line in the log-log coordinate system (Fig. 7a), while the relationship between water saturation and resistivity index of the tight sandstone is quite scattered, and the n value varies widely from 1.74 to 4.64 (Fig. 7b). In order to analysis the influence factors of tight sandstone resistivity, 19 cores of chang7 tight sandstone were carried centrifugal experiment, and the relationship between water pore volume and resistivity in final state is shown in Fig. 8a. The figure shows that in general the resistivity is monotonic function of water volume, and decreases with the increase of water volume, but laboratories present zonal distribution and to a certain extent, the resistivity is affected by the pore structure.
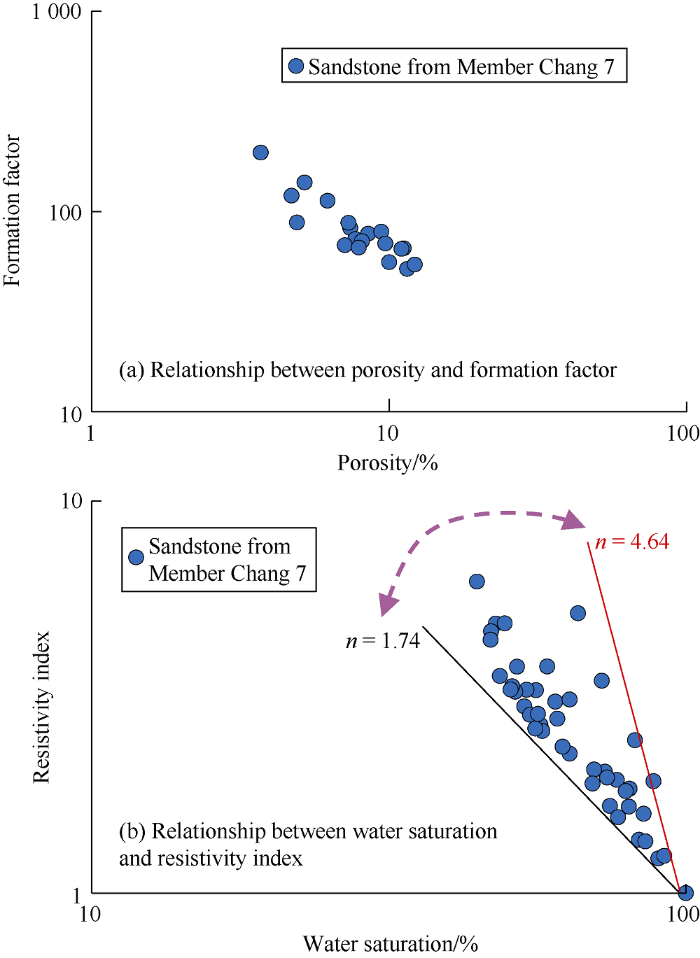
Fig. 7.
Rock electrical responses of tight sandstone samples from Member Chang 7.
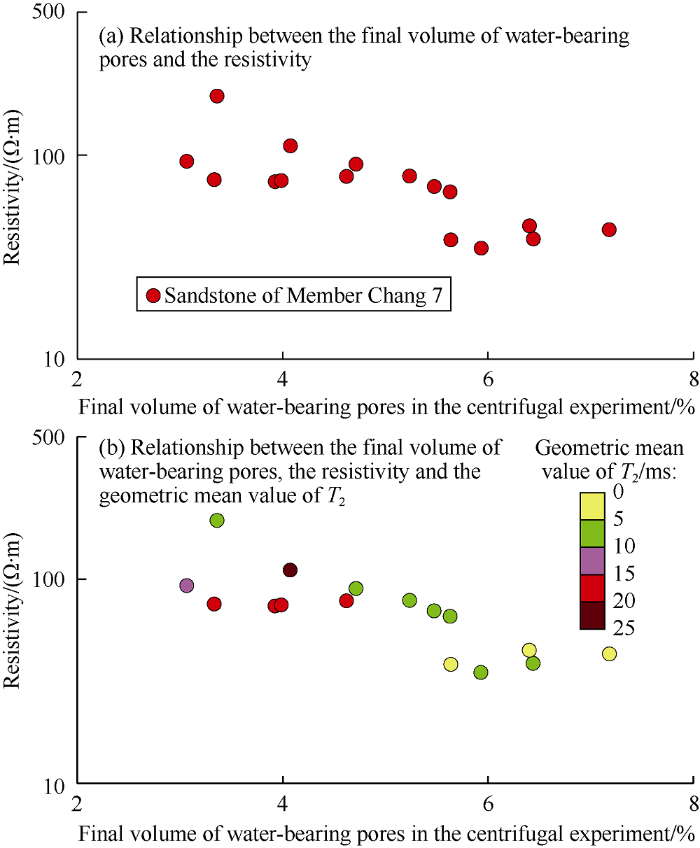
Fig. 8.
Relationship between the final volume of water-bearing pores in the centrifugal experiment, the resistivity and the geometric mean value of T2.
The color code of the data points in Fig. 8b represents the magnitude of the geometric mean of T2. The increase of the geometric mean of T2 indicates that the pore structure of the core transitions from primarily small pores to large pores, conversely, represents the core pore structure gets worse. It can be seen from this figure that the final water-bearing volume of the core with poor pore structure (mainly with small pore development) after centrifugation is large because the pore throat radius is small, and it is difficult to reduce the water-bearing saturation of this kind of sample to a very low degree even by centrifugation method (at the maximum rotating speed of 15000 r/min). The resistivity values of different cores with the same water-bearing pore volume vary greatly in the longitudinal direction, which is more significant for cores with poor pore structure (data points marked in green and yellow), further indicating that pore structure has a greater impact on resistivity under the same water-bearing volume. When the water-bearing pore volume is approximately 3%, the resistivity values of the green experimental points with poor pore structure differ greatly from those of the red experimental points with good pore structure, which further indicates that the complexity of pore structure leads to the increase of resistivity value of the tight core sample. In conclusion, tight sandstone resistivity is a comprehensive function of porosity, water saturation and pore structure.
After the factors influencing electrical property of tight sandstone were sorted out, it is necessary to further find out the variation pattern of the electrical parameters of tight sandstone with the pore structure, so as to provide a basis for accurate calculation of saturation. Fig. 9 shows the relationship between porosity and n value of tight sandstone of Member Chang 7. In order to analyze the factors influencing n value, experimental points were selected from three directions and the NMR T2 spectrum corresponding to each point was listed. The values in the figure represent the proportion of large pores in the core (that is, the ratio of pores with T2 value of more than 10 ms to the total porosity). It can be seen from the figure, vertically, under the condition of similar porosity (around 8%) but different pore structures, that is, when the proportion of large pores in T2 spectrum increases gradually, the n value decreases gradually. Laterally, under the condition of similar n value (approximately 1.8), the corresponding T2 spectrum presents two peaks, that means the proportions of large pores and small pores in the core are close. Under similar pore structure, although the porosity is different, the n value is stable. Inclined downward, the porosity increases gradually, the large pore component in the pore structure increases gradually, and the n value decreases gradually.
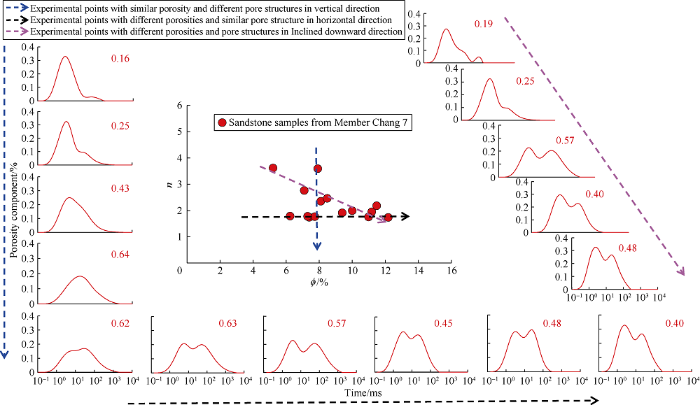
Fig. 9.
Relationships between ϕ, n and NMR T2 spectrum of tight sandstones from Member Chang 7 (Red values in the figure represent the proportion of large pores in samples).
The behavior of the core samples in the experiment can be summarized as the relationship between porosity and n value, as shown in Fig. 10, which is characterized by three end members: the experimental area in the upper left corner generally corresponds to the core samples with low porosity and poor pore structure; the lower left area mainly corresponds to the core samples with low porosity and good pore structure; the area at the lower right corresponds to the core samples with high porosity and good pore structure. The triangular region formed in this figure has similar porosity from top to bottom, and the pore structure gradually becomes better, that is, the content of macropores increases, and the n value gradually decreases. From left to right at the bottom of the triangle, the porosity increases, the pore structure is relatively good, the proportion of large pores in the core is close to 50%, and the n value is relatively small, at around 1.8. For tight sandstone samples, generally the shale content is relatively low (generally within 10%), and the greater the porosity, the better the pore structure of the core, and the smaller the corresponding range of n value will be. In order to verify the universality of the three-end-member rock electrical response characteristics of porosity and n value of Member Chang7 tight sandstone in Ordos Basin, 11 representative tight sandstone samples (with different porosity and permeability) of Fuyu reservoir in Songliao Basin were selected, and the same experimental method and analysis process as Member Chang 7 tight sandstone were used. As shown in Fig. 10, the tight sandstone samples from Fuyu reservoir show similar pattern with that of Member Chang 7 tight sandstone samples, which further demonstrates that this rock electrical rule is universal in tight sandstone.
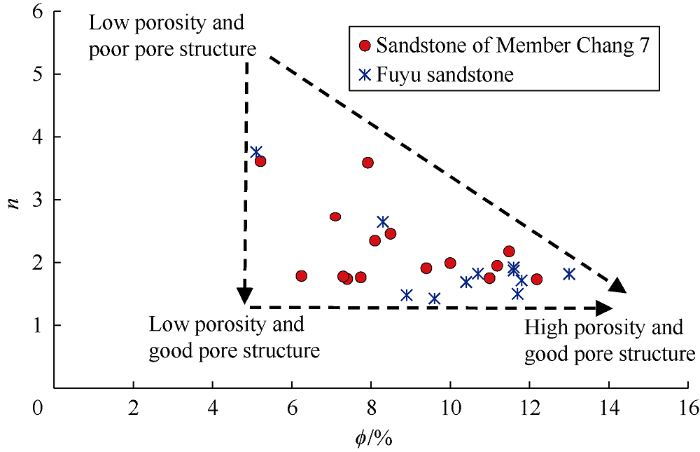
Fig. 10.
Relationship between porosity and n of tight sandstone samples from Member Chang 7 in Ordos Basin and Fuyu sand group in Songliao Basin.
4. Saturation evaluation of tight sandstone
Because pore structure of tight sandstone has significant influence on the rock electrical parameter, it is necessary to extract the characterization parameter of pore structure to construct corresponding model. As we all know that NMR T2 spectrum is the most direct method to reflect the distribution of rock pores[22,23], pore structure parameters which can represent the changes of pore structure and better reflect the changes of rock electrical property were searched from NMR T2 spectrum. The above response pattern between physical and electrical parameters of tight sandstone indicates that the variation of n value is controlled by the ratio of large pores to small pores. Therefore, the boundary between large pores and small pores can be determined by using NMR T2 spectrum to obtain the ratio of large pores to small pores of each tight sandstone sample. The mercury injection analysis data of the 19 tight sandstone samples from Member Chang 7 were used to convert them into the distribution diagram of the pore throat radius, as shown in Fig. 11a. The three colors in the figure indicate that the 19 cores are divided into three categories (good, medium and poor) according to pore structure. It can be seen from the figure that, bounded by 0.2 μm, both good and medium samples have the peak of macropore throats on the right of 0.2 μm, while the poor pore structure samples all have pore throat radius peak on the left of 0.2 μm.
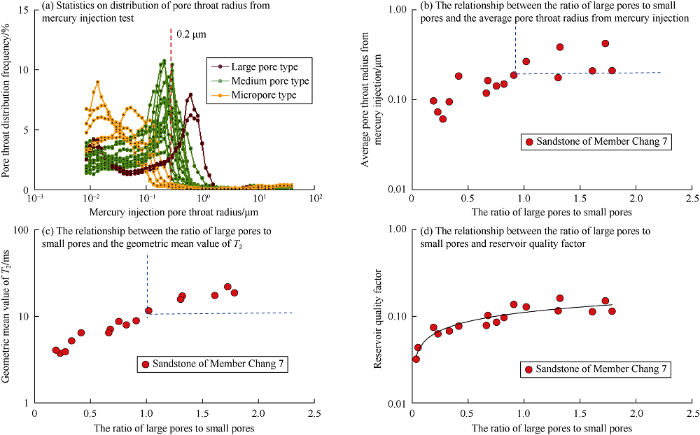
Fig. 11.
The basis for determining the ratio of large pores to small pores of tight sandstone samples from Member Chang 7.
Through comprehensive analysis of pore throat radius distribution of the three types of samples, 0.2 μm was determined as the dividing boundary between large pore and small pore. And according to formula (3), the boundary between large pore and small pore on T2 spectrum is 10 ms.
From Fig. 11b to Fig. 11d, we can see that using 10 ms as the boundary, the ratio of large to small pores has good correlation with the average pore throat radius from mercury injection, T2 geometric mean and reservoir quality, and can reflect the change of tight sandstone pore structure. This further proves that taking 10 ms on NMR T2 spectrum as the dividing point between large and small pores is reasonable and feasible, and its corresponding boundary of pore throat radius is 0.2 μm.
The relation between n value and the ratio of large pores to small pores of chang7 tight sandstone was determined, which is bounded by NMR T2 spectrum at 10 milliseconds (Fig. 12), and the functional relation between the two is expressed as equation (4). The n value conforms to the changing law of e exponent function. The smaller the T2 geometric mean value and the worse the pore structure of the core, the greater the corresponding n value will be. In contrast, when the pore structure of the sample is relatively good, that is, when T2 geometric mean value is bigger than 10 ms, in other words, macropores take majority, the corresponding n value is relatively stable, ranging from 1.7 to 1.9. The n value function is expressed as follows:

Fig. 12.
Relationship between the ratio of large pores to small pores and n value of tight sandstone samples from Member Chang 7.
where, A0, A1 and t1 are fitting coefficients, which need to be determined by a large number of rock electric experimental data of the target layer.
5. Application examples
Using the pore structure information extracted from NMR logging combined with the functional relationship between n value and the volume ratio of large pores to small pores derived from NMR, the saturation of Member Chang 7 reservoir in Well X of Ordos Basin was evaluated quantitatively (Fig. 13). The m and n values continuously change throughout the evaluated section, and the result is the red curve Sw in the figure. The original water saturation was calculated by using the Archie formula with fixed m and n values, shown as the black curve SwA in the figure. The calculation results of the two methods were compared with the water saturation derived from the sealed coring analysis of the well. It can be seen from the figure that the saturation values calculated by the two methods are basically the same for layer 70 with good physical property and pore structure (with a permeability greater than 0.1×10⁻³ μm2). But when the reservoir physical property and the pore structure are poor, that is, micro-pores take majority, the saturation calculated by the new model is in good agreement with the analysis result of sealed coring core, while the oil saturation calculated by the original model is lower, for example, layer 62-64 in the figure. The results show that the saturation calculated by the new model is much more accurate than that by the original model, and the calculation results are in line with the response pattern between physical and electrical parameter of tight sandstone. When the reservoir property is good, that is, the pore structure is good, large pores are dominant, and n value is basically stable between 1.7 and 1.9. In contrast, when reservoir physical properties are poor, that is, micro-pores are dominant, n value gradually increases.
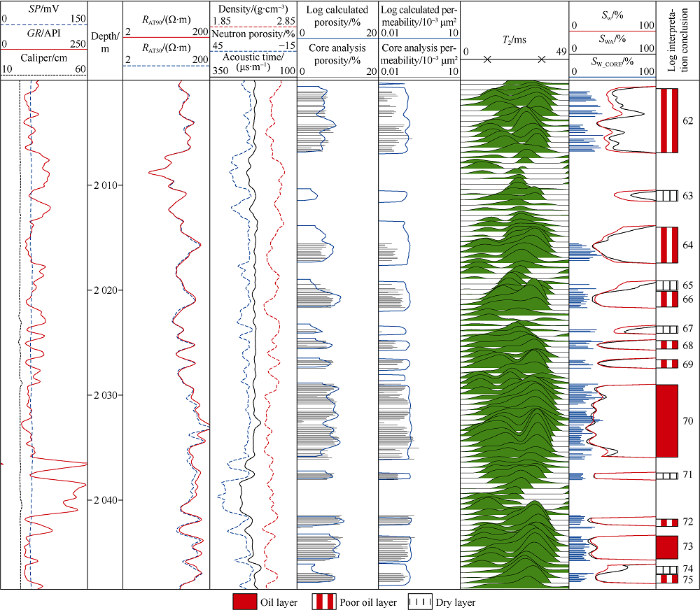
Fig. 13.
Composite logging evaluation of Member Chang 7 reservoir in Well X.
A large number of well data of Member Chang 7 reservoir in the research area was evaluated by applying the results of the electric response law and the evaluation results are basically consistent with the saturation from analysis of sealed coring core. For wells without coring data, the evaluation results are basically consistent with the oil testing results.
6. Conclusions
The joint high-speed centrifugal displacement and nuclear magnetic resonance T2 spectrum test method can displace tight sandstone cores with a permeability of less than 0.1×10⁻³ μm2, and can provide pore fluid distribution state under different water saturations. Therefore, this method provides a more reliable experimental means for research on rock elec-trical property of tight sandstone.
By conducting high resolution scanning experiments, such as CT, MAPS and Qemscan, the contradiction between the sample size and the CT scanning resolution can be solved effectively. By combining multi-source information, the fine three-dimensional digital core of multi-mineral components was constructed, and the contribution of micropores was fully considered. Based on this, the finite element numerical simulation method was adopted to obtain the rock electrical response of tight sandstone under medium - low water saturation which can’t be obtained under laboratory conditions.
Taking Member Chang 7 typical reservoir as the research target, the saturation evaluation technology based on pore structure can obtain more accurate oil saturation, and thus reserves calculation precision of tight sandstone reservoir can be effectively improved, meanwhile, the changing rule of rock electrical parameters has good guidance for evaluation of the rest of tight sandstone reservoirs.
Nomenclature
A0and A1—core fitting coefficient, dimensionless;
E—potential energy of electric field of three-dimensional digital core, J;
Fs—pore shape factor, dimensionless;
GR—natural gamma, API;
m—cementation index, dimensionless;
n—saturation index, dimensionless;
rc—pore radius, m;
S—pore surface area, m2;
SP—spontaneous potential logging, mV;
Sw, SwA and Sw_CORE—water saturation calculated by the model in this paper, water saturation calculated by Archie model, and water saturation from analysis of sealed coring core,%;
t1—core fitting coefficient, dimensionless;
T2—NMR T2 spectrum, ms;
V—total pore volume, m3;
VCH—chlorite volume content, %;
VFC—volume content of potassium feldspar and calcite, %;
VIK—volume content of illite and kaolinite, %;
VP—residual intergranular pore volume identified by CT, %;
VQA—volume content of quartz and feldspar, %;
α—ratio of large pores to small pores (bounded by 10 millisecond of NMR T2 spectrum), dimensionless;
uj—node voltage, V;
ρ2—transverse surface relaxation of rock, μm/ms;
ϕ—effective rock porosity, %;
ϕb—porosity occupied by micropores, %;
ϕf—porosity occupied by large pores, %;
ϕt—total rock porosity, %.
Reference
Development characteristics and orientation of tight oil and gas in China
Progress in China’s tight oil exploration and challenges
Characteristics of tight oil in Triassic Yanchang Formation, Ordos Basin
Well logging evaluation of Triassic Chang 7 Member tight reservoirs, Yanchang Formation, Ordos Basin, NW China
Characters and causes of tight sandstones of Yanchang Formation in southern Ordos Basin, China
The influence of low permeable sandstone pore structure on rock electrical parameters and its applications
Archie’s formula: Historical background and earlier debates
A tight sandstone trapezoidal pore oil saturation model
Dual-porosity saturation model of low-porosity and low- permeability clastic reservoirs
Theoretical simulation of the resistivity and pore structure of hydrocarbon bearing rocks
Microporosity in reservoir rocksits measurement and influence on electrical resistivity
Impacts of microporosity, rough pore surface and conductive minerals on saturation calculations form electric measurements: An extended Archie's Law
The study of capillary and electrical properties of porous rock samples at reservoir conditions
On Archie’s electrical parameters of sandstone reservoir with complicated pore structures
Microscopic characteristics of chang7 tight sandstone reservoir in Ordos Basin
Heterogeneity and lower oily limits for tight sandstones: A case study on Chang-7 oil layers of the Yanchang Formation, Ordos Basin
The status and development of finite element method
Nuclear magnetic resonance T2 spectrum multifractal characteristics and pore structure evaluation
