


Introduction
The purpose of seismic inversion is to deduce rock physical parameters such as wave impedance and velocity from seismic data, so as to do reservoir prediction and fluid detection, and provide basis for exploration and development of oil and gas fields. Traditional poststack inversion is convenient and fast, but as poststack seismic data loses the variation of amplitude with offset because of multiple stacking, the inversion results have some limitations. Compared with poststack inversion, prestack inversion has the advantages of more infor-mation and fidelity[1]. Generalized prestack inversion includes AVO attribute analysis, elastic impedance inversion and prestack simultaneous inversion, and these methods all use prestack seismic data and based on the Zoeppritz equation approximation to obtain a variety of parameters to characterize underground lithology and fluid. AVO attribute analysis, also known as AVO inversion, is a mathematical transformation of prestack seismic data based on the approximation proposed by Shuey[2] in 1985 to obtain AVO attribute parameters. But this method lacks logging data constraints, and the result values of each attribute are between [-1,1], which have no physical significance related to rock elastic parameters, so this method can only be regarded as a qualitative reservoir identification method. Elastic impedance inversion originates from a concept of elastic wave impedance related to incident angle proposed by Connolly [3] in 1999, which uses poststack inversion algorithm to stacked seismic data volume of different angles, to obtain elastic impedance volumes in different angles. A serious problem of this method is that it can't establish the relationship between seismic data from different angles, therefore we can't interpret the differences of inversion profiles from different angles. To solve this problem, Hampson and Russell et al.(2005)[4] proposed a prestack simultaneous inversion method based on Fatti (1994)[5] approximation, which can directly invert P-wave impedance, S-wave impedance and density. This method is an innovation of prestack inversion technology, it strengthens the constraints between different angles, improves inversion stability, and can obtain the elastic parameters of underground rock with physical significance[6,7]. At present, prestack simultaneous inversion has been used successfully in identifying clastic reservoirs in many cases, but its application results in carbonate reservoirs differ somewhat. The first reason is that the pore types in carbonate rock are mainly moldic pore and vugular pore, so the fluid in carbonate has far less effect on the wave velocity than that in clastic rock, and the characteristics of "dark spots" or "bright spots" on seismic profiles are not obvious and difficult to identify[8,9]. The second reason is that due to cementation and dissolution, carbonate rock layers often have rich fractures, strong heterogeneity and rapid change of physical properties[10,11], which results in complex prestack inversion information and many interpretation schemes. Consequently, it is more difficult to identify carbonate reservoirs and gas reservoirs by prestack simultaneous inversion. Permain Changxing Formation of Damaoping area in Sichuan Basin has atoll reefs and point reefs with strong heterogeneity, big difference in thickness and gas-bearing degree. Seismic exploration shows that there are still many reef anomalies in the study area. But the main borehole and lateral 1 of Well Yun’an X11 didn’t encounter reef in the Changxing Formation, the lateral 2 encountered the reef, but has low gas yield. Well Yun’an X9 encountered the reef, but was tested only low gas and water production. All these demonstrate the complexity of reef exploration and multi-solutions of seismic identification in the study area. There are three main reasons for this: firstly, the study area is located in the south section of the east side of Kaijiang-Liangping Trough, where the Changxing Formation thickness and reef development degree are lower than those of the west side of the trough; secondly, the study area is located in the synclinal structure at present where the target formation is larger in buried depth, so the seismic data isn’t so good in quality; thirdly, the seismic responses of the reef gas and water layers in Changxing Formation are complex, and there are many different understandings on them[12]. Therefore, establishing accurate seismic-geological response pattern of reef reservoirs with different physical properties and gas-bearing conditions, identifying reef reservoirs and predicting gas reservoir distribution in Changxing Formation, and improving the success rate of drilling reef gas reservoir are the technical problems facing the study area, and also the focus of this study.
1. Lithologic, electric and seismic reflection characteristics of the reef
The development of Changxing Formation reef reservoir in the study area is controlled by sedimentary facies[13,14]. The reefs in platform margin facies come in clusters and belts, and are large in scale, while the reefs in platform facies are small and scattered[15]. The study area had trough facies, slope facies, platform margin facies and platform facies during the depositional stage of Changxing Formation, and the stratum thickness varies greatly[16]. The reef where Well Yun’an 6 (Fig. 1) is located is most developed, the Changxing Formation is 299 m thick, and the reservoirs are 66.47 m cumulatively. The Changxing Formation has two phases reefs stacking over each other vertically, which have some differences in lithology and electric property. In the late depositional stage of Changxing Formation, the study area was platform margin facies, and the reservoirs developed were reef dolomite and dolomitic limestone, with high dolomitization degree and well-developed dissolution pores and vugs, and acanthosis, cockroaches and other organisms. The reservoir of this stage has natural gamma value of less than 15 API and obvious positive difference between deep-shallow dual lateral logging curves. The non-reservoir developed in this stage is largely limestone, which has basically coincided deep-shallow dual lateral logging curves. In the early depositional stage of Changxing Formation, only a thin bio-bank developed at the top, which has much higher natural gamma ray and electric curve values than the late stage reef of Changxing Formation, and belongs to platform margin facies. The middle and lower parts of the early Changxing Formation belong to gentle slope facies, with no reefs and shoals developed. On seismic profile (Fig. 2), where the early biobank reservoir occurs, the Changxing Formation is obviously thicker. For example, the Changxing Formation in Well Yun’an 6, Yun’an X7 and Yun’an 012_1_Z encountering biobank reservoir is obviously thicker than that in Well Yun’an x11_2ce without biobank reservoir. The late Changxing Formation reef beach is generally better developed and thicker than the early one, and has obvious hilly reflection shape. The flanks of the reef have overlap, and the interior of the reef is chaotic blank reflection. The adjacent trough facies appears as continuous parallel strong reflection with stable thickness variation, and platform margin facies strata of the Triassic system Changxing Formation is obviously thicker than that of adjacent trough facies[17]. A set of thick mudstone at the bottom of Feixianguan Formation overlying Changxing Formation can act as a good caprock of reef gas reservoir at the top of Changxing Formation[18].
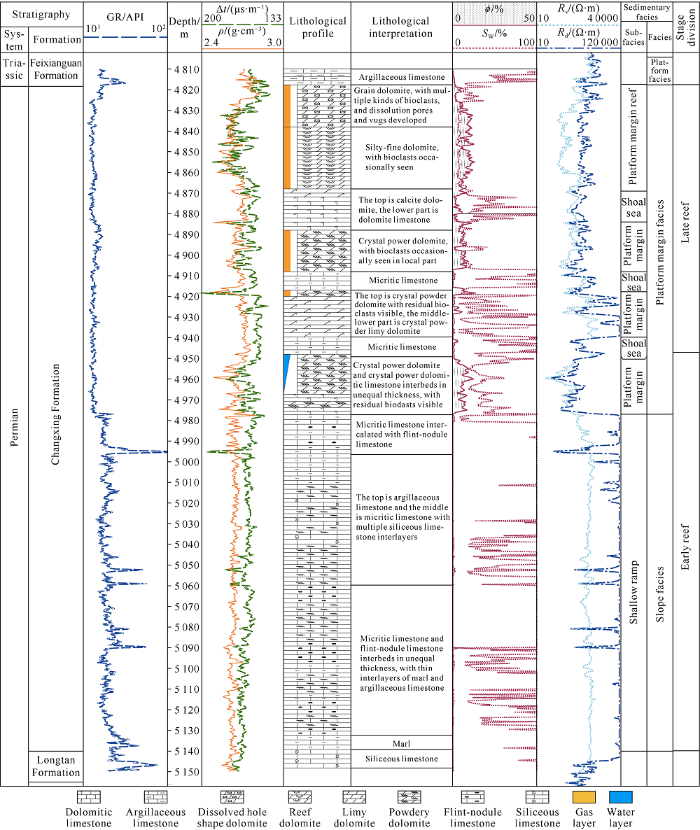
Fig. 1.
Composite stratigraphic column of Well Yun’an 6.

Fig. 2.
Seismic correlation profile of connected wells (flatten at the bottom of Changxing Formation).
There is little difference between porous dolomite reservoir and surrounding rock (limestone) in P-wave impedance (Fig. 3). Therefore, it is difficult to identify lithology and fluid properties by P-wave impedance. When S-wave information is introduced (Fig. 3), dolomite and limestone can be distinguished at the Vp/Vs ratio of 1.90, and gas layer and water layer can be distinguished at the Vp/Vs ratio of 1.83. This shows the importance of compressional wave and also the feasibility of identifying reef gas layer with prestack inversion.
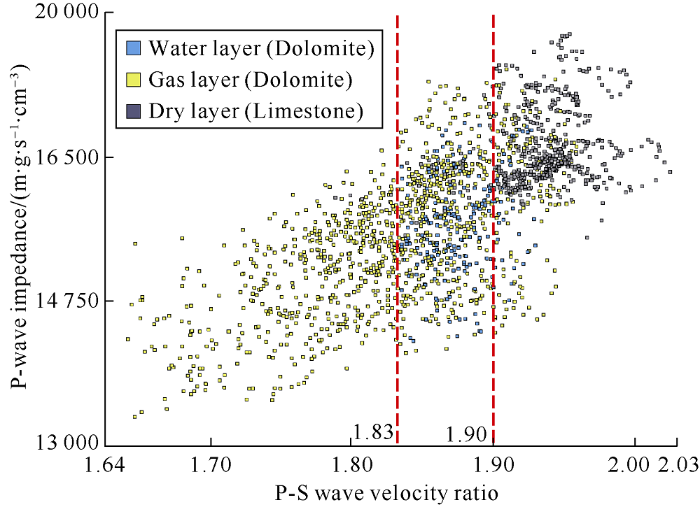
Fig. 3.
Cross plot of P-S wave velocity ratio and P wave impedance.
2. Estimation of S-wave velocity
When P-wave passes through gas-bearing reservoir, its velocity decreases obviously while S-wave passes through gas-bearing reservoir, its velocity doesn’t change much. Therefore, many sensitive factors for reservoir and fluid identification can be obtained by constructing parameters related to P-wave and S-wave[19,20]. S-wave is also very important basic data in petrophysical analysis and AVO forward modeling[21]. But it is difficult to obtain high quality S-wave curves due to the high requirement and cost of S-wave measurement. In order to solve this problem, in this study, we effectively predicted the S-wave velocity in wells of the study area through cross plot analysis of rock physics experiment results and log curve.
We tested porosity and P-and S-wave velocities of 19 core samples from Changxing Formation in 5 wells (Fig. 4a), it can be seen that the P-and S-wave velocities of Changxing Formation core samples are generally in a straight line, and the velocities of P and S waves in limestone are higher than those in dolomite in general (Fig. 4b).
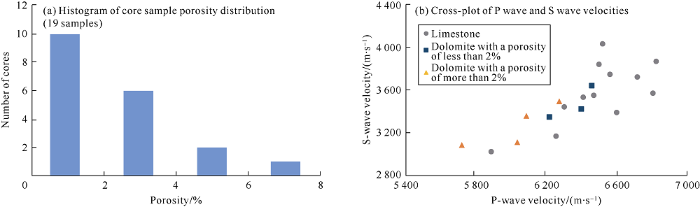
Fig. 4.
Distribution of core porosity and cross plot of P and S wave velocities.
In order to clarify the quantitative relationship between P-wave and S-wave velocities of Changxing Formation in the study area and provide a specific empirical formula for S-wave estimation, we counted the logging porosity distribution of three wells with S-wave data in Changxing Formation (Fig. 5a), in which limestone with the porosity of less than 2% accounts for 34.6%; reef and beach reservoirs are mainly between 2% and 12% in porosity, only a small part of reservoirs have porosity greater than 12%. On this basis, we made cross-plot of P-wave, S-wave velocity and porosity (Fig. 5b). It can be seen from this figure that sampling points with different porosities have distinct zonation on the cross-plot. And we chose Krief model[22] suitable for medium and low porous formations. The relationship between S-wave velocity (${{v}_{\text{s}}}$) and P-wave velocity (${{v}_{\text{p}}}$) of this model is as follows:
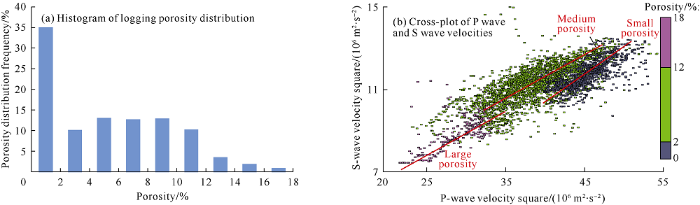
Fig. 5.
Cross-plot of P- and S-wave velocities and logging porosity.
Table 1 shows the formulas for calculating S-wave velocity in different porosity intervals of the study area. In order to verify the empirical formulas, we used single porosity formula and comprehensive porosity formula to calculate the S-wave velocity of Changxing Formation in Well Yun’an X7 (Fig. 6). Compared with the S-wave calculated with single porosity formula, the S-wave calculated by the comprehensive porosity formula is more similar to the measured S-wave velocity, and the algorithm is simple and easy to implement. It shows that the method of estimating the S-wave velocity based on the porosity interval is feasible in the study area.
Table 1 Formulas for calculating S-waves based on porosity.
| Porosity interval | S-wave calculating formula |
|---|---|
| Low porosity 0< Porosity ≤2% | ${{v}_{\text{s}}}^{2}=0.261\ {{v}_{\text{p}}}^{2}+481.57$ |
| Medium porosity 2%< Porosity ≤12% | ${{v}_{\text{s}}}^{2}={{0.241}_{{}}}7\ {{v}_{\text{p}}}^{2}+{{2}_{{}}}311.43$ |
| High porosity Porosity >12% | ${{v}_{\text{s}}}^{2}={{0.245}_{{}}}6\ {{v}_{\text{p}}}^{2}+{{1}^{{}}}603.3$ |

Fig. 6.
Comparison of S-wave fitting results of Well Yun’an X7.
3. Analysis of the reef reservoir and fluid sensitive parameters
S-wave information has great significance in identifying reservoirs and fluids. Rock elastic parameters can be extracted from S-wave information, selected rock elastic parameters can be used in prestack inversion to improve the accuracy of pre-diction results[23,24]. Among them, fluid factor ($\lambda \rho $) is an important parameter reflecting the fluid property in reservoir[25], which is the product of rock bulk modulus ($\lambda $) and rock density ($\rho $), it can be written as a function of P-wave impedance (${{I}_{\text{p}}}$) and S-wave impedance (${{I}_{\text{s}}}$):
This parameter reflects the compressibility of rock and is sensitive to fluid. In this study, we conducted cross-plot analysis of petrophysical parameters of 13 wells in the study area. The results show that (Fig. 7): the parameters sensitive to reservoir is P-S wave velocity ratio, P-S wave velocity ratio of dolomite is 1.65-1.94, and P-S wave velocity ratio of limestone is 1.9-1.98. Fluid factor is the parameter most sensitive to gas and water. The fluid factor of gas layer is 60-120, and that of water layer is 110-140. We removed the data points of low porosity ($\phi <4%$) and low gas saturation (${{S}_{\text{w}}}<50%$) and drew again the cross-plot of P-S wave velocity ratio and fluid factor (Fig. 8). In this figure, the overlapping degree of sampling points of gas and water layers on the vertical axis obviously reduces, which indicates that fluid factor ($\lambda \rho $) is a sensitive parameter for identifying gas-rich dolomite.
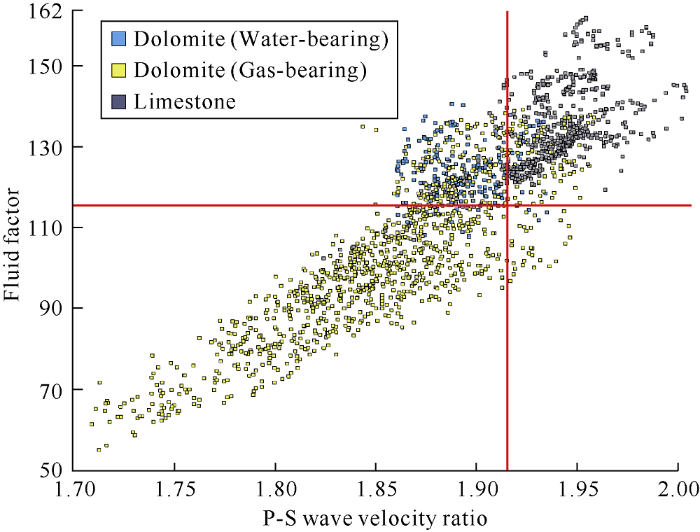
Fig. 7.
Cross-plot of P and S wave velocity ratio and fluid factor λρ of Changxing Formation.
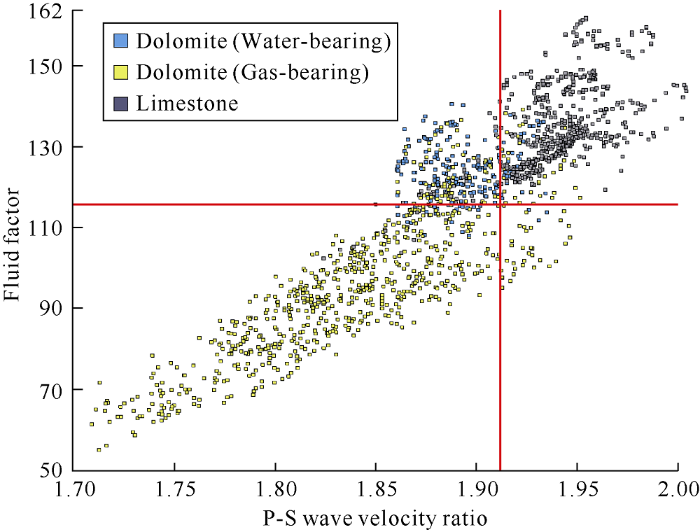
Fig. 8.
Cross-plot of gas-rich dolomite, water-bearing dolomite and limestone.
4. AVO forward analysis
4.1. AVO features of reef gas layer
AVO forward analysis needs to construct a geological model, and calculate the reflection coefficients at different incident angles by using Zoeppritz equation or other approximate formula, finally obtain common reflection gather and analyze the variation trend of amplitude with incident angle[26]. In 1989, Rutherford and Williams classified AVO types of gas-bearing sandstone into three categories according to the difference of wave impedance between reservoir and overlying surrounding rock[27]. In 1997, Castagna and Swan correlated gradient and intercept attributes with petrophysics and supplemented types of AVO[28]. They proposed the type Ⅳ AVO, and considered that the Class III and IV AVO reservoirs had wave impedance lower than the overlying caprock, that is, both Class III and IV AVO have negative intercept, but Class III AVO show amplitude increase with increase of incident angle and negative gradient, while Class IV AVO reservoirs show decrease of amplitude with the increase of incident angle and positive gradient. The authors counted the ranges of parameters of reef reservoir and surrounding rock in Changxing Formation, and set P-wave velocity of surrounding rock at 6641 m/s, S-wave velocity at 3477 m/s and density at 2.72 g/cm3. We calculated the maximum incident angle was 30 degrees according to the burial depth and average velocity of Changxing Formation[29]. Then the following conclusions are obtained after we obtained AVO trend recognition chart of reef reservoirs in the study area by forward modeling (Table 2): (1) The top boundary of reef gas reservoirs in the study area have two AVO trends: type III and type IV, and the amplitude varies obviously with incident angle and the negative intercept is big. (2) The top boundaries of water layers in the study area also show the characteristics of type IV AVO, but the AVO characteristics of the water layer are not as obvious as those of the gas layer, namely, the negative intercept is not obvious, and the positive gradient is not obvious. (3) The two types of AVO anomalies in reef gas reservoirs are mainly related to the size of reservoir porosity.
Table 2 AVO types of Changxing Formation reef reservoirs in the study area and yield of typical wells.
| AVO Type | Property of fluid in the reservoir | Reservoir parameter | AVO forward gather of reservoir top boundary and trend analysis | Typical wells and production | ||
|---|---|---|---|---|---|---|
| Well name | Gas production (104m3•d-1) | Water production (m3•d-1) | ||||
| Type Ⅲ | Gas layer | $\rho ={{2.65}_{{}}} \text{g}/\text{c}{{\text{m}}^{3}} $ $ {{v}_{\text{p}}}=6\ {{044}_{{}}} \text{m}/\text{s} $ $ {{v}_{\text{s}}}=3\ {{400}_{{}}} \text{m}/\text{s} $ $ \phi =6\% $ $ {{S}_{\text{w}}}=5\% $ | 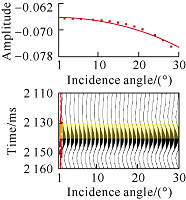 | Yun’anX8 | 85.49 | - |
| Type Ⅳ | Gas layer | $\rho ={{2.63}_{{}}} \text{g}/\text{c}{{\text{m}}^{3}} $ $ {{v}_{\text{p}}}={{6}_{{}}}{{019}_{{}}} \text{m}/\text{s} $ $ {{v}_{\text{s}}}={{3}_{{}}}{{266}_{{}}} \text{m}/\text{s} $ $ \phi =10\% $ $ {{S}_{\text{w}}}=5\% $ | 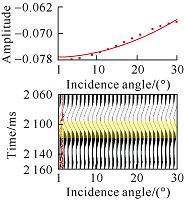 | Yun’an6 | 82 | - |
| Yun’anX7 | 127.13 | - | ||||
| Yun’an012_12 | 43.1 | - | ||||
| Gas-bearing water layer | $\rho ={{2.71}_{{}}} \text{g}/\text{c}{{\text{m}}^{3}} $ $ {{v}_{\text{p}}}={{6}_{{}}}{{178}_{{}}} \text{m}/\text{s} $ $ {{v}_{\text{s}}}={{3}^{{}}}321_{{}}^{{}} \text{m}/\text{s} $ $ \phi =5\% $ $ {{S}_{\text{w}}}=70\% $ | 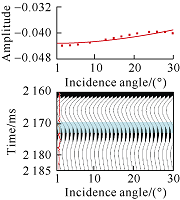 | Yun’anX9 | 2.45 | 10.08 | |
4.2. Factors affecting AVO types of reef gas layer
Since the development of reefs in the study area is influenced by sedimentary microfacies, palaeogeomorphology and diagenesis, the reservoir development degree is different. It is inferred that the reasons for the two AVO trends of gas reservoirs in the study area may be related to gas saturation and reservoir porosity[30]. Therefore, we replaced the fluid in reservoir and got AVO responses at variable gas saturation and variable porosity under the condition that there was only one variable. The results show that: (1) When the reservoir porosity remains unchanged at 10%, and the gas saturation increases from 5% to 95% (Fig. 9a), AVO type will not change, but the amplitude variation trend of gas layer with incident angle (Sw = 5%) is more obvious than that of water layer (Sw = 95%). (2) When the water saturation of reservoir remains unchanged at 5%, and the porosity increases from 2% to 18% (Fig. 9b), the AVO type of gas reservoir transits from Class III to Class IV, that is to say, the porosity of reef gas reservoir with type IV AVO anomaly is higher than that of type III reef gas reservoir, this conclusion is applicable to the case that the gas-bearing carbonate reservoir has lower wave velocity and density than the surrounding rock. Therefore, for the study area, both of class III and IV AVO may be response of gas reservoir; while the gas-bearing water layer with the same type IV AVO characteristics has less obvious amplitude variation trend with offset than the gas layer with type IV AVO (Fig. 9a).
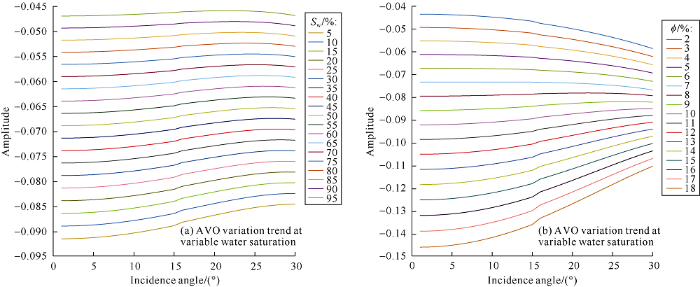
Fig. 9.
Characteristic chart of AVO forward modeling curve of reef reservoir.
5. Identification of gas and water in reef reservoirs of the study area and prediction of favorable area
The maximum incident angle of the original angle gather in the study area is 30°, which we divided into stack data volumes of three angle intervals according to the burial depth and signal-to-noise ratio of target layer, that is near gather stacking (0-12°), middle gather stacking (10°-20°) and far gather stacking (18°-30°). Then we separately extracted wavelet from the angle stacking gathers to eliminate the influence of frequency and phase of the wavelet on the offset. In addition, we interpolated the P-wave velocity, S-wave velocity and density curves in borehole by inverse distance weighted algorithm as initial model and constraint conditions of inversion to supplement the low-frequency information of inversion results. Next, we used Fatti approximation and convolution model to solve simultaneous equations of the different angle stacking gathers to get P-wave impedance, S-wave impedance and density data volumes. The inversion results are faithful to the seismic response[31] and high in reliability, but limited by seismic resolution, has not so high vertical resolution.
At present, 12 wells have been drilled in the study area, among the10 wells encountered reef, 4 wells have high daily gas production of over 80×104 m3, 3 wells have medium daily gas production of over 50×104 m3, and 3 wells have low gas production. These wells are all located in platform margin facies suitable for reef growth, and the reefs are distributed in strips along the boundary of Kaijiang-Liangping Trough. In this study, two methods, prestack simultaneous inversion and AVO analysis were used to identify and predict reef reservoirs and gas layers of Changxing Formation in the study area. The above cross-plot analysis of petrophysical parameters shows that ratio of P wave velocity to S wave velocity and fluid factor are sensitive parameters for identifying reef reservoir and gas-rich dolomite respectively. Changxing Formation reservoirs in four typical wells with different physical properties and gas-bearing properties were selected to test of different gas layer identification methods.
5.1. Prediction of the reef reservoirs in Damaoping area
Fig. 10 is a cross-well profile of prestack P-S wave velocity ratio inversion (the profile location is shown in Fig. 15a), in which the red area represents reef reservoir with good physical properties, yellow area represents reservoir with poor physical properties, and blue area represents dense limestone. The sites where these four wells are all show low P-S wave velocity ratios, and P-S wave velocity ratios of Well Yun’an 6 and Well Yun’an X7 are even lower than the other two wells, which means the reservoirs in these two high-yield gas wells are better in physical properties, and the inversion interpretation results are basically consistent with the actual drilling results (Table 3). Inter-reef and trough facies show high P-S wave velocity ratio, i.e. reef reservoir isn’t developed, which is consistent with the geological understanding that marl and limestone are more developed in the sea basin[32].
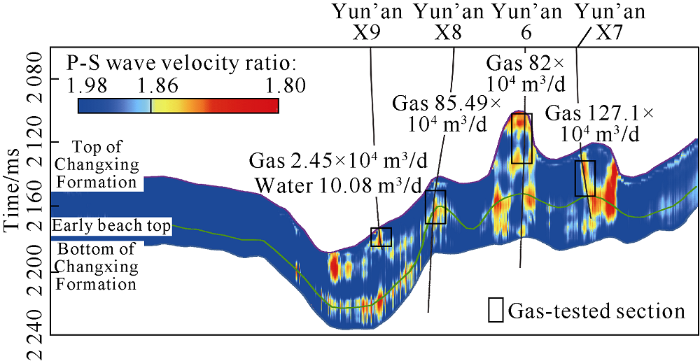
Fig. 10.
Prestack P-S wave velocity ratio inversion profile through wells Yun’an 6, Yun’an X7 and Yun’an X8.
Table 3 AVO types and gas-testing data of Changxing Formation reef reservoirs in typical wells of the study area.
| Well name | AVO type | Poro- sity/% | Gas satura- tion/% | Daily gas production/ (104 m3•d-1) | Daily water production/ (m3•d-1) |
|---|---|---|---|---|---|
| Yun’an 6 | Type Ⅳ | 9 | 92 | 82 | - |
| Yun’an X7 | Type Ⅳ | 11 | 90 | 127.1 | - |
| Yun’an X8 | Type Ⅲ | 6 | 90 | 85.49 | - |
| Yun’an X9 | Type Ⅳ | 5 | 10 | 2.45 | 10.08 |
5.2. Prediction of the gas and water in reef reservoirs of Damaoping area
Fig. 11 is a prestack fluid factor inversion cross-well profile (the profile location is shown in Fig. 15a). The profile is similar in characteristics with the prestack P-S wave velocity ratio inversion profile, in which the change of red to yellow indicates the decrease of gas content. The fluid factor at Well Yun’an X9 shows slightly low anomaly, which is consistent with low gas production, high water saturation and water production of this well. The three wells Yun’an 6, X7, and X8 tested high gas production show obvious red low-value anomalies, with fluid factors of less than 100 in general. After eliminating the influence of acidizing fracturing, test scale, perforation size and other factors on the production of the wells in the development process, it can be seen that the abnormal degree of fluid factor from prestack simultaneous inversion is basically consistent with the daily production of each well (Table 3).
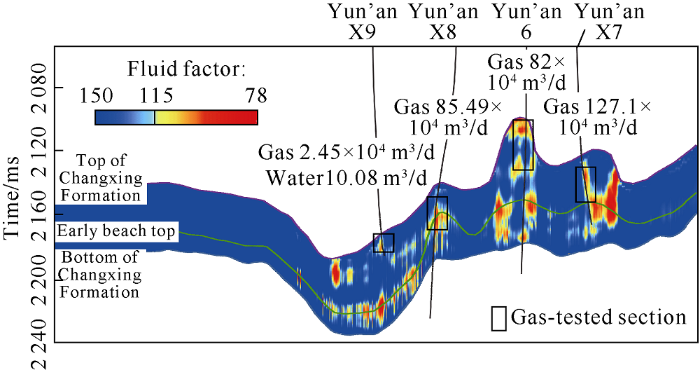
Fig. 11.
Prestack fluid factor inversion profile through wells Yun’an 6, Yun’an X7 and Yun’an X8.
In order to compare the effects of different methods in identifying reef reservoirs and gas-bearing property, we carried out poststack impedance inversion (Fig. 12) and high frequency attenuation attribute extraction (Fig. 13). In the poststack wave impedance inversion profile, gas-tested sections of Well Yun’an X7 and Well Yun’an X8 have no obvious red low value anomalies, while Yun’an X9 shows obvious characteristic of low wave impedance, and there are low red values in the trough, interfering the identification of reef reservoir. For the high frequency attenuation attribute, the high frequency component is absorbed and attenuated when seismic wave passes through the reservoir containing fluid, and the frequency attenuation in gas-bearing reservoir is more obvious than that in water-bearing reservoir. Fig. 13 shows the high frequency attenuates obviously in Well Yun’an 6, indicating that the reservoir in this well is gas-bearing, but the high frequency component doesn’t attenuate significantly at the gas-tested section of Well Yun’an X7 and Yun’an X8, which is not consistent with the actual drilling results. Therefore, these two methods have some defects in identifying reef gas reservoir in the study area.
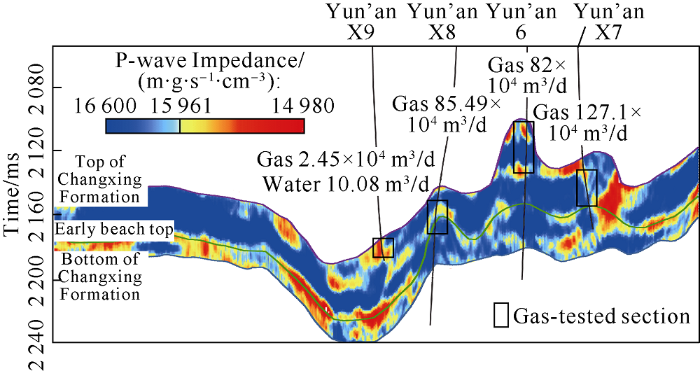
Fig. 12.
Poststack impedance inversion profile through wells Yun’an 6, Yun’an X7 and Yun’an X8.
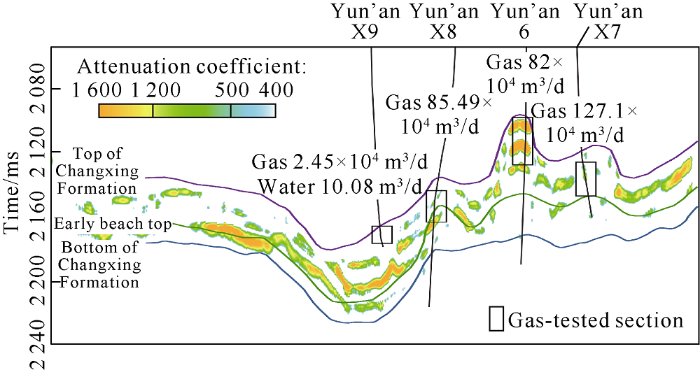
Fig. 13.
High frequency attenuation attribute profile through wells Yun’an 6, Yun’an X7 and Yun’an X8.
The comparison of the above methods shows that prestack simultaneous inversion works best in identifying gas reservoirs in the study area (Table 4), but the process is very complex, and errors in any step, such as well seismic fine calibration, angle wavelet extraction, low-frequency model establishment and constraint equation coefficient determination, will affect the inversion results. In contrast, direct analysis of AVO trend of corner gathers only uses seismic data without intermediate process, so this method has good fidelity.
Table 4 Comparison of coincidence rate of gas-bearing property of Changxing Formation reef reservoir predicted by different parameters.
| Well name | Fluid property of reef reservoir | Detection effect | ||||
|---|---|---|---|---|---|---|
| Prestack P-S wave velocity ratio | Prestack fluid factor | Poststack P-wave impedance | High frequency attenuation | Angle gather | ||
| Yun’an 12_12 | Gas layer | Coincident | Coincident | Coincident | Coincident | Not coincident |
| Yun’an 6 | Gas layer | Coincident | Coincident | Coincident | Coincident | Coincident |
| Yun’an X7 | Gas layer | Coincident | Coincident | Not coincident | Coincident | Coincident |
| Yun’an X8 | Gas layer | Coincident | Coincident | Coincident | Not coincident | Coincident |
| Yun’an X9 | Gas-bearing water layer | Coincident | Coincident | Coincident | Not coincident | Coincident |
| Yun’an_X11_ce | Undrilled reef | Not coincident | Not coincident | Coincident | Coincident | Coincident |
| Yun’an_X11_2ce | Gas layer | Coincident | Coincident | Not coincident | Coincident | Not coincident |
| Yun’an_X11 | Undrilled reef | Coincident | Coincident | Coincident | Coincident | Coincident |
| Yun’an 012 | Gas layer | Coincident | Coincident | Coincident | Not coincident | Coincident |
| Yun’an 012_1_C | Gas layer | Coincident | Coincident | Not coincident | Coincident | Not coincident |
| Yun’an 012_1_Z | Gas-bearing layer | Coincident | Coincident | Coincident | Coincident | Coincident |
| Yun’an 012_2 | Gas layer | Coincident | Coincident | Not coincident | Coincident | Coincident |
| Coincident rate | 91.7% | 91.7% | 66.7% | 75% | 75% | |
Fig. 14 shows angle gathers of reservoirs in the above four wells. The top of gas reservoirs in Well Yun’an 6 and X7 show type IV AVO (Fig.14a and 14b), which means high porosity and gas saturation; the top of gas reservoir in Well Yun’an X8 shows type IV AVO (Fig. 14c), which means low porosity; the top of gas reservoir in Well Yun’an X9 also shows type IV AVO (Fig. 14d), but the AVO variation trend is not as obvious as that in Well Yun’an 6 and X7 (Fig. 14). The AVO trends of angle gathers of these four wells are consistent with the above forward analysis conclusions (Table 3), which shows that the AVO characteristic reflected by angle gather has certain significance for gas-water identification in the study area, and can supplement the conclusion from prestack simultaneous inversion results.
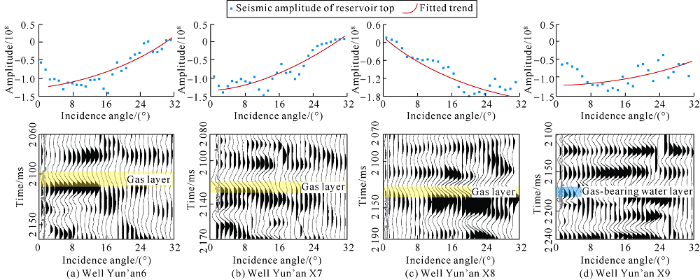
Fig. 14.
Angle gathers and AVO trends of typical wells.
Table 4 shows the comparison of reef reservoir fluid property identified by several methods and the actual drilling results. Among them, poststack impedance inversion and poststack high frequency attenuation attribute extraction use seismic data lack amplitude information in offset domain, so their results have low coincidence rate with actual drilling results. The method of AVO analysis by angle gather directly use amplitude information in offset domain, so gas layer identification results by this method have higher coincidence rate than those of poststack methods. But limited by AVO theory, this method doesn’t work well in identifying thin reservoir. Moreover, this method needs high quality seismic data, poor signal-to-noise ratio or low-resolution seismic data will affect the accuracy of AVO analysis. In contrast, prestack simultaneous inversion integrates AVO attribute analysis into the inversion process, and uses the constraints of logging data to reduce the multi-solution of inversion results, so a variety of parameters characterizing underground lithology and fluid properties obtained by this method have the highest coincidence rate with actual drilling results, which indicates that prestack simultaneous inversion is of great significance for the identification of reef reservoirs and gas-water in the study area. The research results of prestack simultaneous inversion can be used as a direct basis for predicting favorable gas-bearing areas in reef.
5.3. Comprehensive prediction of favorable gas layer in Damaoping area
We carried out prestack simultaneous inversion of 3D seismic data in Damaoping area and obtained fluid factor λρ data volume, and extracted average amplitude of the fluid factor of the section 15 ms down from the top of Changxing Formation (Fig. 15a). In the Figure, except the unreliable seismic data at the 3D boundary, the gas reservoir distribution at the top of Changxing Formation in the study area has obvious regularity. Combined with the structure map of Changxing Formation top boundary, sedimentary facies belt distribution of Changxing Formation and the scope of reef traps, it is concluded that (Fig. 15b) reef traps are mainly distributed in the platform margin facies area with relatively gentle structure, and the favorable gas- bearing area detected is basically consistent with development area of reef traps. Favorable gas-bearing area detected in the north of the work area is in good agreement with the scope of reef gas reservoirs that have been discovered, and three new favorable gas-bearing areas A, B and C have been found in the central and eastern part of the work area. The favorable area A is located in the main part of newly discovered reef trap in the middle of the work area and is close to the northern atoll gas reservoir in the study area, where low-value anomalies of P-S wave velocity ratio and fluid factor are obvious, and the angle gather crossing the top of main Changxing Formation reef shows obvious type IV AVO (Fig. 16). All these show that favorable area A has rich reef reservoir and obvious gas-rich characteristic. The favorable gas-bearing area is predicted at 9.33 km2, which can be a target area in the next step exploration and development of Changxing Formation reef gas reservoir. B and C favorable areas are located in the platform facies of the work area, and represent small-scale point reef zones in the study area.

Fig. 15.
Planar map of predicted reef gas reservoir in Changxing Formation.
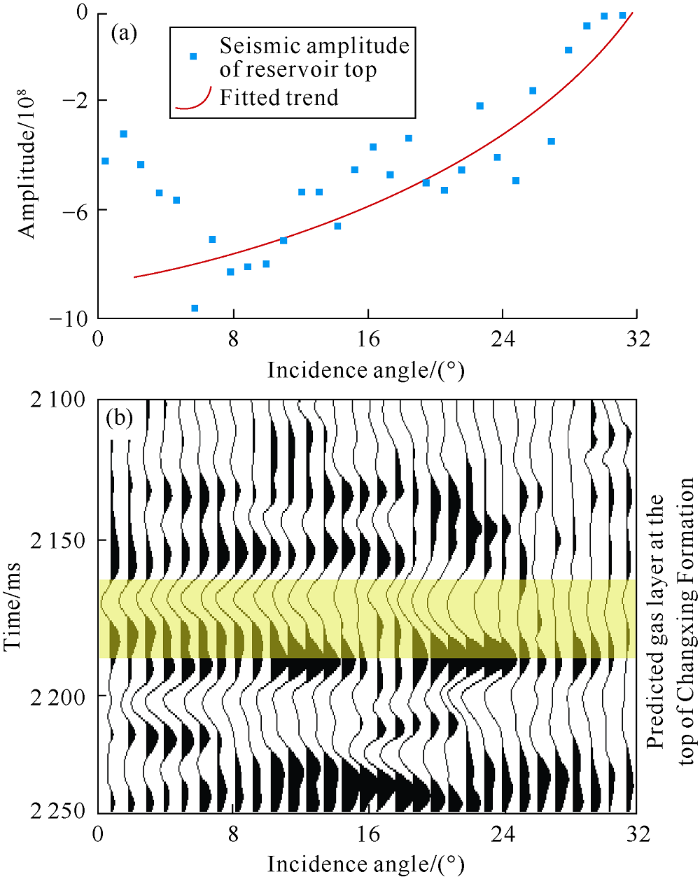
Fig. 16.
AVO abnormality of angle gather through the main part of A area.
6. Conclusions
In this study, taking the reef of Changxing Formation in Damaoping area, Sichuan Basin as an example, we carried out AVO forward analysis, prestack inversion and poststack inversion by seismic data, logging data and geological information, and analyzed the difference of several methods in detecting gas-bearing property of reef reservoir. The result of prestack simultaneous inversion has the highest coincidence rate with discovered reef gas reservoirs. The fluid factor from prestack simultaneous inversion is the most effective parameter to identify gas layer in the study area, which has much better results than poststack inversion and high frequency attenuation attribute, and is important for the identification of Changxing Formation reef reservoir in Sichuan Basin. Carbonate reservoirs in the study area have strong heterogeneity and wide variation of porosity, so when predict S-wave velocity, the distribution range of underground formation porosity should be taken into account fully to obtain different fitting formulas of P and S wave velocity and provide accurate downhole S-wave velocity for prestack inversion. The top of reef gas layers in Changxing Formation have two types of AVO anomaly responses, type Ⅲ and Ⅳ. It is considered that porosity is the main reason for the change of AVO type through fluid replacement, the reef gas reservoir with type IV AVO anomaly has higher porosity than that with type III AVO anomaly. The water-bearing reef layer also shows type IV AVO, but its AVO anomaly degree is obviously weaker than the gas-bearing layer with type IV AVO. Changxing Formation in area A of Damaoping area shows multiple kinds of anomalies, there develop reef reservoir at the top of Changxing Formation, and the trap has gas-rich features, so this area is a favorable target for gas exploration.
Nomenclature
a and b—empirical parameters, determined according to the actual situation of the study area, dimensionless;
F—fluid factor, dimensionless;
GR—natural gamma, API;
Ip—P-wave impedance, m•g/(cm3•s1);
Is—S-wave impedance, m•g/(cm3•s1);
Rd—deep lateral resistivity, Ω•m;
Rs—shallow lateral resistivity, Ω•m;
ρ—density, g/cm3;
${{v}_{\text{p}}}$—P-wave velocity, km/s;
${{v}_{\text{s}}}$—shear wave velocity, km/s;
$\phi $—porosity, %;
${{S}_{\text{w}}}$—water saturation, %;
∆t—interval transit time, μs/m;
λ—bulk modulus.
Reference
Advances in fluid identification based on prestack seismic inversion
A simplification of the zoeppritz equations
Simultaneous inversion of pre-stack seismic data
Using AVO analusis: A 3D case history using geosack technique
Pre-stack simultaneous inversion and application in reservoir prediction in Chunguang oilfield
Application of prestack simultaneous inversion in fluid identification
A discussion on the technical difficulties and countermeasures to carry out seismic exploration in the carbonate rock areas of Sichuan Basin
The seismic response feature and the distribution prediction of oolitic beachs of Feixianguan Formation in the northern Sichuan Basin
A seismic quantitative identification method of slope break belt
Structural patterns of fault broken zones in carbonate rocks and their influences on petroleum accumulation in Tazhong Paleo-uplift, Tarim Basin, NW China
Bioherm development model and reservoir prediction of Changxing Formation in Yuanba Area, Northeastern Sichuan Basin
Geological characteristics and forming conditions of the large platform margin reef-shoal gas province in the Sichuan Basin
Theories and practices of carbonate reservoirs development in China
Reef- forming types and distribution of organic reefs in Changxing Formation of northeastern Sichuan area
Characteristics research of the reef reservoir in Changxing Formation, Damaoping structure of East Sichuan
The seismic response characteristics and distribution of the reefs in the Changxing Formation, northern Sichuan Basin
Logging prediction of organic reef in east of Sichuan
Sensitivity parameters of tight sand gas: A case study of Lower Cretaceous Yingcheng Formation of Yingtai gas field in Songliao Basin, NE China
Methodology and application of oil/water identification based on fluid factor pre-stack seismic inversion
S-wave velocity estimation of biological shoal reservoir on right bank of Amudarya
Shear wave estimation quality control method
Experiment research and application of fluid sensitive attributes based on the pre-stack inversion
Application of prestack simultaneous inversion to the prediction of carbonate reservoirs
Improved AVO fluid detection and lithology discrimination using Lamé petrophysical parameters: “λρ”, “μρ”, & “λ/μ fluid stack”, from P and S inversion
Amplitude-versus- offset variations in gas sands
Principles of AVO crossplotting
Analysis of rock-physical properties through angle-gather sections
Forward modeling of wave equation of bioherm model and analysis of seismic response characteristics
Prestack geostatistical inversion method and its application on the reservoir prediction of Changyuan oilfield
Experiment study of wave velocity and elastic modules variation characteristics for carbonates
