


Introduction
Tight sandstone oil and gas, as an important type of unconventional oil and gas resources, has become a key target for oil and gas exploration and development in recent years[1]. In China, reservoirs with permeability less than 0.1×10⁻³ μm2 under overburden pressure or air permeability less than 1×10⁻³ μm2 are generally defined as tight reservoirs[2]. Since the 1970s, oil and gas exploration and development have been carried out in the Xihu Sag of the Zhedong Depression in the East China Sea Shelf Basin. In recent years, breakthroughs have been made in the exploration of tight sandstone gas reservoirs in the Paleogene Pinghu Formation and Huagang Formation. In addition, new high-yield industrial gas flows have been obtained in the fracture development zones near faults. These findings are guiding exploration work to move from far away from faults to the fracture zones near faults. Fractures are important spaces of tight sandstone reservoirs. As they are channels for oil and gas migration and accumulation[3,4] and can increase production, they are the key factors for the high and stable production of tight sandstone gas[5]. A series of thrust structures are developed in the central reversal tectonic belt of the Xihu Sag. Subjected to strong stress induced by structural compression, cores are often broken and fractures are developed. This may mean the existence of fracture-pore reservoirs. However, the development status, genesis, and stages of the fractures and their matching relationship with the large-scale oil and gas accumulation have not been thoroughly discussed in the study area. Based on the macroscopic observation of core fractures and microscopic description of thin section fractures, this paper uses a variety of analysis and testing methods to determine the development stages of fractures in the Huagang Formation and their matching relationship with the large-scale oil and gas accumulation. The study intends to provide a theoretical basis for drilling design and theoretical and technical support for oil and gas exploration in the Huagang Formation in the Xihu Sag.
1. Geological background
Located in the East China Sea, the Xihu Sag is a secondary tectonic unit of the Zhedong Depression in the East China Sea Shelf Basin. It spreads in the NNE direction, about 400 km long from south to north, about 100 km wide from east to west, and covers about 5.18×10⁴ km2[6]. From west to east, the sag can be divided into a western slope belt, a central reversal tectonic belt, and an eastern fault terrace belt[7,8]. The study area is the Ningbo structure in the middle of the central reversal tectonic belt (Fig. 1a). It is divided into five zones, A to E, according to the oil and gas bearing properties. The target formation is the Huagang Formation, which is divided into upper and lower members with the T21 seismic interface as the boundary. In addition, the target formation is divided into 12 thin layers, of which H1-H5 belongs to the upper member of the Huagang Formation and H6-H12 belongs to the lower member of the Huagang Formation.
Fig. 1.
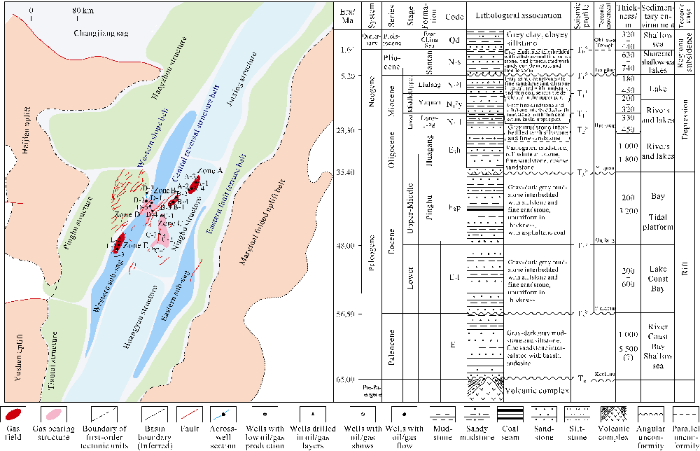
Fig. 1.
Regional structure position and comprehensive stratigraphic column of the central reversal tectonic belt of the Xihu Sag.
Since the Cretaceous, the East China Sea Basin has experienced seven regional tectonic movements (Fig. 1b), namely the Keelung movement, the Yandang movement, the Oujiang movement, the Yuquan movement, the Huagang movement, the Longjing movement and the Okinawa Trough movement[9,10]. The period from the Cretaceous to the end of the Eocene is called a rift period during which tanstensional faults were developed due to overall extensive tectonics. The period from the end of the Oligocene to the end of the Miocene is called an inversion period during which compressive-twisted faults were developed due to horizontal compression. The period from the Late Pliocene to the Quaternary is a regional subsidence period during which the East China Sea Shelf Basin and the Okinawa Trough Basin were dominated by regional subsidence and back-arc expansion, respectively, generating shear strike-slip faults[11,12]. Studies have shown that there are three fault systems in the East China Sea basin: NNE-NE faults are primary, and NW and near EW faults are secondary. The formation and evolution of the faults were closely related to the three major stages from rifting to inverting to regional subsidence experienced by the East China Sea[13,14]. This paper focuses on the study of the fracture system associated with the formation and evolution of folds and faults with different mechanical properties and their matching relationship with oil and gas migration and accumulation.
2. Fracture development
2.1. Macroscopic characteristics
According to the genetic classification, the fracture types observed macroscopically in the cores from the study area are diagenetic fractures and tectonic fractures after removing drilling-induced fractures. The diagenetic fractures are mainly interlayer fractures (Fig. 2a), caused by the changing sedimentary rhythm[15]. In addition, there are a small number of shrinkage fractures (Fig. 2b), weathering fractures, intra-gravel fractures, and gravel-edge fractures, etc. Tectonic fractures are the results from external stress, which are produced when internal stress exceeds breaking pressure[15,16,17] (Fig. 2c and 2d). In the cores (totally 869.95 m long) from 19 wells drilled in the Huagang Formation in the study area, 439 diagenetic fractures were observed, which are developed in every well; tectonic fractures are less, only 63. This may be related to local structures or fault activities[18].
Fig. 2
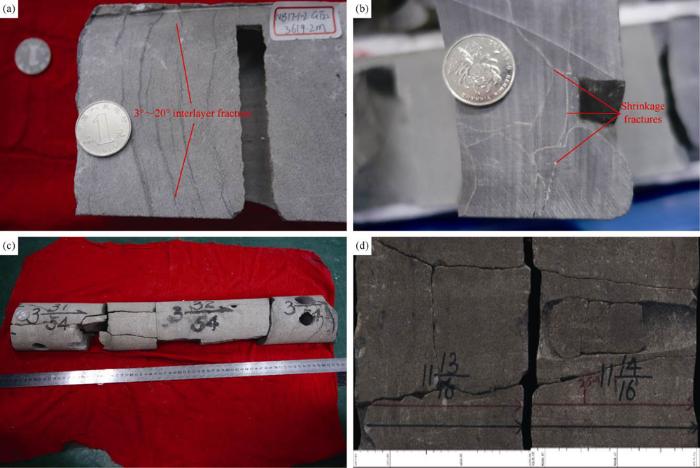
Fig. 2
Typical core fracture types in the Huagang Formation. (A) Well A-2, 3619.25-3619.30 m, interlayer fractures; (b) Well B-1, 3866.50-3866.56 m, shrinkage fractures; (c) Well E-1, 4649.07-4649.74 m, tectonic fractures; (d) Well B-2, 4247.85-4248.30 m, tectonic fractures.
Referring to the classification standard for fracture occurrence in table 1[19], of the 502 diagenetic fractures and tectonic fractures observed in the cores, there are 173 horizontal fractures, accounting for 34.4%; 270 low-angle oblique fractures, accounting for 53.8%; 40 high-angle oblique fractures, accounting for 8.0%; and 19 vertical joints, accounting for 3.8%. Most fractures are low-angle oblique and horizontal ones, and less are high-angle oblique and vertical ones. In the digenetic fractures, most are low-angle oblique and horizontal. All tectonic fractures are high-angle oblique and vertical.
Table 1 A reference table for classification of fracture occurrence[19].
| Fracture type | Fracture angle/(°) |
|---|---|
| Vertical fracture | Larger than 85 |
| High-angle oblique fractures | 45-85 |
| Low-angle oblique fractures | 5-45 |
| Horizontal fractures | Less than 5 |
2.2. Microscopic characteristics
According to the positions of microscopic fractures vs. rock particles observed on sections, there are fractures penetrating grains (penetrating fractures), inside grains (intragranular), and on the edges of grains (edge fractures)[20,21,22]. Penetrating fractures are caused by tectonic movements, usually parallel, and not restricted by rock particles. Intragranular fractures and edge fractures are not caused by tectonic movements. They are irregular in distribution, usually inside and around large quartz grains[23]. In addition, sutures and muddy strips are common.
According to the observation to thin sections of the Huagang Formation in the study area, microscopic fractures are more developed in zones A and B (Fig. 1a). The microscopic fractures in zone A are penetrating fractures, and 50% of which are filled with peat and calcite (Fig. 3a and 3b). Penetrating fractures have long extension, good connectivity and different widths, 1.5 mm to the maximum (Fig. 3c). Of the microscopic fractures in zone B, 61% are penetrating ones, 30% are edge ones, and much less are intragranular. The edge fractures and intragranular fractures are not filled. They extend near and, are not connected with fractures outside. They are narrow, about 0.03 mm (Fig. 3d), and poor in effectiveness. In general, the microscopic fractures in the Huagang Formation in the study area are penetrating ones accounting for 76%, and edge fractures and intragranular ones accounting for 24%. The overall effectiveness of the microscopic fractures is good, and most of them are not filled (accounting for 71.4%). Filled fractures are filled with mainly peat and calcite.
Fig. 3.
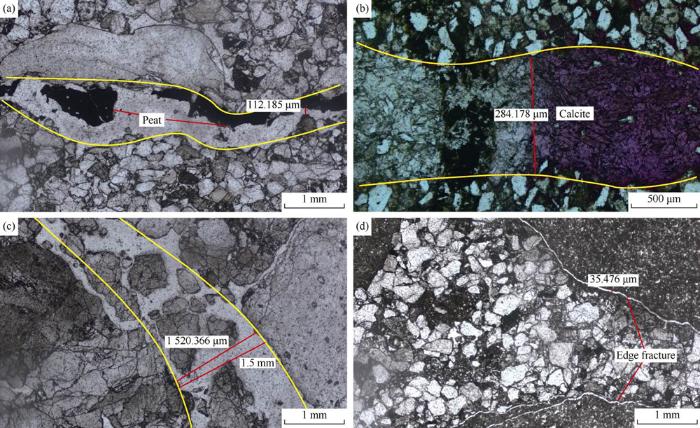
Fig. 3.
Microscopic characteristics of fractures in the Huagang Formation in zones A and B. (a) Well A-2, 3610.97 m, 2.5×10, single polarized light, penetrating fractures, filled with peat; (b) Well A-3, 4108.90 m, 5×10, single polarized light, penetrating fractures, filled with calcite; (c) Well A-4, 3911.40 m, 2.5×10, single polarized light, a penetrating fracture, about 1.5 mm wide; (d) Well B-2, 3797.50 m, 2.5×10, single polarized light, edge fractures.
Microscopic fractures and fracture systems, working as channels for fast fluid migration, not only improve reservoir permeability, but also promote dissolution. Microscopic observation to thin sections (Fig. 4) and analysis of fault systems indicate that strong dissolution always occur in microfracture development zones and around oil source faults. For example in the H3 section of the Huagang Formation in zone D, there are thick central bars and superimposed sand bodies at the bed of the large braided river; although the sedimentary environment is less different, the physical properties of the reservoirs at similar depths within a structure are obvious, and the physical properties of the H3 section are obviously affected by fault development. Around Wells D-1 and D-2, normal faults (connecting to oil sources) are developed with large fault throws; the faults and associated fractures have a strong ability to transport acidic fluids, so the physical properties of the H3 section are better than those around other wells. Around Well D-4, the fault throw of the reverse fault (connecting to oil sources) is not obvious; the ability of the faults and associated fractures to transport acidic fluids is poor, so that the physical properties of the H3 section, especially the permeability, are slightly worse than those around Wells D-1 and D-2. No oil source faults were found around Well D-3, so there is no acid fluid. Weak dissolution caused the worst physical properties (Table 2).
Fig. 4.
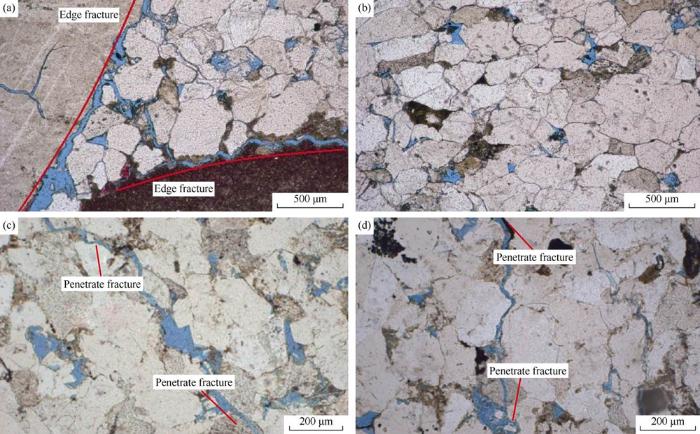
Fig. 4.
Typical microfractures on thin sections of Huagang Formation promote dissolution. (a) Well D-2, 4614.70 m, 5×10, dissolved fractures on grain margin; (b) Well D-2, 4613.10 m, 5×10, strong compaction, line contact, fractures not developed; (C) Well E-1, 4647.46 m, 10×10, dissolution on both ends of the penetrating fracture; (d) Well E-1, 4646.26 m, 10×10, dissolution on both ends of the penetrating fracture.
Table 2 Statistics of logging fracture identification in single wells in the study area.
| Well | Tectonic fractures | Interlayer fractures | Unfilled fractures | Filled fractures | Total | Linear fracture density/ (item/m) |
|---|---|---|---|---|---|---|
| A-1 | 116 | 180 | 74 | 222 | 296 | 0.235 |
| A-2 | 16 | 55 | 20 | 51 | 71 | 0.147 |
| A-3 | 81 | 129 | 63 | 147 | 210 | 0.276 |
| A-4 | 115 | 127 | 31 | 211 | 242 | 0.443 |
| B-1 | 42 | 93 | 30 | 105 | 135 | 0.257 |
| B-2 | 117 | 136 | 28 | 225 | 253 | 0.398 |
| B-3 | 66 | 98 | 66 | 98 | 164 | 0.160 |
| C-1 | 41 | 103 | 75 | 69 | 144 | 0.130 |
| D-2 | 17 | 106 | 34 | 89 | 123 | 0.141 |
| D-3 | 4 | 17 | 9 | 12 | 21 | 0.111 |
| D-4 | 10 | 8 | 11 | 7 | 18 | 0.047 |
| D-5 | 22 | 71 | 41 | 52 | 93 | 0.208 |
| Total | 647 | 1123 | 482 | 1288 | 1770 | 0.215 (average) |
2.3. Logging fracture interpretation
Because of its high resolution and full-hole scanning characteristics, imaging logging can reflect macroscopic geological phenomena, such as bedding, fractures, and sutures. Based on the image characteristics of geological phenomena on imaging logging maps[22,23,24,25,26], core fractures observed can be analyzed. Fractures in the Huagang Formation in the study area are summarized as shown in Fig. 5. The natural fractures are divided into unfilled fractures and filled fractures. In terms of the causes, they are diagenetic fractures and tectonic fractures. The diagenetic fractures identified on imaging logs are basically interlayer ones.
Fig. 5.
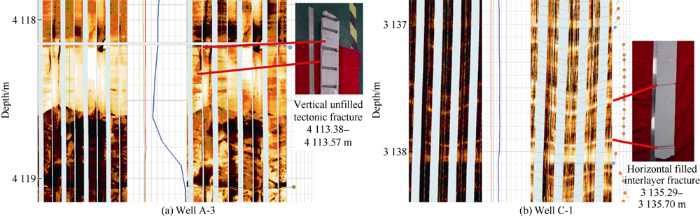
Fig. 5.
Fracture identification of typical FMI imaging logging in the study area.
The natural fractures in 4 zones and 12 wells are interlayer ones, accounting for 63.45%, and tectonic ones accounting for 36.55%. Most of them are filled, accounting for 72.77%, while the unfilled account for 27.23%. Roughly judged, the effectiveness of fractures developed in the 12 wells is relatively low.
Through statistical analysis of the orientation, occurrence, width and filling characteristics of tectonic fractures (Fig. 6), it is found that the tectonic fractures in the study area are mainly developed in zones A and B, and their orientation is mainly 60°-80° NE, and consistent with the tectonic axis and the fault. Tectonic fractures are mainly high-angle oblique ones, accounting for 71.88%, vertical fractures account for 14.37% and low-angle oblique fractures account for 13.75%. The width of the tectonic fractures is mainly 0-0.5 mm, followed by 0.5-1.0 mm. Less fractures are wider than 1.0 mm each. 75.58% of the tectonic fractures are filled.
Fig. 6.
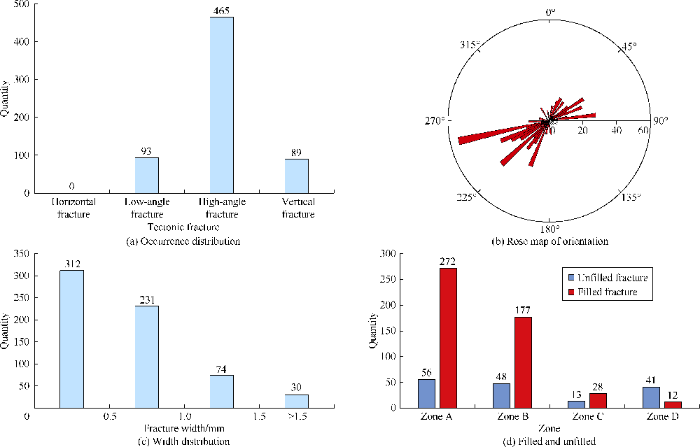
Fig. 6.
Imaging logging identification of tectonic fractures in the study area.
3. Relationship between fracture development stages and oil and gas charging
3.1. Fracture development stages
Based on the observation to cores and microscopic fractures, the time sequence and configuration of fractures and fracture fillings were analyzed, and then geochemical analysis to the calcite veins filled in the fractures were carried out to determine the fracture development stages in the Huagang Formation in the study area.
3.1.1. Core and microscopic observation
On the core, it is clear that the tectonic fractures cut the diagenetic fractures (Fig. 7a); the high-angle oblique fractures cut the near-horizontal interlayer fractures, but it is not the case among the tectonic fractures, so the tectonic fractures may be later than the interlayer fractures. Under a microscope, it is easy to observe microfractures caused by flexural deformation and rupture of muddy strips and sutures (Fig. 7b). Such fractures extend nor far, and they are narrow and less effective. In addition, long, wide and effective penetrating fractures (Fig. 7c) were found in the muddy strips. Therefore, the former is classified as microfractures caused by weak tectonic stress, which are usually developed in early tectonic movements with weaker tectonic stress; the latter is tectonic fractures formed by strong tectonic stress. The phenomenon of peat broken into fractures could be found in the penetrating fractures (Fig. 7d), indicating that present tectonic fractures were controlled by multiple tectonic activities.
Fig. 7.
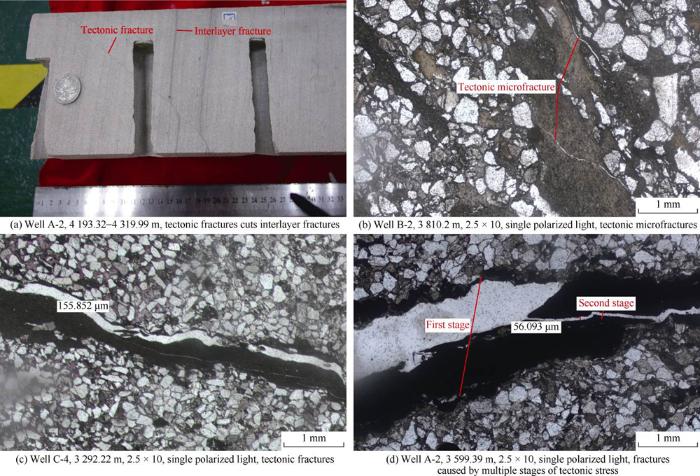
Fig. 7.
Core and microscopic observation on fracture development stages in the Huagang Formation.
3.1.2. Cathodoluminescence
Calcite veins show cathodic light with different intensity under a microscope, depending on the value of Mn2+/Fe2+ in the veins[27,28]. According to the characteristics of cathodoluminescence (Fig. 8), the calcite veins filling in the fractures in the study area can be divided into two stages: the calcite veins in one stage show dark red light and are distributed on both sides of the fractures in a mass form; the calcite veins in the other stage are orange-red and are distributed in the middle of the fractures and around dark red masses. The boundaries of the two stages of calcite veins are unclear. Since they were developed in the similar period, they are inherited.
Fig. 8.
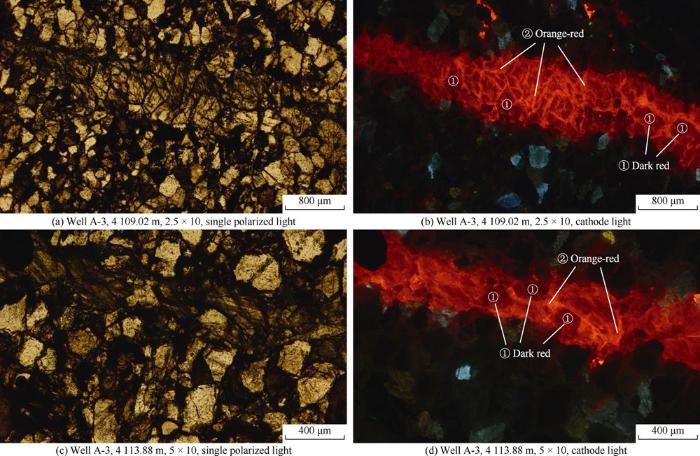
Fig. 8.
Cathodoluminescence of calcite veins in the fractures in the Huagang Formation.
3.1.3. Analysis of trace elements
Under a microscope, calcites in high-angle tectonic fractures can be divided into two types: the first type is coarse calcite with clean surfaces and located in the center of the fracture; the second type is fine calcite with dirty surfaces and located at the edge of the fracture (Fig. 9a, 9b).
Fig. 9.

Fig. 9.
Analysis of trace elements in the calcite filling in the fractures of the Huagang Formation.
Laser in-situ measurements of trace elements in microzones (Tables 3 and 4) indicate that type 2 calcite was settled earlier than type 1 calcite; type 2 calcite has higher Na, K, Al, Ba, Si, and Fe/Mn contents; the radar charts of trace elements of the two types have obviously different characteristics (Fig. 9c and 9d), proving that the fluid to promote the settlement of calcite has multiple stages and are inherited.
Table 3 Results of trace element analysis of coarse calcite.
| Sample ID | Mass fraction of carbornate/% | Trace elements content/(10-3 mg·g-1) | Fe/Mn | |||||||
|---|---|---|---|---|---|---|---|---|---|---|
| CaCO3 | MgCO3 | Na | K | Al | Ba | Si | Mn | Fe | ||
| A-3-29-1-1 | 94.3 | 0.85 | 13.90 | 0.17 | 46.8 | 532 | 7 444 | 8 764 | 1.177 | |
| A-3-29-1-2 | 93.8 | 0.91 | 1.02 | 0.90 | 124.0 | 354 | 7 969 | 9 753 | 1.224 | |
| A-3-29-1-3 | 94.6 | 0.75 | 1.45 | 0.39 | 32.8 | 447 | 7 702 | 8 338 | 1.083 | |
| A-3-29-2-4 | 94.2 | 0.84 | 6.05 | 3.49 | 0.43 | 46.1 | 366 | 7 653 | 9 277 | 1.212 |
| A-3-29-2-5 | 94.6 | 0.76 | 1.73 | 4.27 | 1.01 | 31.4 | 387 | 7 375 | 8 464 | 1.148 |
| A-3-29-2-6 | 94.9 | 0.75 | 0.39 | 0.14 | 42.4 | 337 | 6 449 | 8 009 | 1.242 | |
| A-3-29-3-7 | 93.9 | 0.84 | 7.06 | 0.65 | 0.40 | 45.0 | 644 | 8 011 | 9 857 | 1.230 |
| A-3-29-3-9 | 94.3 | 0.75 | 2.65 | 2.02 | 0.60 | 53.5 | 568 | 7 346 | 8 777 | 1.195 |
| A-3-30-1-10 | 95.2 | 0.74 | 9.21 | 0.33 | 46.6 | 487 | 4 453 | 9 465 | 2.126 | |
| A-3-30-1-11 | 94.5 | 0.77 | 10.30 | 3.98 | 0.71 | 54.0 | 404 | 5 940 | 9 410 | 1.584 |
| A-3-30-1-12 | 94.0 | 0.85 | 9.28 | 8.89 | 0.39 | 743 | 4 287 | 10 658 | 2.486 | |
| A-3-30-2-13 | 94.8 | 0.82 | 21.70 | 13.10 | 2.53 | 40.4 | 772 | 3 756 | 10 547 | 2.808 |
| A-3-30-2-14 | 94.4 | 1.04 | 38.00 | 35.40 | 3.97 | 61.7 | 613 | 3 862 | 11 130 | 2.882 |
| A-3-30-4-19 | 94.9 | 0.76 | 13.50 | 9.90 | 18.30 | 60.9 | 548 | 2 763 | 10 129 | 3.666 |
| A-3-34-1-22 | 94.3 | 0.73 | 20.40 | 31.90 | 3.17 | 65.5 | 8 102 | 8 378 | 1.034 | |
| A-3-34-1-23 | 94.4 | 0.71 | 2.22 | 0.91 | 50.4 | 568 | 7 471 | 7 730 | 1.035 | |
| A-3-34-1-24 | 94.2 | 0.72 | 4.01 | 0.50 | 0.49 | 61.4 | 577 | 7 850 | 7 763 | 0.989 |
| A-3-34-2-25 | 94.8 | 0.73 | 3.67 | 4.45 | 1.05 | 27.9 | 403 | 7 663 | 8 366 | 1.092 |
| A-3-34-2-26 | 94.8 | 0.69 | 1.25 | 1.85 | 29.0 | 623 | 7 011 | 7 795 | 1.112 | |
| A-3-34-2-27 | 93.9 | 0.86 | 4.20 | 5.04 | 0.78 | 34.2 | 407 | 9 044 | 9 301 | 1.028 |
| A-3-34-3-28 | 93.9 | 0.82 | 10.70 | 2.73 | 0.27 | 51.6 | 728 | 9 902 | 8 981 | 0.907 |
| A-3-34-3-30 | 94.2 | 0.70 | 16.60 | 13.10 | 28.00 | 59.9 | 536 | 7 729 | 8 007 | 1.036 |
| Average | 94.4 | 7.94 | 15.40 | 9.10 | 5.50 | 52.1 | 538 | 6 581 | 9 167 | 1.600 |
Table 4 Results of trace element analysis of fine calcite.
| Sample ID | Mass fraction of carbornate/% | Trace elements content/(10-3 mg·g-1) | Fe/Mn | |||||||
|---|---|---|---|---|---|---|---|---|---|---|
| CaCO3 | MgCO3 | Na | K | Al | Ba | Si | Mn | Fe | ||
| A-3-29-3-8 | 80.5 | 0.62 | 501.00 | 6495.0 | 8964 | 1130.0 | 19 383 | 7 395 | 6 254 | 0.846 |
| A-3-30-2-15 | 68.0 | 1.00 | 78.70 | 9128.0 | 20708 | 284.0 | 32 548 | 5 067 | 7 820 | 1.543 |
| A-3-30-3-16 | 94.1 | 0.83 | 22.90 | 71.9 | 224 | 46.0 | 1 147 | 4 393 | 10 661 | 2.427 |
| A-3-30-4-20 | 92.4 | 0.89 | 9.61 | 676.0 | 1129 | 54.6 | 3 294 | 3 053 | 11 839 | 3.878 |
| A-3-30-4-21 | 93.5 | 0.83 | 6.58 | 341.0 | 608 | 94.1 | 1 690 | 4 129 | 10 035 | 2.431 |
| A-3-34-3-29 | 92.0 | 0.83 | 452.00 | 326.0 | 780 | 104.0 | 2 941 | 9 457 | 8 997 | 0.951 |
| Average | 86.8 | 0.83 | 178.00 | 2840.0 | 5402 | 285.0 | 10 167 | 5 582 | 9 268 | 2.013 |
3.1.4. Fluid inclusions
Fluid inclusions are geological fluid samples encapsulated in mineral lattice defects or caves during the mineral growth process[29,30,31]. The petrographic characteristics and homogenous temperature of the inclusions which were formed at the same time as the fracture fillings can be referred to for predicting the fracture formation period[32,33].
Observation and identification found that many inclusions were distributed like stripes in the microfractures in the calcite veins. The inclusions are free of fluorescence (Fig. 10a). There found oil and gas inclusions with high GOI ( grain with oil inclusion, 4% to 5%), dark gray gas hydrocarbon inclusions, colorless-gray hydrocarbon-containing brine inclusions, and local brown liquid hydrocarbon inclusions. There also found medium to light oils in the intercrystalline microfractures in the calcite veins and the pores among the sandstone grains, which show strong light blue fluorescence (Fig. 10b). According to the homogeneous temperature (Tm) of the inclusions in zone A, the inclusions are divided into three stages: stage I inclusions have Tm of 136-159 °C and gas-liquid ratio less than 5%; stage II’s Tm is 162-179 °C and gas-liquid ratio is less than 5%; stage III’s Tm is 196-207 °C and gas-liquid ratio is less than 10% (Fig. 11).
Fig. 10.

Fig. 10.
Microscopic characteristics of inclusions in calcite veins in the Huagang Formation.
Fig. 11.
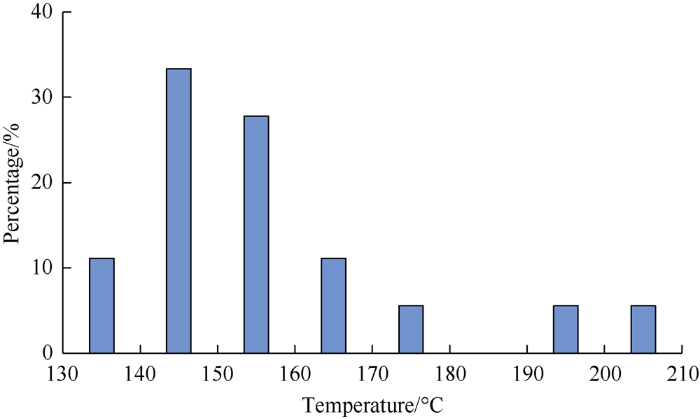
Fig. 11.
Homogenous temperature of inclusions in Huagang Formation in zone A.
Compared with the thermal history and burial history of the study area (Fig. 12), it is found that the homogenous temperature of stage 1 inclusions roughly corresponds to the ground temperature in the middle-late Himalayan Longjing movement (hereinafter referred to as the Longjing movement), indicating the inclusions should be captured during the Longjing movement. The homogenous temperature of stage 2 inclusions is consistent with the ground temperature in the Himalayan Okinawa movement period (hereinafter referred to as the Okinawa movement), indicating stage 2 inclusions should be captured during the Okinawa movement. The homogenous temperature of stage 3 inclusions is relatively high, indicating deep fluid activities. Because of the tectonic fractures still acting as channels for oil and gas migration after oil and gas charging, or lost, deformed and extending inclusions, the temperature is high.
Fig. 12.
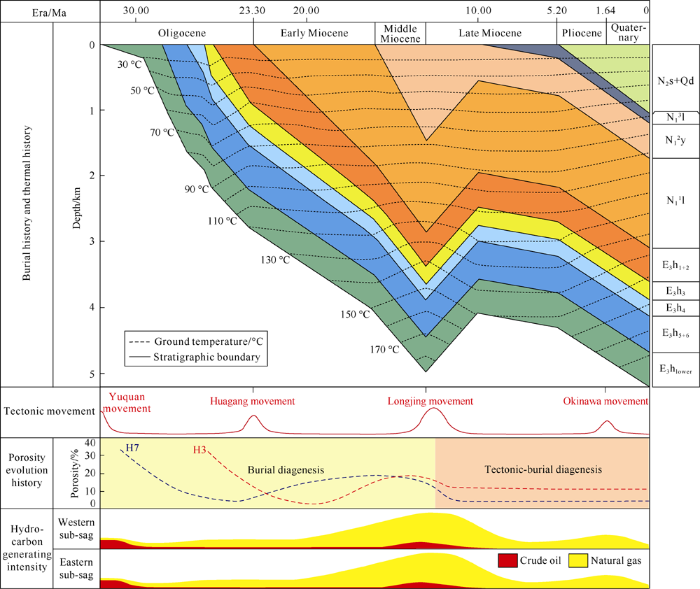
Fig. 12.
The burial history, thermal history and hydrocarbon generating history of Well B-1.
Based on the above research, the development stages of the tectonic fractures were determined in the Huagang Formation in the central reversal tectonic belt of the Xihu Sag. The first stage of fractures was generated in the early Longjing Movement, when the tectonic stress caused the sutures and shale strips to twist, deform, and break. Tectonic microfractures generated in this period have short extension, narrow width, and poor effectiveness. The second stage of fractures came up during the middle-late Longjing Movement, when horizontal compressive stress caused the development of tectonic fractures in the central reversal tectonic belt; these fractures are of large scale, long extension, and good effectiveness, and they are matched with the first stage of inclusions developed in the calcite veins. The third stage of fractures were created from the Okinawa Trough movement to the present day; tectonic activities made the second stage of fractures open again, and the third stage of fractures developed over them. They are matched with the second stage of inclusions in the calcite veins.
3.2. Relationship between fracture development stages and oil and gas charging
According to the dating result of 40Ar/38Ar isotopes of authigenic illite (Table 5)[34], the earliest gas charging into H3 and H4 in zones A and B was 9.35 Ma to 11.40 Ma, corresponding to the middle Longjing movement. In addition, by comparing the homogenous temperature of the inclusions in the Huagang Formation with the hydrocarbon generating intensity, burial history and thermal evolution history of the study area, and considering the hydrocarbon generating intensity (Fig. 12), it’s found that high-intensity hydrocarbon generation happened two times in the western and the eastern sub-sags. The first time is related to the Longjing movement. Under the action of burial and tectonic stress, the reservoir was gradually tight, and both the eastern and the western sub-sags supplied hydrocarbons. The finding is consistent with the dating result of authigenic illite. The second time corresponds to the period from the Okinawa trough movement to today, and the eastern and the western sub-sags have been supplying hydrocarbon.
Table 5 Dating results of 40Ar/38Ar isotopes of autogenic illite in the Xihu Sag.
| Well | Depth/m | Layer | K2O/ % | 40K/ (10-7 mol·g-1) | 40Ar/38Ar | 38Ar/36Ar | 40Ar*/ (10-10 mol·g-1) | 40Ar*/40Ar/ % | 40Ar*/40K | Age/Ma |
|---|---|---|---|---|---|---|---|---|---|---|
| B-2 | 3 699.30-3 716.20 | H3 | 9.08 | 2.18 | 1.004 5 | 689.496 6 | 1.18 | 56.37 | 0.000 5 | 9.35±0.16 |
| B-2 | 3 808.90-3 820.90 | H3 | 9.15 | 2.19 | 1.051 6 | 779.816 8 | 1.45 | 63.05 | 0.000 7 | 11.32±0.21 |
| B-1 | 3 855.00-3 861.00 | H3 | 9.99 | 2.40 | 0.996 6 | 797.154 0 | 1.32 | 61.83 | 0.000 5 | 9.44±0.16 |
| B-2 | 4 005.70-4 014.10 | H4 | 9.66 | 2.32 | 1.031 3 | 763.412 3 | 1.36 | 61.53 | 0.000 6 | 10.05±0.19 |
| A-2 | 3 597.50-3 618.10 | H3 | 9.40 | 2.25 | 1.157 8 | 790.793 9 | 1.50 | 66.89 | 0.000 7 | 11.40±0.21 |
According to the relationship between the fracture development stage in the Huagang Formation and the hydrocarbon charging period in the study area (Fig. 13), the first stage of oil and gas charging is important, during which natural gas was charged more and crude oil less. The charging period was 9-12 Ma, corresponding to the middle-late Longjing movement. The inclusions are present in the calcite veins of fractures and the second-stage calcite cements, with homogenous temperature of 136-159 °C and high GOI (3%-5%). The local GOI of the inclusions in the second-stage calcite cements is as high as 40%[35]. At that time, the study area was affected by the Longjing movement, the Huagang Formation developed the second-stage tectonic fractures, with large scale, long extension, and good effectiveness, and the fractures played an important role in hydrocarbon migration and transportation. The second stage of oil and gas charging was relatively late. It started since 0 to 3 Ma, corresponding to the Okinawa Trough movement up to now. The charging scale is relatively large, during which more natural gas was charged. The homogenous temperatures of the inclusions in the calcite veins of fractures are 162-207 °C, and the gas-liquid ratio is less than 10%. The highest homogenous temperature is up to 196-207 °C, indicating deep hydrothermal fluid activities. At that time, the second-stage tectonic fractures opened again under the influence of the Okinawa Trough, and the third-stage tectonic fractures developed over them, which created conditions for continuous migration and transportation of oil and gas.
Fig. 13.
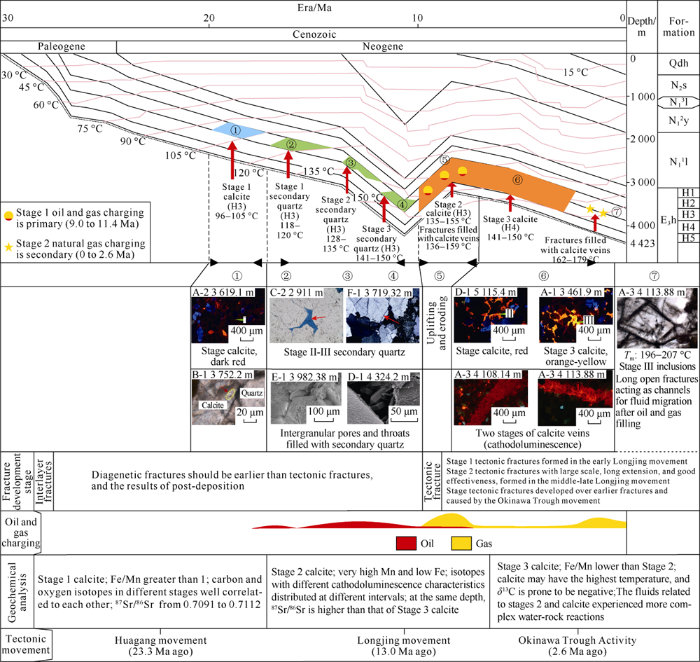
Fig. 13.
The matching relationship between the fracture development stage and the oil and gas charging stage.
Test while drilling to H5 in Well B-2 at 4240.00 to 4308.00 m delivered gas production at 4.98 × 10⁴ m3/d (through a 7.14 mm choke), and 9.80 × 10⁴ m3 at open flow, indicating successful test of the ultra-low permeability reservoir. According to logging interpretation, the average porosity of the tested section is 7.1%, and the average permeability is 0.37×10⁻³ μm2 (weighted). However, for the core samples taken from 4245.65 to 4248.47 m, the average porosity is 6.2% and average permeability is 0.19×10⁻³ μm2 (Fig. 14). In addition, high-angle tectonic fractures were observed on the core taken from 4247.85 to 4248.30 m (Fig. 2d). It is confirmed that tectonic fractures significantly improved the physical properties of the ultra-low permeability reservoirs, especially the permeability. It is also confirmed that fractures play an important role in productivity. At the same time, the logging interpretation of this tested section has abnormal gas logging features -- peak responses, indicating good oil/gas shows. In conclusion, the fracture-pore reservoir has a great exploration and development potential.
Fig. 14.
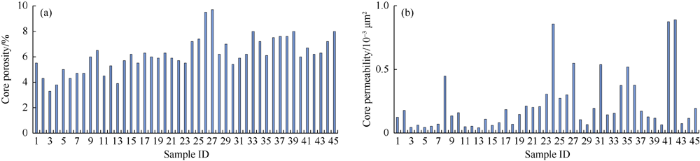
Fig. 14.
Core physical properties at 4254.65-4248.47 m in Well B-2.
4. Conclusions
Fractures in the Huagang Formation reservoir in the central reversal tectonic belt of the Xihu Sag are almost horizontal low-angle interlayer fractures filled with cements. They are poor and little control on oil and gas migration. High-angle tectonic fractures are mainly developed in zones A and B. They are distributed widely, extend long and effective, and play an important role in oil and gas migration. Microfractures can not only improve the reservoir permeability but also promote the dissolution. Therefore, it is possible to drill in fracture-pore reservoirs in the study area.
The diagenetic fractures in the Huagang Formation in the study area were formed during the diagenetic stage of the reservoir, and had little effect on oil and gas migration. The tectonic fractures are divided into three stages based on tectonic movements and their relationships with hydrocarbon charging. Stage 1 fractures were generated in the early Himalayan Longjing Movement (12-13 Ma ago), when the tectonic stress caused sutures and shale strips to twist, deform, and break. Tectonic microfractures generated in this period had short extension, narrow width, and poor effectiveness, and had little effect on oil and gas migration. Stage 2 fractures came up during the middle-late Himalayan Longjing Movement (9-12 Ma ago), when tectonic movements caused the development of tectonic fractures in the central reversal tectonic belt, which are of large scale, long extension, and good effectiveness, and matched with stage I oil and gas charging (9-12 Ma ago), so they played an important role in oil and gas migration and accumulation. Stage 3 fractures were created sine the Himalayan Okinawa Trough movement (0-3 Ma ago), the fractures were developed over the reopened stage 2 fractures, which are matched with stage II oil and gas charging (0-3 Ma ago). They created conditions for continuous natural gas migration. All these findings prove that the fractures in the Huagang Formation of the Xihu Sag are space and continuous and effective channels for oil and gas migration and accumulation. The potential of the fracture-pore reservoir is huge for exploration and development.
Reference
Tight gas in China and its significance in exploration exploitation
Geological evaluating methods for tight sandstone gas: GB/T 30501—2014
Study on the developing stage of Ordovician fractures in Tahe southern subsalt area
Development characteristics and controlling factors of shale fractures in the Longmaxi Formation in DS area, southeast Sichuan
Development of fractures and its effects on gas accumulation in the upper Paleozoic tight sandstone reservoirs of the Linxing Block
Geometry characteristic of the fault system in Xihu Sag and its formation mechanism
Reunderstanding of clastic rock sedimentary facies of Eocene Pinghu Formation in Pinghu Slope of Xihu Sag
Restoration and settlement of Xihu sag based on 3D seismic data. West-
Dynamic mechanism and numerical simulation of genesis of the East China Sea shelf basin
Study on fault structure of the East China Sea shelf basin using gravity and magnetic anomalies
Basin type and dynamic environment in the East China Sea shelf basin
Evolution of Cenozoic sedimentary basins in eastern China
Fracture prediction of low permeability reservoirs of the Mesozoic in North Yellow Sea Basin
The development and assessment of fault- association fracture system
Relationships between faults, extension fractures and veins, and stress
Microfracturing in the Upper Triassic Sichuan Basin tight-gas sandstones: Tectonic, overpressure, and diageneticorigins
Role of natural fractures and slot porosity on tight gas sand
Comprehensive prediction of the characteristics of the Mesozoic buried hill oil reservoir fracture development in block C of Dagang Oilfield
Automatic identification of rock fractures using acoustic image logging
Application of imaging well logging data in prediction of structural fracture
Fracture characteristics and identification of tight sandstone reservoirs in 2rd member of Xujiahe Formation in Yuanba Area
Characteristics and distribution evaluation of reservoir fractures in 5rd member of Xujiahe Formation in western Sichuan
Fulaishan fault zone fluid activity phase analysis-evidence from calcite vein cathodouminescence within fault zone
Analyzing paleopressure of DongYing Sag by using fluid inclusion
Research on thermal history of sedimentary basins
Development periods of fraetures in the Late Triassic-Jurassic in the north Chuxiong Basin
Classification methods for development period of fractures and its application: A case study from Budate Group of Hailaer Basin
Persopective on the K/Ar and Ar/Ar geochronology of authigenic illites: A case study from the Sulige gas field, Ordos Basin, China
Relationship between porosity evolution and hydrocarbon charging in tight sandstone reservoirs in Oligocene Huagang Formation, Xihu Sag, East China Sea Basin
