National Natural Science Foundation of China. U1562217
Abstract
The pore structure characteristic parameters of vuggy carbonate reservoirs were extracted, and matrix resistivity of vuggy reservoir was calculated by the percolation network simulation. A segmented cross-scale resistivity calculation method was established, in which the finite element method was used to simulate the resistivity of vuggy reservoirs. The mathematical models of vug porosity and water saturation with rock resistivity in vuggy carbonate reservoir were established, and the relationships between them were obtained. Experimental results verified the reliability of the simulation results. The method presented provides new technical means and research method for the resistivity log interpretation of vuggy carbonate reservoirs. The matrix porosity, vug porosity and matrix pore water saturation are the key factors determining the resistivity of reservoir rocks.
Keywords:Sichuan Basin
;
carbonate rock
;
vuggy reservoir
;
vug
;
resistivity
;
water saturation
HE Jiahuan, LI Min, ZHOU Keming, YANG Yu, XIE Bing, LI Nong, DANG Lurui, TANG Yanbing. Effects of vugs on resistivity of vuggy carbonate reservoirs. [J], 2020, 47(3): 527-535 doi:10.1016/S1876-3804(20)60070-2
Introduction
Carbonate reservoirs have rich oil and gas reserves, and oil and gas reservoirs with large reserves scale and high production worldwide are mostly carbonate ones[1,2,3,4,5,6]. Carbonate reservoirs in China are mainly distributed in the Sichuan, Tarim and Ordos basins. The carbonate reservoirs in the Tarim Basin are largely karst fracture-vug type. Those in the Ordos Basin are mainly karst pore-vug type. In the Sichuan Basin, the Sinian Dengying Formation, the Lower Cambrian Longwangmiao Formation, the Devonian Guanwushan Formation, the Carboniferous Huanglong Formation, the Permian Qixia Formation, the Triassic Feixianguan Formation, the Jialingjiang Formation, and the Leikoupo Formation have karst vug- type dolomite reservoirs, while the Middle Permian Maokou Formation has limestone karst fracture-vug reservoirs. In addition, the Sinian, Cambrian, and Middle Permian in the Sichuan Basin all have vuggy reservoirs. Studies have shown that marine carbonate reservoirs contribute 85% of conventional natural gas resources in the Sichuan Basin, making them the major formations of natural gas production in the Sichuan Basin[7,8,9].
Carbonate reservoirs with karst vugs have very complicated conductivity mechanism, so it is difficult to establish the relationship between the resistivity and water saturation of the reservoir using the Archie formula. The Archie formula was proposed for clastic rocks in 1942[10] and must meet three conditions: (1) The spatial distribution of rock porosity is uniform. (2) The spatial distribution of fluid saturation in the rock is uniform too. (3) The rock is electrically isotropic. Clearly, the vug-type carbonate reservoir doesn’t meet any of the three conditions listed above, and the development of vugs inevitably makes the resistivity of the reservoir abnormal. Thus, directly describing the relationship between the resistivity and water saturation of vug-type reservoir using Archie's formula is difficult. Currently, a worldly accepted method detecting karst vugs makes use of the abnormal characteristics of resistivity of water-filled karst vugs[11,12,13,14,15,16,17,18,19,20].
On logging and core scales, the development of vug makes it very difficult for logging interpreters to work out the conductivity mechanism and oil and gas saturation of reservoirs. Although the resistivity of vuggy carbonate rocks has been studied at home and abroad[21,22,23,24], the quantitative study of reservoir resistivity based on the pore structure characteristics of vuggy reservoir rocks are few. Liu Xiangjun[25] and Xiong Jian[26] conducted core resistivity experiments and analyzed from porosity, permeability and parameters in Archie's formula, but did not consider the pore structure characteristics of the rock. Zhang Zhaohui[27] simulated the theoretical resitivity of vug-type reservoir by using the principle of resistance series-parallel conduction and reached the conclusions that the resistivity decreased rapidly with the increase of throat diameter and increased with the resistivity of matrix and formation water. The model used in the simulation was relatively simple and couldn’t reflect the influence of pore structure characteristics, such as pore size distribution and pore ratio, on the resistivity of the reservoir. In view of the above deficiencies, this paper extracts the pore structure characteristic parameters of vuggy carbonate reservoirs, calculates the matrix resistivity using percolation network simulation technology, and establishes a segmented cross-scale resistivity calculation method to obtain the cave porosity and water saturation’s relationship with reservoir resistivity.
1. Numerical simulation of vuggy reservoir resistivity
The basic idea of simulating reservoir resistivity based on pore structure characteristics and percolation network simulation technology is to use network model to describe complex microscopic pore structure and use percolation theory to describe the quantitative relationship between macroscopic transport property and microstructure in pore space. The advantage of the method is that the model can reflect the pore structural characteristics of the reservoir rock such as pore size distribution and coordination number, and restore the actual pore structure of core as much as possible.
1.1. Extraction of pore structure characteristic parameters of vuggy reservoir
Taking the dolomite sample from the Sinian Dengying Formation in the Gaoshiti-Moxi block of the Anyue gas field in the Sichuan Basin as an example, the extraction of pore structure characteristic parameters of vug-type reservoir includes the following steps: (1) to extract the characteristic parameters of pore structure of complex reservoir rock by CT scan (Fig. 1a); (2) to import core scan images through VG Studio Max 3.0.1 64bit software to obtain core porosity, pore space distribution pattern (Fig. 1b) and pore size distribution frequency (Fig. 1c); and (3) to calculate the coordination number (2.867 on average) of the reservoir rock with Simple Core software to generate a ball and stick model (Fig. 1d).
Fig. 1.
Extraction of rock pore structure characteristic parameters of vuggy reservoirs. (a) Core CT scan photo; (b) Distribution characteristics of pores in the core; (c) Histogram of pore size distribution frequency; (d) Ball-stick model.
Jerauld[28] found that when the regular network with a certain structure and disordered network had the same connectivity, they had the same macroscopic flow and conduction properties. Therefore, only one network model that satisfies core porosity, pore size distribution frequency, and coordination number is needed to simulate reservoir resistivity. Wang Kewen[29] studied the transport characteristics of fluid and electric current by establishing a three-dimensional cube percolation network model, and compared their simulation results with real core experimental data, which proved that the percolation network model had similar micro characteristics and macro transport properties with the real core. Bernabé et al.[30,31] used both a two-dimensional and a three-dimensional percolation network model to study the permeability and conductivity of single-porous media. The single-porous medium percolation network model is a network model based on the establishment of a two-dimensional or three-dimensional equal-space grid, coupled with the average coordination number of percolation probability and satisfying the law of throat radius distribution.
In the case the variation coefficient of the pore size distribution is not big, the assumption of "equal spacing" is acceptable. But the sample shown in Fig. 1c has a minimum pore size of 0.02 mm and maximum pore size of 10 mm, that is a scale difference between the two of 500 times. Such a scale difference no longer meets the "equal spacing" assumption. Furthermore, the number of throats connected to the largest pore would be an order of magnitude larger than the number of throats connected to the smallest pore. Thus, using the average coordination number to generate the number of throats connected to the vug is no longer reasonable. A new resistivity simulation method to simulate the rock resistivity of typical vug-type reservoir characteristics must be worked out.
There are two proposed ideas for vuggy rocks: an embedded percolation network model and an equivalent dual- media percolation network model. The embedded percolation network model was proposed by Békri[32,33]. It is a percolation network model established by superimposing a small-scale pore throat network model on a large-scale pore network model. However, related research and popularization is limited due to the embedding of small-scale network models, the large number of nodes in this type of dual-medium network model, and the time consumption in simulation calculation. The equivalent dual-dielectric network model was proposed by Ahmadi[34], in which the matrix and pore throats in the model were split and then connected in parallel, so the resistivity of larger dissolved pores can be better reflected.
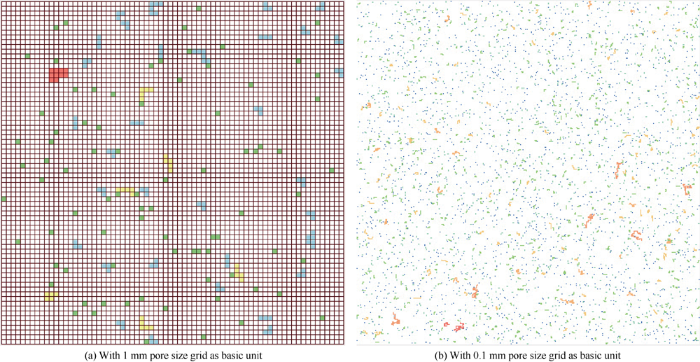
In order to characterize the effect of vug on resistivity and give full play to the advantages of percolation network in characterizing single-porous media, the pore size distribution frequency was divided into two parts in this work. As shown in Fig. 1c, the part with pore size smaller than 1 mm on the left side of the red line was taken as the "basic unit", and the resistivity of the basic unit was calculated with the LBT method proposed by Li Min[35]. A mesh model fitting the actual pore size distribution on the right side of the red line with pores larger than 1 mm was generated by random algorithm (Fig. 2a). Basic cell was used to characterize vugs. For example, a vug 10 mm in diameter is equivalent to 10 "basic cells". The mesh model generated by taking the part with pores smaller than 0.1 mm as the "basic unit" is shown in Fig. 2b. Clearly, when the water saturation of the reservoir is 100%, the resistivity of the basic unit can be calculated by the LBT method, while the resistivity of the vugs is equal to the formation water resistivity.
Fig. 2.
Random mesh models generated by different aperture distribution laws (different colors represent pores with different sizes; white represents the matrix).
Rock resistivity is calculated according to the law of conservation of electric current. The potential distribution in porous media is expressed by the following equations:
$\nabla \cdot J\text{=}{{Q}_{\text{j,v}}}$
$J\text{=}\sigma E\text{+}{{J}_{\text{e}}}$
$E\text{=}-\nabla U$
In a two-dimensional rectangular coordinate system, the current density is:
The physical meaning of equation (1) is that the divergence of the current density is equal to the amount of charge flowing out of a unit volume. That is, the charge density at that point. Equation (2) indicates that the current density is equal to the product of the electric field strength and the conductivity plus the displacement current density. For a stationary frame of reference, the displacement current density Je is zero. Equation (3) represents that the electric field strength equals to the negative gradient of potential difference.
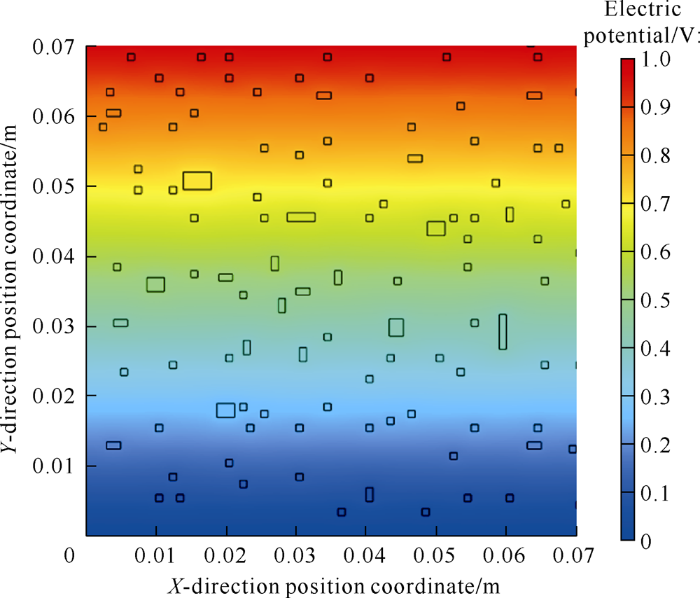
According to the regularity of pore size distribution, karst vugs of various sizes were generated and the potential distribution of vug-type reservoir rock was obtained by finite element simulation method (Fig. 3). Fig. 4 shows the potential field distribution in a square with a side length of 0.07 m. The top end of the study object is given a constant potential of 1 V and the bottom end is grounded to 0 V. The boxes in Fig. 4 represent vugs of different sizes saturated with formation water, and the rest represents the matrix. The formulas (8) and (9) were used to calculate the current density on the boundary.
Fig. 4.
Simulation results of potential distribution of vuggy reservoir. The boxes in the figure represent vugs of different sizes, and the rest of figure represents the matrix.
If ${{J}_{y,\text{input}}}$is equal to${{J}_{y}}_{\text{,output}}$, then the potential distribution of the vuggy reservoir has stabilized. The resistivity value of the vuggy reservoir can be calculated by formula (10).
According to the segmented cross-scale resistivity calculation method, the relationships between the vug porosity, water saturation of vug, pore-vug ratio and resistivity can be obtained.
2. Relationship between vug porosity and resistivity
2.1. Basic concepts
We define the focused area as “study object”, and its size or scale is determined by the researcher. When studying a core plug with a diameter of 2.5 cm (Fig. 5), the study object is the blue circle; when studying the whole diameter core, the study object is the yellow rectangle in the figure. If what the researchers look is electric logging data, then the diameter of study object is detecting diameter of the electric logging probe around the wellbore. If what the researchers examine is the entire formation, then the study object is the entire formation. The "vug porosity", ϕc, is defined as the ratio of vug volume to the research object volume. In order to simplify the calculation and show the results graphically, the volume is replaced by plane in this article. The N is set to satisfy the following conditions: the volume of N2 basic units is equal to the total volume of the study object, and ϕc and N are related to the selection of the study object. For vugs of the same size, as different study objects have different N values, so the vug porosity would be different.
Fig. 5.
Schematic diagram of selecting research objects.
2.2. Vug porosity threshold
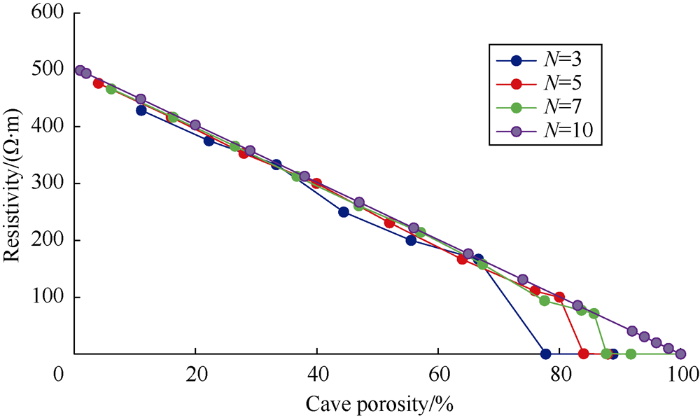
In the numerical simulation, it was assumed that the matrix resistivity was 500 Ω•m and the resistivity of formation water in the vug was 0.120 6 Ω•m. Values of N were taken as 3, 5, 7, 10 to simulate the change patterns of resistivity of the study object. As the vug porosity increases, the resistivity of the vuggy core decreases. When the vug porosity increases to a certain degree, the resistivity of the study object will rapidly drop to the same order of magnitude resistivity of the formation water (Fig. 6). We call the vug porosity when the resistivity drops suddenly “the vug porosity threshold” (ϕcc).
Fig. 6.
Relationship between resistivity and vug porosity of the research subject.
According to numerical simulation statistics, there is a relationship between the threshold value of the vug porosity and value N, the square root of the number of basic units in the research unit:
${{\phi }_{\text{cc}}}=1-{{N}^{-1}}$
Greater value of N means smaller ratio of single minimum vug volume to total volume of the study object, greater value of ϕcc, and it is more difficult for the resistivity of the study object to reach the level of formation water resistivity. Before the vug porosity reaches the threshold, the resistivity of the study object and the vug porosity meet the following relationship:
The physical meaning of formula (12) is that when the core is 100% saturated with saline, the resistivity of the study object (Ros) is equal to the product of the matrix resistivity (Rom) and the volume percentage of the matrix in the study object. Equation (12) has two extreme cases: (1) When the volume ratio of the vug to the study object is infinite, the vug porosity is 0, the threshold of the vug porosity is infinitely close to 100%, and Ros and Rom are equal. Under this situation, the characteristics of rock resistivity are in full compliance with the Archie formula, and formula (12) also degenerates into the Archie formula. (2) When the vug porosity is greater than the threshold of vug porosity, Ros and Rw are similar, and the resistivity of the study object is approximately equal to the formation water resistivity.
3. Relationship between vug water saturation and electrical resistivity
Compared with the relationship between vug porosity and resistivity, researchers pay more attention to the relationship between water saturation and resistivity[36,37,38]. Studies have shown that it is difficult to establish a correlation between resistivity and water saturation for vuggy reservoir. However, when vug resistivity and matrix resistivity are studied separately, the water saturation of the vug seems to have little effect on the resistivity of the study object.
3.1. Effect of vug water saturation on resistivity
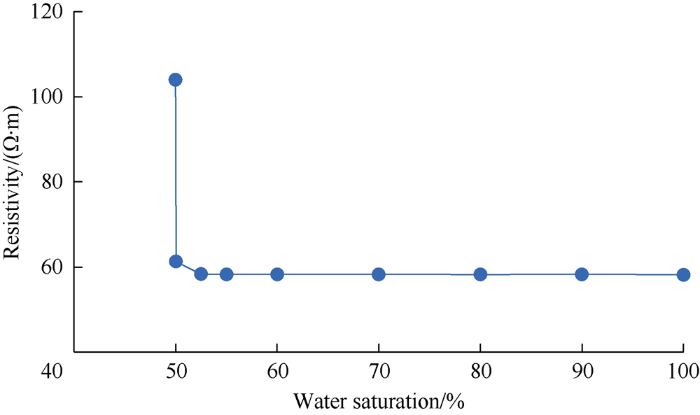
It was assumed that the porosity of the sample was 5%, the vug porosity was 2.5% and matrix porosity was 2.5%. The reduction of the water saturation in the research object started from the vug. When the water saturation of the vug decreased to nearly 0, the water saturation in the matrix pores gradually decreased. The simulation results show that before the water saturation of the vug reduced to 0, the resistivity of the research object didn’t change obviously (Fig. 7).
Fig. 7.
Simulation curve of resistivity and water saturation.
Similar conclusions were obtained from rock resistivity experiments. The sample No. 135 from the Cambrian Longwangmiao Formation in Well M203, Moxi Block, Anyue Gas Field, Sichuan Basin was used for rock resistivity experiment (Fig. 8a). It has a porosity of 11.41%, and was vacuumized and then saturated with brine 50 g/L in salinity under pressure. The resistivity of the brine was 0.14 Ω·m. The rock resistivity experiments were performed in accordance with current industry standard[39]. The experimental results show that when the vugs on the core surface are filled with salt water, the rock resistance value is 0.984 kΩ; when the vugs on the core surface have no salt water, the rock resistance value is 0.997 kΩ. It can be seen that the decrease of water saturation in the vugs has little effect on the resistivity. The resistivity curve of core sample with vugs is clearly divided into two straight line segments (Fig. 8b). The segment with smaller slope represents that the core water saturation change is mainly affected by the vug water saturation, indicating that the change of vug water saturation has a small effect on the system resistivity; the segment with larger slope represents that the core saturation change is mainly affected by the water saturation of the matrix pores, indicating that the resistivity is more sensitive to the change of water saturation in the matrix pores. If the effect of vugs on resistivity is ignored, the trend of most data points is in full compliance with the Archie formula.
Fig. 8.
Photos (a) and relationship between water saturation and resistivity of the experimental sample (b).
Both numerical simulation and experimental test results prove that water saturation of the vug has little effect on the resistivity of the study object. For vuggy reservoirs, the matrix pores and vugs can be studied separately. The resistivity of the matrix pores satisfies equations (13) and (14). The resistivity of the vugs satisfies equations (15) and (16).
To establish a specific expression for f(Swc), assuming that the vug is cylindrical, formation water exists in the form of water film in the vugs. The relationship between resistance and resistivity is known as:
$R{{C}_{\text{tc}}}=\frac{{{R}_{\text{tc}}}}{A}$
The resistivity of the water film part in the vug is derived using the micro-element method, and the expression is:
Equation (21) represents the vug resistivity equals to the ratio of formation water resistivity to vug water saturation. The resistivity of formation water is usually 0.1 Ω•m, and the resistivity of matrix pores is usually 50-1000 Ω•m. Only when the vug resistivity is close to the matrix resistivity, the vug resistivity will affect the resistivity of the study object. In the case the vug resistivity is much smaller than the matrix resistivity, the two have a relationship of equation (22). The equation means that the resistivity of the study object (Rts) is equal to the product of the matrix resistivity and the volume ratio of the matrix in the study object.
Numerical simulation, experimental analysis, and theoretical derivation have confirmed that the water in the vug doesn’t have much effect on the resistivity of the study object before it decreases to nearly zero. Therefore, for vuggy reservoir, it is difficult to determine the rock’s water saturation in the entire reservoir based on resistivity. For vuggy reservoir partially water-saturated, equation (22) has two implications: (1) The matrix resistivity differs from that of vuggy reservoir only by a coefficient and the magnitude of this coefficient is inversely proportional to the vug porosity; the greater the vug porosity, the lower the resistivity of the reservoir. (2) The relationship between matrix water saturation and matrix resistivity still meets the Archie formula, indicating that matrix water saturation is the key factor affecting the resistivity of vuggy reservoir.
3.2. Relationship between pore-vug ratio and resistivity
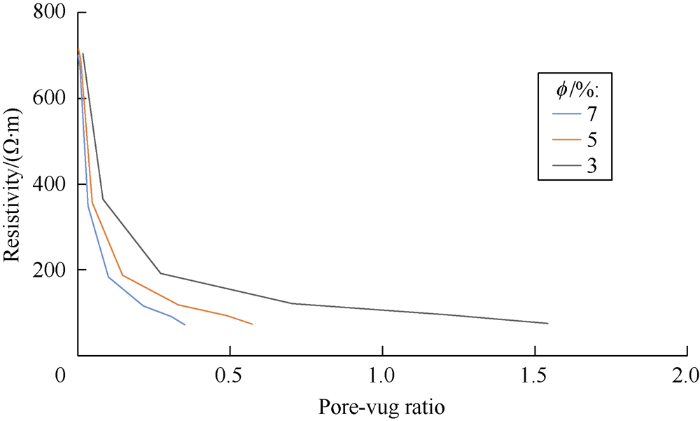
The pore-vug ratio is defined as the ratio of matrix porosity to vug porosity. In this numerical simulation, vugs in the vuggy reservoir meet the following assumptions: (1) vugs were isolated from each other and can be only connected through matrix pores; (2) pores directly connected with each other and adjacent vugs; and (3) vugs connected directly with their neighboring pores but not with the surrounding vugs. The larger the ratio of pore-vug, the larger the proportion of matrix porosity will be. Assuming the rock pores were 100% saturated with formation water, a network model was constructed to simulate and calculate the relationship between different pore-vug ratios and the resistivity of the study object (Fig. 9). At the same porosity, the larger the resistivity of the study object, and the lower the pore-vug ratio, the smaller the matrix pore ratio will be. At the same pore-vug ratio and 100% water saturation, the larger the total porosity, the lower the resistivity will be. At the same resistivity, larger total porosity and lower pore-vug ratio means larger vug porosity ratio.
Fig. 9.
Relationship between pore-vug ratio and resistivity of studied object.
Before the vug porosity passes a certain threshold, the matrix resistivity is the key factor determining the resistivity of the reservoir. When the matrix porosity is below a certain threshold, the phenomenon of "water formation with high resistivity" will occur. Therefore, when characteristics of reservoir pore structure are unclear, it would be inaccurate to claim that the reservoir contains oil only based on high resistivity. Even if the water saturation is 100%, the resistivity may be less than 100 Ω•m or exceed 500 Ω•m due to different pore-vug ratios. The same resistivity can correspond to different water saturations in reservoirs with different pore-vug ratios.
4. Conclusions
In this work, the technology calculating resistivity of vuggy reservoir has been established. It solves the technical problem of huge computation in estimating the resistivity of vuggy reservoir with percolation network theoretical model, and provides an effective means for resistivity calculation of reservoirs with large dissolved vugs.
The relationship between resistivity and vug porosity of vuggy reservoir is established. The larger the porosity of water-containing vugs, the lower the resistivity of the reservoir will be. When the vug porosity passes a certain threshold, the resistivity of the study object will be close to that of the formation water.
The mathematical model of the relationship between rock resistivity and water saturation of vuggy reservoir has been established, and the relationship between water saturation in vugs and resistivity of the study object has been worked out. The water saturation and resistivity of vuggy reservoir matrix meet Archie's formula. Furthermore, the vug water saturation has little effect on the resistivity of the reservoir.
Through experimental measurement and numerical simulation, the relationships between different pore-vug ratios and resistivity of the study object under the same porosity have been obtained. Under the same porosity, the denser the reservoir matrix, the higher the resistivity of the study object will be. This explains "the water formation with high resistivity" reasonably. The proportions of matrix porosity and vug porosity and the water saturation of matrix pore are the key factors affecting the resistivity of the reservoir rock.
Nomenclature
a, b—lithology coefficients in Archie formula;
A—cross-sectional area of a cylindrical vug, m2;
E—electric field strength, V/m;
Ex—electric field strength component in the x-direction, V/m;
Ey—electric field strength component in the y-direction, V/m;
Ei,j—electric field strength value for the i-th node in the x-direction and j-th node in the y-direction, V/m;
i—unit vector in the x-direction;
j—unit vector in the y-direction;
J—current density, A/m2;
Je—displacement current density, A/m2;
Jx—current density component in the x-direction, A/m2;
Jy—current density component in the y-direction, A/m2;
Jy,input—the inlet current density component in the y-direction, A/m2;
Jy,output—the outlet current density component in the y-direction, A/m2;
l—the length of the cylindrical vug, m;
m—cementation index in Archie's formula, related to rock cementation and pore structure;
n—saturation index in Archie's formula;
N—square root of the number of basic units in the research unit, natural number;
Qj,v—the amount of charge flowing out of a unit volume, C/m3;
r—diameter of the gas-containing portion in the cross-sectional area of the cylindrical vug, m;
R—the diameter of cross-sectional area of cylindrical vug, m;
RCg—tested resistance of gas-containing part in cylindrical vug, Ω;
RCtc—tested resistance for cylindrical vug saturated with brine and hydrocarbons, Ω;
RCw—tested resistance of water film part in cylindrical vug, Ω;
Roc—resistivity of vug 100% saturated with saline, Ω•m;
Rom—resistivity of the reservoir matrix 100% saturated with saline, Ω•m;
Ros—resistivity of study object 100% saturated with saline, Ω•m;
Rtc—apparent resistivity of vug saturated with saline, Ω•m;
Rts—resistivity of the study object partially saturated with brine and hydrocarbons, Ω•m;
Rtm—resistivity of rock matrix pores partially saturated with formation water and hydrocarbons, Ω•m;
Rw—formation water resistivity, Ω•m;
Swc—vug water saturation, %;
Swm—matrix pore water saturation, %;
U—difference of potential, V;
ρ—resistivity, Ω•m;
σ—conductivity, S/m;
σi,j—conductivity value of the i-th node in the x-direction and j-th node in the y-direction, S/m;
ϕ—porosity, %;
ϕc—vug porosity, %;
ϕcc—threshold value of vug porosity, %;
$\kappa $—number of the grid in the y-direction during numerical simulation.
Determining a relationship between a newly forming sinkhole and a former dry stream using electric resistivity tomography and very low-frequency electromagnetic in an urban karst setting
National Development and Reform Commission. Measurement and calculation methods of rock resistivity parameters in laboratory: SY/T 5385—2007. Beijing: Standards Press of China, 2007.
Characteristics and hydrocarbon distribution of the Paleozoic giant marine carbonate rock oil-gas fields in the world
1
2016
... Carbonate reservoirs have rich oil and gas reserves, and oil and gas reservoirs with large reserves scale and high production worldwide are mostly carbonate ones[1,2,3,4,5,6]. Carbonate reservoirs in China are mainly distributed in the Sichuan, Tarim and Ordos basins. The carbonate reservoirs in the Tarim Basin are largely karst fracture-vug type. Those in the Ordos Basin are mainly karst pore-vug type. In the Sichuan Basin, the Sinian Dengying Formation, the Lower Cambrian Longwangmiao Formation, the Devonian Guanwushan Formation, the Carboniferous Huanglong Formation, the Permian Qixia Formation, the Triassic Feixianguan Formation, the Jialingjiang Formation, and the Leikoupo Formation have karst vug- type dolomite reservoirs, while the Middle Permian Maokou Formation has limestone karst fracture-vug reservoirs. In addition, the Sinian, Cambrian, and Middle Permian in the Sichuan Basin all have vuggy reservoirs. Studies have shown that marine carbonate reservoirs contribute 85% of conventional natural gas resources in the Sichuan Basin, making them the major formations of natural gas production in the Sichuan Basin[7,8,9]. ...
Reservoir characteristics and accumulation modes of large carbonate gas fields in China
1
2013
... Carbonate reservoirs have rich oil and gas reserves, and oil and gas reservoirs with large reserves scale and high production worldwide are mostly carbonate ones[1,2,3,4,5,6]. Carbonate reservoirs in China are mainly distributed in the Sichuan, Tarim and Ordos basins. The carbonate reservoirs in the Tarim Basin are largely karst fracture-vug type. Those in the Ordos Basin are mainly karst pore-vug type. In the Sichuan Basin, the Sinian Dengying Formation, the Lower Cambrian Longwangmiao Formation, the Devonian Guanwushan Formation, the Carboniferous Huanglong Formation, the Permian Qixia Formation, the Triassic Feixianguan Formation, the Jialingjiang Formation, and the Leikoupo Formation have karst vug- type dolomite reservoirs, while the Middle Permian Maokou Formation has limestone karst fracture-vug reservoirs. In addition, the Sinian, Cambrian, and Middle Permian in the Sichuan Basin all have vuggy reservoirs. Studies have shown that marine carbonate reservoirs contribute 85% of conventional natural gas resources in the Sichuan Basin, making them the major formations of natural gas production in the Sichuan Basin[7,8,9]. ...
Reservoir geology and exploration theories of large gas fields in China
1
2013
... Carbonate reservoirs have rich oil and gas reserves, and oil and gas reservoirs with large reserves scale and high production worldwide are mostly carbonate ones[1,2,3,4,5,6]. Carbonate reservoirs in China are mainly distributed in the Sichuan, Tarim and Ordos basins. The carbonate reservoirs in the Tarim Basin are largely karst fracture-vug type. Those in the Ordos Basin are mainly karst pore-vug type. In the Sichuan Basin, the Sinian Dengying Formation, the Lower Cambrian Longwangmiao Formation, the Devonian Guanwushan Formation, the Carboniferous Huanglong Formation, the Permian Qixia Formation, the Triassic Feixianguan Formation, the Jialingjiang Formation, and the Leikoupo Formation have karst vug- type dolomite reservoirs, while the Middle Permian Maokou Formation has limestone karst fracture-vug reservoirs. In addition, the Sinian, Cambrian, and Middle Permian in the Sichuan Basin all have vuggy reservoirs. Studies have shown that marine carbonate reservoirs contribute 85% of conventional natural gas resources in the Sichuan Basin, making them the major formations of natural gas production in the Sichuan Basin[7,8,9]. ...
Distribution features of proved reserves of carbonate oil and gas pools in China
1
2009
... Carbonate reservoirs have rich oil and gas reserves, and oil and gas reservoirs with large reserves scale and high production worldwide are mostly carbonate ones[1,2,3,4,5,6]. Carbonate reservoirs in China are mainly distributed in the Sichuan, Tarim and Ordos basins. The carbonate reservoirs in the Tarim Basin are largely karst fracture-vug type. Those in the Ordos Basin are mainly karst pore-vug type. In the Sichuan Basin, the Sinian Dengying Formation, the Lower Cambrian Longwangmiao Formation, the Devonian Guanwushan Formation, the Carboniferous Huanglong Formation, the Permian Qixia Formation, the Triassic Feixianguan Formation, the Jialingjiang Formation, and the Leikoupo Formation have karst vug- type dolomite reservoirs, while the Middle Permian Maokou Formation has limestone karst fracture-vug reservoirs. In addition, the Sinian, Cambrian, and Middle Permian in the Sichuan Basin all have vuggy reservoirs. Studies have shown that marine carbonate reservoirs contribute 85% of conventional natural gas resources in the Sichuan Basin, making them the major formations of natural gas production in the Sichuan Basin[7,8,9]. ...
Reservoir and flow space of Lower Triassic carbonate gas reservoirs in Sichuan Basin
1
2006
... Carbonate reservoirs have rich oil and gas reserves, and oil and gas reservoirs with large reserves scale and high production worldwide are mostly carbonate ones[1,2,3,4,5,6]. Carbonate reservoirs in China are mainly distributed in the Sichuan, Tarim and Ordos basins. The carbonate reservoirs in the Tarim Basin are largely karst fracture-vug type. Those in the Ordos Basin are mainly karst pore-vug type. In the Sichuan Basin, the Sinian Dengying Formation, the Lower Cambrian Longwangmiao Formation, the Devonian Guanwushan Formation, the Carboniferous Huanglong Formation, the Permian Qixia Formation, the Triassic Feixianguan Formation, the Jialingjiang Formation, and the Leikoupo Formation have karst vug- type dolomite reservoirs, while the Middle Permian Maokou Formation has limestone karst fracture-vug reservoirs. In addition, the Sinian, Cambrian, and Middle Permian in the Sichuan Basin all have vuggy reservoirs. Studies have shown that marine carbonate reservoirs contribute 85% of conventional natural gas resources in the Sichuan Basin, making them the major formations of natural gas production in the Sichuan Basin[7,8,9]. ...
The division of reserve evaluation unit in fracture-cavity carbonate reservoir
1
2014
... Carbonate reservoirs have rich oil and gas reserves, and oil and gas reservoirs with large reserves scale and high production worldwide are mostly carbonate ones[1,2,3,4,5,6]. Carbonate reservoirs in China are mainly distributed in the Sichuan, Tarim and Ordos basins. The carbonate reservoirs in the Tarim Basin are largely karst fracture-vug type. Those in the Ordos Basin are mainly karst pore-vug type. In the Sichuan Basin, the Sinian Dengying Formation, the Lower Cambrian Longwangmiao Formation, the Devonian Guanwushan Formation, the Carboniferous Huanglong Formation, the Permian Qixia Formation, the Triassic Feixianguan Formation, the Jialingjiang Formation, and the Leikoupo Formation have karst vug- type dolomite reservoirs, while the Middle Permian Maokou Formation has limestone karst fracture-vug reservoirs. In addition, the Sinian, Cambrian, and Middle Permian in the Sichuan Basin all have vuggy reservoirs. Studies have shown that marine carbonate reservoirs contribute 85% of conventional natural gas resources in the Sichuan Basin, making them the major formations of natural gas production in the Sichuan Basin[7,8,9]. ...
Distribution and exploration direction of medium- and large-sized marine carbonate gas fields in Sichuan Basin, SW China
1
2019
... Carbonate reservoirs have rich oil and gas reserves, and oil and gas reservoirs with large reserves scale and high production worldwide are mostly carbonate ones[1,2,3,4,5,6]. Carbonate reservoirs in China are mainly distributed in the Sichuan, Tarim and Ordos basins. The carbonate reservoirs in the Tarim Basin are largely karst fracture-vug type. Those in the Ordos Basin are mainly karst pore-vug type. In the Sichuan Basin, the Sinian Dengying Formation, the Lower Cambrian Longwangmiao Formation, the Devonian Guanwushan Formation, the Carboniferous Huanglong Formation, the Permian Qixia Formation, the Triassic Feixianguan Formation, the Jialingjiang Formation, and the Leikoupo Formation have karst vug- type dolomite reservoirs, while the Middle Permian Maokou Formation has limestone karst fracture-vug reservoirs. In addition, the Sinian, Cambrian, and Middle Permian in the Sichuan Basin all have vuggy reservoirs. Studies have shown that marine carbonate reservoirs contribute 85% of conventional natural gas resources in the Sichuan Basin, making them the major formations of natural gas production in the Sichuan Basin[7,8,9]. ...
Genetic types and distinguished characteristics of dolomite and the origin of dolomite reservoirs
1
2018
... Carbonate reservoirs have rich oil and gas reserves, and oil and gas reservoirs with large reserves scale and high production worldwide are mostly carbonate ones[1,2,3,4,5,6]. Carbonate reservoirs in China are mainly distributed in the Sichuan, Tarim and Ordos basins. The carbonate reservoirs in the Tarim Basin are largely karst fracture-vug type. Those in the Ordos Basin are mainly karst pore-vug type. In the Sichuan Basin, the Sinian Dengying Formation, the Lower Cambrian Longwangmiao Formation, the Devonian Guanwushan Formation, the Carboniferous Huanglong Formation, the Permian Qixia Formation, the Triassic Feixianguan Formation, the Jialingjiang Formation, and the Leikoupo Formation have karst vug- type dolomite reservoirs, while the Middle Permian Maokou Formation has limestone karst fracture-vug reservoirs. In addition, the Sinian, Cambrian, and Middle Permian in the Sichuan Basin all have vuggy reservoirs. Studies have shown that marine carbonate reservoirs contribute 85% of conventional natural gas resources in the Sichuan Basin, making them the major formations of natural gas production in the Sichuan Basin[7,8,9]. ...
Petroleum geological conditions and exploration importance of Proterozoic to Cambrian in China
1
2018
... Carbonate reservoirs have rich oil and gas reserves, and oil and gas reservoirs with large reserves scale and high production worldwide are mostly carbonate ones[1,2,3,4,5,6]. Carbonate reservoirs in China are mainly distributed in the Sichuan, Tarim and Ordos basins. The carbonate reservoirs in the Tarim Basin are largely karst fracture-vug type. Those in the Ordos Basin are mainly karst pore-vug type. In the Sichuan Basin, the Sinian Dengying Formation, the Lower Cambrian Longwangmiao Formation, the Devonian Guanwushan Formation, the Carboniferous Huanglong Formation, the Permian Qixia Formation, the Triassic Feixianguan Formation, the Jialingjiang Formation, and the Leikoupo Formation have karst vug- type dolomite reservoirs, while the Middle Permian Maokou Formation has limestone karst fracture-vug reservoirs. In addition, the Sinian, Cambrian, and Middle Permian in the Sichuan Basin all have vuggy reservoirs. Studies have shown that marine carbonate reservoirs contribute 85% of conventional natural gas resources in the Sichuan Basin, making them the major formations of natural gas production in the Sichuan Basin[7,8,9]. ...
Archie’s formula: Historical background and earlier debates
1
2007
... Carbonate reservoirs with karst vugs have very complicated conductivity mechanism, so it is difficult to establish the relationship between the resistivity and water saturation of the reservoir using the Archie formula. The Archie formula was proposed for clastic rocks in 1942[10] and must meet three conditions: (1) The spatial distribution of rock porosity is uniform. (2) The spatial distribution of fluid saturation in the rock is uniform too. (3) The rock is electrically isotropic. Clearly, the vug-type carbonate reservoir doesn’t meet any of the three conditions listed above, and the development of vugs inevitably makes the resistivity of the reservoir abnormal. Thus, directly describing the relationship between the resistivity and water saturation of vug-type reservoir using Archie's formula is difficult. Currently, a worldly accepted method detecting karst vugs makes use of the abnormal characteristics of resistivity of water-filled karst vugs[11,12,13,14,15,16,17,18,19,20]. ...
Determining a relationship between a newly forming sinkhole and a former dry stream using electric resistivity tomography and very low-frequency electromagnetic in an urban karst setting
1
2014
... Carbonate reservoirs with karst vugs have very complicated conductivity mechanism, so it is difficult to establish the relationship between the resistivity and water saturation of the reservoir using the Archie formula. The Archie formula was proposed for clastic rocks in 1942[10] and must meet three conditions: (1) The spatial distribution of rock porosity is uniform. (2) The spatial distribution of fluid saturation in the rock is uniform too. (3) The rock is electrically isotropic. Clearly, the vug-type carbonate reservoir doesn’t meet any of the three conditions listed above, and the development of vugs inevitably makes the resistivity of the reservoir abnormal. Thus, directly describing the relationship between the resistivity and water saturation of vug-type reservoir using Archie's formula is difficult. Currently, a worldly accepted method detecting karst vugs makes use of the abnormal characteristics of resistivity of water-filled karst vugs[11,12,13,14,15,16,17,18,19,20]. ...
... Carbonate reservoirs with karst vugs have very complicated conductivity mechanism, so it is difficult to establish the relationship between the resistivity and water saturation of the reservoir using the Archie formula. The Archie formula was proposed for clastic rocks in 1942[10] and must meet three conditions: (1) The spatial distribution of rock porosity is uniform. (2) The spatial distribution of fluid saturation in the rock is uniform too. (3) The rock is electrically isotropic. Clearly, the vug-type carbonate reservoir doesn’t meet any of the three conditions listed above, and the development of vugs inevitably makes the resistivity of the reservoir abnormal. Thus, directly describing the relationship between the resistivity and water saturation of vug-type reservoir using Archie's formula is difficult. Currently, a worldly accepted method detecting karst vugs makes use of the abnormal characteristics of resistivity of water-filled karst vugs[11,12,13,14,15,16,17,18,19,20]. ...
Detection of subsurface karstic features using electrical resistivity tomography, case study, Al Ain, United Arab Emirates
1
2015
... Carbonate reservoirs with karst vugs have very complicated conductivity mechanism, so it is difficult to establish the relationship between the resistivity and water saturation of the reservoir using the Archie formula. The Archie formula was proposed for clastic rocks in 1942[10] and must meet three conditions: (1) The spatial distribution of rock porosity is uniform. (2) The spatial distribution of fluid saturation in the rock is uniform too. (3) The rock is electrically isotropic. Clearly, the vug-type carbonate reservoir doesn’t meet any of the three conditions listed above, and the development of vugs inevitably makes the resistivity of the reservoir abnormal. Thus, directly describing the relationship between the resistivity and water saturation of vug-type reservoir using Archie's formula is difficult. Currently, a worldly accepted method detecting karst vugs makes use of the abnormal characteristics of resistivity of water-filled karst vugs[11,12,13,14,15,16,17,18,19,20]. ...
Geophysical characterization of gas hydrates
1
2010
... Carbonate reservoirs with karst vugs have very complicated conductivity mechanism, so it is difficult to establish the relationship between the resistivity and water saturation of the reservoir using the Archie formula. The Archie formula was proposed for clastic rocks in 1942[10] and must meet three conditions: (1) The spatial distribution of rock porosity is uniform. (2) The spatial distribution of fluid saturation in the rock is uniform too. (3) The rock is electrically isotropic. Clearly, the vug-type carbonate reservoir doesn’t meet any of the three conditions listed above, and the development of vugs inevitably makes the resistivity of the reservoir abnormal. Thus, directly describing the relationship between the resistivity and water saturation of vug-type reservoir using Archie's formula is difficult. Currently, a worldly accepted method detecting karst vugs makes use of the abnormal characteristics of resistivity of water-filled karst vugs[11,12,13,14,15,16,17,18,19,20]. ...
Secular oscillations of the geomagnetic field recorded by sediments deposited in caves in the mediterranean region
1
1976
... Carbonate reservoirs with karst vugs have very complicated conductivity mechanism, so it is difficult to establish the relationship between the resistivity and water saturation of the reservoir using the Archie formula. The Archie formula was proposed for clastic rocks in 1942[10] and must meet three conditions: (1) The spatial distribution of rock porosity is uniform. (2) The spatial distribution of fluid saturation in the rock is uniform too. (3) The rock is electrically isotropic. Clearly, the vug-type carbonate reservoir doesn’t meet any of the three conditions listed above, and the development of vugs inevitably makes the resistivity of the reservoir abnormal. Thus, directly describing the relationship between the resistivity and water saturation of vug-type reservoir using Archie's formula is difficult. Currently, a worldly accepted method detecting karst vugs makes use of the abnormal characteristics of resistivity of water-filled karst vugs[11,12,13,14,15,16,17,18,19,20]. ...
Seasonal thermal signatures of heat transfer by water exchange in an underground vault
1
2004
... Carbonate reservoirs with karst vugs have very complicated conductivity mechanism, so it is difficult to establish the relationship between the resistivity and water saturation of the reservoir using the Archie formula. The Archie formula was proposed for clastic rocks in 1942[10] and must meet three conditions: (1) The spatial distribution of rock porosity is uniform. (2) The spatial distribution of fluid saturation in the rock is uniform too. (3) The rock is electrically isotropic. Clearly, the vug-type carbonate reservoir doesn’t meet any of the three conditions listed above, and the development of vugs inevitably makes the resistivity of the reservoir abnormal. Thus, directly describing the relationship between the resistivity and water saturation of vug-type reservoir using Archie's formula is difficult. Currently, a worldly accepted method detecting karst vugs makes use of the abnormal characteristics of resistivity of water-filled karst vugs[11,12,13,14,15,16,17,18,19,20]. ...
Modification of stream potential by precipitation of calcite in a sand-water system: Laboratory measurements in the PH Range from 4-12
1
2006
... Carbonate reservoirs with karst vugs have very complicated conductivity mechanism, so it is difficult to establish the relationship between the resistivity and water saturation of the reservoir using the Archie formula. The Archie formula was proposed for clastic rocks in 1942[10] and must meet three conditions: (1) The spatial distribution of rock porosity is uniform. (2) The spatial distribution of fluid saturation in the rock is uniform too. (3) The rock is electrically isotropic. Clearly, the vug-type carbonate reservoir doesn’t meet any of the three conditions listed above, and the development of vugs inevitably makes the resistivity of the reservoir abnormal. Thus, directly describing the relationship between the resistivity and water saturation of vug-type reservoir using Archie's formula is difficult. Currently, a worldly accepted method detecting karst vugs makes use of the abnormal characteristics of resistivity of water-filled karst vugs[11,12,13,14,15,16,17,18,19,20]. ...
Back analysis of high density resistivity method in the water bearing karst cave
1
2016
... Carbonate reservoirs with karst vugs have very complicated conductivity mechanism, so it is difficult to establish the relationship between the resistivity and water saturation of the reservoir using the Archie formula. The Archie formula was proposed for clastic rocks in 1942[10] and must meet three conditions: (1) The spatial distribution of rock porosity is uniform. (2) The spatial distribution of fluid saturation in the rock is uniform too. (3) The rock is electrically isotropic. Clearly, the vug-type carbonate reservoir doesn’t meet any of the three conditions listed above, and the development of vugs inevitably makes the resistivity of the reservoir abnormal. Thus, directly describing the relationship between the resistivity and water saturation of vug-type reservoir using Archie's formula is difficult. Currently, a worldly accepted method detecting karst vugs makes use of the abnormal characteristics of resistivity of water-filled karst vugs[11,12,13,14,15,16,17,18,19,20]. ...
The case of detecting caves by french resistivity tomography and its enlightenment to China
1
2015
... Carbonate reservoirs with karst vugs have very complicated conductivity mechanism, so it is difficult to establish the relationship between the resistivity and water saturation of the reservoir using the Archie formula. The Archie formula was proposed for clastic rocks in 1942[10] and must meet three conditions: (1) The spatial distribution of rock porosity is uniform. (2) The spatial distribution of fluid saturation in the rock is uniform too. (3) The rock is electrically isotropic. Clearly, the vug-type carbonate reservoir doesn’t meet any of the three conditions listed above, and the development of vugs inevitably makes the resistivity of the reservoir abnormal. Thus, directly describing the relationship between the resistivity and water saturation of vug-type reservoir using Archie's formula is difficult. Currently, a worldly accepted method detecting karst vugs makes use of the abnormal characteristics of resistivity of water-filled karst vugs[11,12,13,14,15,16,17,18,19,20]. ...
The application of high density resistivity and tem method to underground karst detection
1
2012
... Carbonate reservoirs with karst vugs have very complicated conductivity mechanism, so it is difficult to establish the relationship between the resistivity and water saturation of the reservoir using the Archie formula. The Archie formula was proposed for clastic rocks in 1942[10] and must meet three conditions: (1) The spatial distribution of rock porosity is uniform. (2) The spatial distribution of fluid saturation in the rock is uniform too. (3) The rock is electrically isotropic. Clearly, the vug-type carbonate reservoir doesn’t meet any of the three conditions listed above, and the development of vugs inevitably makes the resistivity of the reservoir abnormal. Thus, directly describing the relationship between the resistivity and water saturation of vug-type reservoir using Archie's formula is difficult. Currently, a worldly accepted method detecting karst vugs makes use of the abnormal characteristics of resistivity of water-filled karst vugs[11,12,13,14,15,16,17,18,19,20]. ...
Application of microscope high resolution LWD resistivity image logging in carbonate reservoir in Sichuan Basin
1
2017
... On logging and core scales, the development of vug makes it very difficult for logging interpreters to work out the conductivity mechanism and oil and gas saturation of reservoirs. Although the resistivity of vuggy carbonate rocks has been studied at home and abroad[21,22,23,24], the quantitative study of reservoir resistivity based on the pore structure characteristics of vuggy reservoir rocks are few. Liu Xiangjun[25] and Xiong Jian[26] conducted core resistivity experiments and analyzed from porosity, permeability and parameters in Archie's formula, but did not consider the pore structure characteristics of the rock. Zhang Zhaohui[27] simulated the theoretical resitivity of vug-type reservoir by using the principle of resistance series-parallel conduction and reached the conclusions that the resistivity decreased rapidly with the increase of throat diameter and increased with the resistivity of matrix and formation water. The model used in the simulation was relatively simple and couldn’t reflect the influence of pore structure characteristics, such as pore size distribution and pore ratio, on the resistivity of the reservoir. In view of the above deficiencies, this paper extracts the pore structure characteristic parameters of vuggy carbonate reservoirs, calculates the matrix resistivity using percolation network simulation technology, and establishes a segmented cross-scale resistivity calculation method to obtain the cave porosity and water saturation’s relationship with reservoir resistivity. ...
A resistivity calibration method for fracture carbonate reservoirs
1
2013
... On logging and core scales, the development of vug makes it very difficult for logging interpreters to work out the conductivity mechanism and oil and gas saturation of reservoirs. Although the resistivity of vuggy carbonate rocks has been studied at home and abroad[21,22,23,24], the quantitative study of reservoir resistivity based on the pore structure characteristics of vuggy reservoir rocks are few. Liu Xiangjun[25] and Xiong Jian[26] conducted core resistivity experiments and analyzed from porosity, permeability and parameters in Archie's formula, but did not consider the pore structure characteristics of the rock. Zhang Zhaohui[27] simulated the theoretical resitivity of vug-type reservoir by using the principle of resistance series-parallel conduction and reached the conclusions that the resistivity decreased rapidly with the increase of throat diameter and increased with the resistivity of matrix and formation water. The model used in the simulation was relatively simple and couldn’t reflect the influence of pore structure characteristics, such as pore size distribution and pore ratio, on the resistivity of the reservoir. In view of the above deficiencies, this paper extracts the pore structure characteristic parameters of vuggy carbonate reservoirs, calculates the matrix resistivity using percolation network simulation technology, and establishes a segmented cross-scale resistivity calculation method to obtain the cave porosity and water saturation’s relationship with reservoir resistivity. ...
Integrated solution of LWD resistivity image logging in carbonate reservoir in Beibu Gulf, China
1
2010
... On logging and core scales, the development of vug makes it very difficult for logging interpreters to work out the conductivity mechanism and oil and gas saturation of reservoirs. Although the resistivity of vuggy carbonate rocks has been studied at home and abroad[21,22,23,24], the quantitative study of reservoir resistivity based on the pore structure characteristics of vuggy reservoir rocks are few. Liu Xiangjun[25] and Xiong Jian[26] conducted core resistivity experiments and analyzed from porosity, permeability and parameters in Archie's formula, but did not consider the pore structure characteristics of the rock. Zhang Zhaohui[27] simulated the theoretical resitivity of vug-type reservoir by using the principle of resistance series-parallel conduction and reached the conclusions that the resistivity decreased rapidly with the increase of throat diameter and increased with the resistivity of matrix and formation water. The model used in the simulation was relatively simple and couldn’t reflect the influence of pore structure characteristics, such as pore size distribution and pore ratio, on the resistivity of the reservoir. In view of the above deficiencies, this paper extracts the pore structure characteristic parameters of vuggy carbonate reservoirs, calculates the matrix resistivity using percolation network simulation technology, and establishes a segmented cross-scale resistivity calculation method to obtain the cave porosity and water saturation’s relationship with reservoir resistivity. ...
Application of micro-resistivity imaging in carbonate rock evaluation
1
2014
... On logging and core scales, the development of vug makes it very difficult for logging interpreters to work out the conductivity mechanism and oil and gas saturation of reservoirs. Although the resistivity of vuggy carbonate rocks has been studied at home and abroad[21,22,23,24], the quantitative study of reservoir resistivity based on the pore structure characteristics of vuggy reservoir rocks are few. Liu Xiangjun[25] and Xiong Jian[26] conducted core resistivity experiments and analyzed from porosity, permeability and parameters in Archie's formula, but did not consider the pore structure characteristics of the rock. Zhang Zhaohui[27] simulated the theoretical resitivity of vug-type reservoir by using the principle of resistance series-parallel conduction and reached the conclusions that the resistivity decreased rapidly with the increase of throat diameter and increased with the resistivity of matrix and formation water. The model used in the simulation was relatively simple and couldn’t reflect the influence of pore structure characteristics, such as pore size distribution and pore ratio, on the resistivity of the reservoir. In view of the above deficiencies, this paper extracts the pore structure characteristic parameters of vuggy carbonate reservoirs, calculates the matrix resistivity using percolation network simulation technology, and establishes a segmented cross-scale resistivity calculation method to obtain the cave porosity and water saturation’s relationship with reservoir resistivity. ...
Investigation on the scale effect of the rock-electricity parameters of fracture-cave carbonate
1
2017
... On logging and core scales, the development of vug makes it very difficult for logging interpreters to work out the conductivity mechanism and oil and gas saturation of reservoirs. Although the resistivity of vuggy carbonate rocks has been studied at home and abroad[21,22,23,24], the quantitative study of reservoir resistivity based on the pore structure characteristics of vuggy reservoir rocks are few. Liu Xiangjun[25] and Xiong Jian[26] conducted core resistivity experiments and analyzed from porosity, permeability and parameters in Archie's formula, but did not consider the pore structure characteristics of the rock. Zhang Zhaohui[27] simulated the theoretical resitivity of vug-type reservoir by using the principle of resistance series-parallel conduction and reached the conclusions that the resistivity decreased rapidly with the increase of throat diameter and increased with the resistivity of matrix and formation water. The model used in the simulation was relatively simple and couldn’t reflect the influence of pore structure characteristics, such as pore size distribution and pore ratio, on the resistivity of the reservoir. In view of the above deficiencies, this paper extracts the pore structure characteristic parameters of vuggy carbonate reservoirs, calculates the matrix resistivity using percolation network simulation technology, and establishes a segmented cross-scale resistivity calculation method to obtain the cave porosity and water saturation’s relationship with reservoir resistivity. ...
The influence of confining pressure on the cementation index m and the saturation index n of carbonate reservoir
1
2018
... On logging and core scales, the development of vug makes it very difficult for logging interpreters to work out the conductivity mechanism and oil and gas saturation of reservoirs. Although the resistivity of vuggy carbonate rocks has been studied at home and abroad[21,22,23,24], the quantitative study of reservoir resistivity based on the pore structure characteristics of vuggy reservoir rocks are few. Liu Xiangjun[25] and Xiong Jian[26] conducted core resistivity experiments and analyzed from porosity, permeability and parameters in Archie's formula, but did not consider the pore structure characteristics of the rock. Zhang Zhaohui[27] simulated the theoretical resitivity of vug-type reservoir by using the principle of resistance series-parallel conduction and reached the conclusions that the resistivity decreased rapidly with the increase of throat diameter and increased with the resistivity of matrix and formation water. The model used in the simulation was relatively simple and couldn’t reflect the influence of pore structure characteristics, such as pore size distribution and pore ratio, on the resistivity of the reservoir. In view of the above deficiencies, this paper extracts the pore structure characteristic parameters of vuggy carbonate reservoirs, calculates the matrix resistivity using percolation network simulation technology, and establishes a segmented cross-scale resistivity calculation method to obtain the cave porosity and water saturation’s relationship with reservoir resistivity. ...
Theoretical simulation and analysis factors of resistivity in vuggy reservoir
1
2014
... On logging and core scales, the development of vug makes it very difficult for logging interpreters to work out the conductivity mechanism and oil and gas saturation of reservoirs. Although the resistivity of vuggy carbonate rocks has been studied at home and abroad[21,22,23,24], the quantitative study of reservoir resistivity based on the pore structure characteristics of vuggy reservoir rocks are few. Liu Xiangjun[25] and Xiong Jian[26] conducted core resistivity experiments and analyzed from porosity, permeability and parameters in Archie's formula, but did not consider the pore structure characteristics of the rock. Zhang Zhaohui[27] simulated the theoretical resitivity of vug-type reservoir by using the principle of resistance series-parallel conduction and reached the conclusions that the resistivity decreased rapidly with the increase of throat diameter and increased with the resistivity of matrix and formation water. The model used in the simulation was relatively simple and couldn’t reflect the influence of pore structure characteristics, such as pore size distribution and pore ratio, on the resistivity of the reservoir. In view of the above deficiencies, this paper extracts the pore structure characteristic parameters of vuggy carbonate reservoirs, calculates the matrix resistivity using percolation network simulation technology, and establishes a segmented cross-scale resistivity calculation method to obtain the cave porosity and water saturation’s relationship with reservoir resistivity. ...
Percolation and conduction on the 3D voronoi and regular networks: A second case study in topological disorder
1
1984
... Jerauld[28] found that when the regular network with a certain structure and disordered network had the same connectivity, they had the same macroscopic flow and conduction properties. Therefore, only one network model that satisfies core porosity, pore size distribution frequency, and coordination number is needed to simulate reservoir resistivity. Wang Kewen[29] studied the transport characteristics of fluid and electric current by establishing a three-dimensional cube percolation network model, and compared their simulation results with real core experimental data, which proved that the percolation network model had similar micro characteristics and macro transport properties with the real core. Bernabé et al.[30,31] used both a two-dimensional and a three-dimensional percolation network model to study the permeability and conductivity of single-porous media. The single-porous medium percolation network model is a network model based on the establishment of a two-dimensional or three-dimensional equal-space grid, coupled with the average coordination number of percolation probability and satisfying the law of throat radius distribution. ...
Network model modeling of microcosmic remaining oil distribution after polymer flooding
1
2006
... Jerauld[28] found that when the regular network with a certain structure and disordered network had the same connectivity, they had the same macroscopic flow and conduction properties. Therefore, only one network model that satisfies core porosity, pore size distribution frequency, and coordination number is needed to simulate reservoir resistivity. Wang Kewen[29] studied the transport characteristics of fluid and electric current by establishing a three-dimensional cube percolation network model, and compared their simulation results with real core experimental data, which proved that the percolation network model had similar micro characteristics and macro transport properties with the real core. Bernabé et al.[30,31] used both a two-dimensional and a three-dimensional percolation network model to study the permeability and conductivity of single-porous media. The single-porous medium percolation network model is a network model based on the establishment of a two-dimensional or three-dimensional equal-space grid, coupled with the average coordination number of percolation probability and satisfying the law of throat radius distribution. ...
Permeability and pore connectivity: A new model based on network simulations
1
2010
... Jerauld[28] found that when the regular network with a certain structure and disordered network had the same connectivity, they had the same macroscopic flow and conduction properties. Therefore, only one network model that satisfies core porosity, pore size distribution frequency, and coordination number is needed to simulate reservoir resistivity. Wang Kewen[29] studied the transport characteristics of fluid and electric current by establishing a three-dimensional cube percolation network model, and compared their simulation results with real core experimental data, which proved that the percolation network model had similar micro characteristics and macro transport properties with the real core. Bernabé et al.[30,31] used both a two-dimensional and a three-dimensional percolation network model to study the permeability and conductivity of single-porous media. The single-porous medium percolation network model is a network model based on the establishment of a two-dimensional or three-dimensional equal-space grid, coupled with the average coordination number of percolation probability and satisfying the law of throat radius distribution. ...
Pore connectivity, permeability, and electrical formation factor: A new model and comparison to experimental data
1
2011
... Jerauld[28] found that when the regular network with a certain structure and disordered network had the same connectivity, they had the same macroscopic flow and conduction properties. Therefore, only one network model that satisfies core porosity, pore size distribution frequency, and coordination number is needed to simulate reservoir resistivity. Wang Kewen[29] studied the transport characteristics of fluid and electric current by establishing a three-dimensional cube percolation network model, and compared their simulation results with real core experimental data, which proved that the percolation network model had similar micro characteristics and macro transport properties with the real core. Bernabé et al.[30,31] used both a two-dimensional and a three-dimensional percolation network model to study the permeability and conductivity of single-porous media. The single-porous medium percolation network model is a network model based on the establishment of a two-dimensional or three-dimensional equal-space grid, coupled with the average coordination number of percolation probability and satisfying the law of throat radius distribution. ...
Effect of wettability on the petrophysical parameters of vuggy carbonates: Network modeling investigation
1
2004
... There are two proposed ideas for vuggy rocks: an embedded percolation network model and an equivalent dual- media percolation network model. The embedded percolation network model was proposed by Békri[32,33]. It is a percolation network model established by superimposing a small-scale pore throat network model on a large-scale pore network model. However, related research and popularization is limited due to the embedding of small-scale network models, the large number of nodes in this type of dual-medium network model, and the time consumption in simulation calculation. The equivalent dual-dielectric network model was proposed by Ahmadi[34], in which the matrix and pore throats in the model were split and then connected in parallel, so the resistivity of larger dissolved pores can be better reflected. ...
Pore network models to calculate transport and electrical properties of single or dual-porosity rocks
1
2005
... There are two proposed ideas for vuggy rocks: an embedded percolation network model and an equivalent dual- media percolation network model. The embedded percolation network model was proposed by Békri[32,33]. It is a percolation network model established by superimposing a small-scale pore throat network model on a large-scale pore network model. However, related research and popularization is limited due to the embedding of small-scale network models, the large number of nodes in this type of dual-medium network model, and the time consumption in simulation calculation. The equivalent dual-dielectric network model was proposed by Ahmadi[34], in which the matrix and pore throats in the model were split and then connected in parallel, so the resistivity of larger dissolved pores can be better reflected. ...
Dual pore network model of electrical resistivity for carbonate rocks
1
2014
... There are two proposed ideas for vuggy rocks: an embedded percolation network model and an equivalent dual- media percolation network model. The embedded percolation network model was proposed by Békri[32,33]. It is a percolation network model established by superimposing a small-scale pore throat network model on a large-scale pore network model. However, related research and popularization is limited due to the embedding of small-scale network models, the large number of nodes in this type of dual-medium network model, and the time consumption in simulation calculation. The equivalent dual-dielectric network model was proposed by Ahmadi[34], in which the matrix and pore throats in the model were split and then connected in parallel, so the resistivity of larger dissolved pores can be better reflected. ...
Pore connectivity, electrical conductivity, and partial water saturation: Network Simulations
1
2015
... In order to characterize the effect of vug on resistivity and give full play to the advantages of percolation network in characterizing single-porous media, the pore size distribution frequency was divided into two parts in this work. As shown in Fig. 1c, the part with pore size smaller than 1 mm on the left side of the red line was taken as the "basic unit", and the resistivity of the basic unit was calculated with the LBT method proposed by Li Min[35]. A mesh model fitting the actual pore size distribution on the right side of the red line with pores larger than 1 mm was generated by random algorithm (Fig. 2a). Basic cell was used to characterize vugs. For example, a vug 10 mm in diameter is equivalent to 10 "basic cells". The mesh model generated by taking the part with pores smaller than 0.1 mm as the "basic unit" is shown in Fig. 2b. Clearly, when the water saturation of the reservoir is 100%, the resistivity of the basic unit can be calculated by the LBT method, while the resistivity of the vugs is equal to the formation water resistivity. ...
Seismic physical of carbonate carven reservoirs
1
2016
... Compared with the relationship between vug porosity and resistivity, researchers pay more attention to the relationship between water saturation and resistivity[36,37,38]. Studies have shown that it is difficult to establish a correlation between resistivity and water saturation for vuggy reservoir. However, when vug resistivity and matrix resistivity are studied separately, the water saturation of the vug seems to have little effect on the resistivity of the study object. ...
Hydrocarbon distribution of Ordovician in carbonate vuggy reservoirs in Halahatang Area, Tarim Basin
1
2011
... Compared with the relationship between vug porosity and resistivity, researchers pay more attention to the relationship between water saturation and resistivity[36,37,38]. Studies have shown that it is difficult to establish a correlation between resistivity and water saturation for vuggy reservoir. However, when vug resistivity and matrix resistivity are studied separately, the water saturation of the vug seems to have little effect on the resistivity of the study object. ...
Nonlinear flow mechanism of the vuggy carbonate oil reservoirs in Middle East
1
2016
... Compared with the relationship between vug porosity and resistivity, researchers pay more attention to the relationship between water saturation and resistivity[36,37,38]. Studies have shown that it is difficult to establish a correlation between resistivity and water saturation for vuggy reservoir. However, when vug resistivity and matrix resistivity are studied separately, the water saturation of the vug seems to have little effect on the resistivity of the study object. ...
1
2007
... Similar conclusions were obtained from rock resistivity experiments. The sample No. 135 from the Cambrian Longwangmiao Formation in Well M203, Moxi Block, Anyue Gas Field, Sichuan Basin was used for rock resistivity experiment (Fig. 8a). It has a porosity of 11.41%, and was vacuumized and then saturated with brine 50 g/L in salinity under pressure. The resistivity of the brine was 0.14 Ω·m. The rock resistivity experiments were performed in accordance with current industry standard[39]. The experimental results show that when the vugs on the core surface are filled with salt water, the rock resistance value is 0.984 kΩ; when the vugs on the core surface have no salt water, the rock resistance value is 0.997 kΩ. It can be seen that the decrease of water saturation in the vugs has little effect on the resistivity. The resistivity curve of core sample with vugs is clearly divided into two straight line segments (Fig. 8b). The segment with smaller slope represents that the core water saturation change is mainly affected by the vug water saturation, indicating that the change of vug water saturation has a small effect on the system resistivity; the segment with larger slope represents that the core saturation change is mainly affected by the water saturation of the matrix pores, indicating that the resistivity is more sensitive to the change of water saturation in the matrix pores. If the effect of vugs on resistivity is ignored, the trend of most data points is in full compliance with the Archie formula. ...


