


Introduction
The Orinoco heavy oil belt in Venezuela has original geological reserves of 2000×108 t and recoverable reserves of up to 460×108 t[1]. The main target formations are fluvial-delta facies sandstone of Neogene and Paleogene. The oil reservoirs are at 100-1500 m depths and 5-100 m thick[1]. Some wells in the heavy oil belt produce a lot of water. The water producing layers are similar to the oil layers in lithology, physical properties and electrical properties, but differ widely in characteristics of microsphere resistivity log and deep lateral resistivity log from well test results. The tested oil layers have big differences between microsphere resistivity log and deep lateral resistivity log, indicating obvious mud invasion. The tested water layers have small differences between microsphere resistivity and deep lateral resistivity, and sometimes higher microsphere resistivity than deep lateral resistivity. The formation with high resistivity, small difference between microsphere and deep lateral resistivity and high water cut in the heavy oil belt is called flushed zone by petroleum specialists[2,3,4,5,6].
In 2007, by researching water analysis data of flushed zones in Sincor heavy oil belt, MARCOS J et al. proposed that the original formation water in this region had high salinity[7] due to meteoric precipitation. During the research of oil reservoir characteristics and development potential of Orinoco heavy oil belt in Venezuela, Hou Jun, et al. mentioned that the western and southern regions of the heavy oil belt were affected by fresh water invasion[8]. Chen Hui, et al. pointed out that the surface fresh water had some effect on the reservoir primary water[9]. Liu Yaming, et al. suggested that the early reservoir was damaged by the Andes orogenic movement from Late Cretaceous to Neogene, and a large amount of external water invaded into Orinoco heavy oil belt, hence the crude oil suffered biologic degradation, oxidation and thickening at different degrees[10].
However, based on above literature overview, there is insufficient direct evidence of the existence of surface fresh water and crude oil thickening in the oil reservoir, and the flushed zone isn’t defined clearly, and the logging response mechanism and formation process of the flushed zone remain murky. In order to know the quality of the resource on the flushed zones, to assist in the development of the heavy oil belt and accurate calculation of heavy oil belt resources, this paper preliminarily demonstrates the multi-stage flushed history, defines the flushed zone, and indicates the logging response mechanism and formation process of the flushed zone by analyzing the evidence of surface fresh water and crude oil densification existence.
1. Evidence of fresh water invasion into oil reservoir
Fig. 1 shows the comprehensive log curves of the formation testing sections in Well SDXX of the study area. The first test of 342.9-356.6 m lasted for 19 d, with the daily oil rate of 1.91 t and water cut of 0.1%; and the interval tested was confirmed an oil layer. The second test at 468.20-487.68 m lasted for 20 d with the water cut of 100%; and the tested section was confirmed a water layer. The third test of 521.2-533.4 m lasted for 16 d, with a daily oil rate of 0.64 t, and water cut of 99%; confirming the layer was a water layer too. Among the 3 tested intervals, the second has typical characteristics of flushed zone.
Fig. 1.
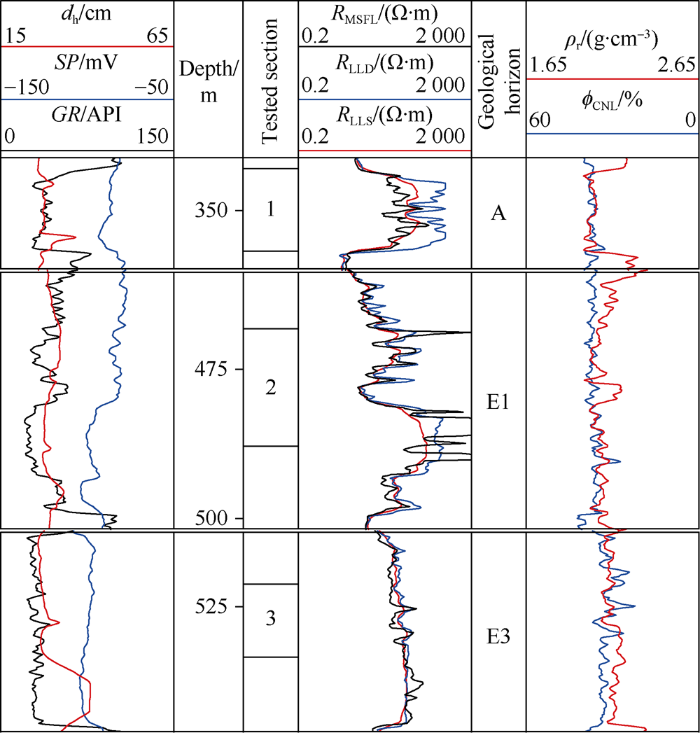
Fig. 1.
Comprehensive logs of Well SDXX.
In the sandstone-mudstone section, when Rw<Rmf, the spontaneous potential in mudstone is regarded as the baseline, and the sandstone section shows negative anomaly of spontaneous potential. When Rw>Rmf, the sandstone section shows positive anomaly of spontaneous potential. The general range of formation water salinity can be worked out by using spontaneous potential curve and the salinity of drilling fluid.
Fig. 2a shows the positive anomaly of spontaneous potential of Well 1E, which indicates that the formation water near the well has salinity lower than that of the drilling fluid. Table 1 shows that in the target section of the well, the drilling fluid has a resistivity of 1.13 Ω·m and salinity of 5000 mg/L, which means that the formation water near the well has a salinity of less than 5000 mg/L. Fig. 2b shows negative anomaly of spontaneous potential of Well 6E, which indicates that the formation water near the well has salinity higher than that of the drilling fluid. Table 1 shows that in the target section of the well, the drilling fluid has a resistivity of 0.48 Ω·m and salinity of 14 000 mg/L, which implies that the formation water near the well has a salinity higher than 14 000 mg/L.
Fig. 2.
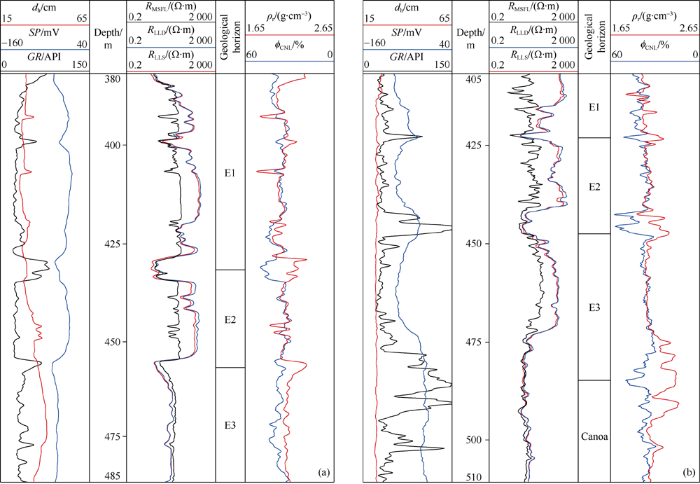
Fig. 2.
Composite logs of Well 1E (a) and well 6E (b).
Table 1 Statistics on drilling fluid properties in flushed zones of some wells in the heavy oil belt[11].
| Well | Temp./°C | Rm/(Ω·m) | Rmf/(Ω·m) | Pwe/(mg·L-1) |
|---|---|---|---|---|
| 1E | 26.7 | 1.36 | 1.13 | 5 000 |
| 2E | 31.1 | 2.15 | 1.21 | 4 900 |
| 3E | 22.8 | 0.50 | 0.6 | 12 000 |
| 4E | 23.8 | 0.70 | 0.95 | 10 000 |
| 6E | 24.4 | 0.48 | 0.39 | 14 000 |
Fig. 3 shows the water production rates of flushed zones in some wells of the heavy oil belt. The water samples from the four blocks in the Fig. 3 have a salinity range of 2956.6-34 845.5 mg/L. It can be seen from the above analysis that there are two kinds of formation water with different salinities in the heavy oil belt reservoir in the study area.
Fig. 3.
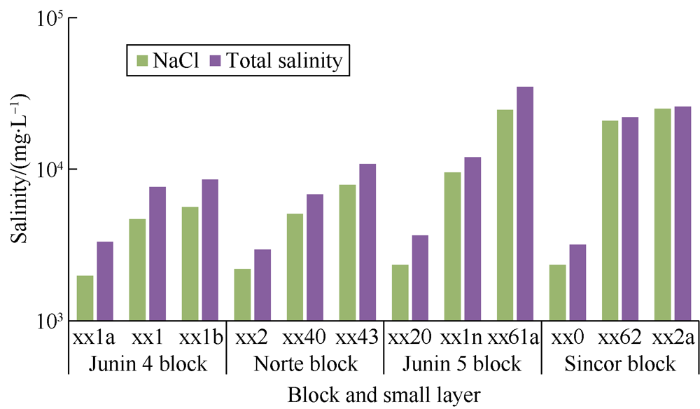
Fig. 3.
Analysis data of formation water in flushed zones.
The buried depth of the heavy oil belt reservoir is shallow, only about 100 m at minimum. Besides, Orinoco river, the third largest river in terms of flow rate in the world, and its tributaries flow through Junin in the heavy oil belt, providing abundant water for the invasion of surface fresh water. Furthermore, MARCOS J et al. argued that the salinity of the original formation water in the area adjacent to the study area was higher than 10 000 mg/L[7]. Based on the above analysis, it can be seen that there is indeed fresh water invasion in the flushed zone reservoir.
2. Surface fresh water reformation to the reservoir
The reformation of oil reservoir by surface fresh water includes two parts: the reformations to rock matrix and rock- bearing fluid. The reformation of rock matrix mainly includes the reformation to pore structure and pore throat size. The reformation to rock-bearing fluid mainly involves the changes of humidity, composition and pressure of gas, viscosity and composition of oil and salinity and mineral composition of formation water.
2.1. Reformation to rock matrix by surface fresh water
Anisotropic oil reservoirs can be divided into sedimentary anisotropic oil reservoirs and fractured anisotropic oil reservoirs. Sedimentary anisotropic oil reservoirs can be subdivided into interlayer anisotropic and intralayer anisotropic ones. The interlayer anisotropy refers to heterogeneity between different thin layers, which would cause reduction of permeability in vertical direction, and make the vertical permeability lower the horizontal permeability. However, the core data analysis of well ZZ2 in the study area shows that the vertical permeability of formation is close to the horizontal permeability. Fig. 4 shows the comprehensive logs and core analysis of Well ZZ2. The fourth track in the figure shows the formation permeability, and KCOR refers to permeability from core analysis. ϕCOR in the fifth track refers to porosity from core analysis. The porosity and permeability from core analysis match well with those from logs, which indicates that the core-log depth matching in core analysis was accurate. KH/V in the sixth track refers to the ratio of horizontal permeability to vertical permeability from core analysis.
Fig. 4.
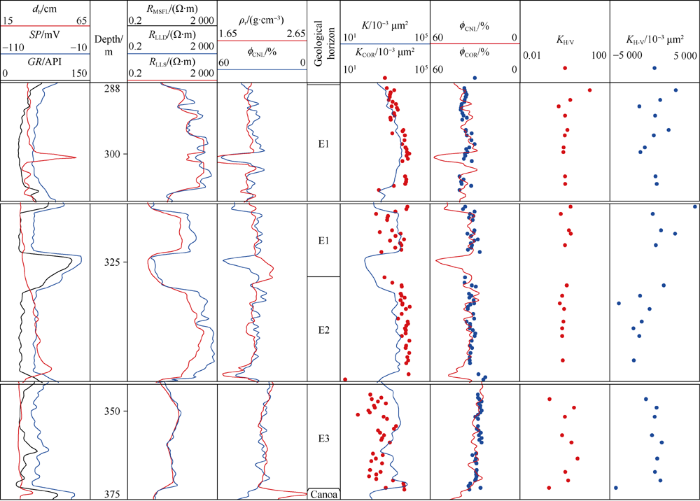
Fig. 4.
Comprehensive logs with core analysis data of Well ZZ2.
The ratio of vertical permeability to horizontal permeability from core analysis of the formation is about 1, which indicates that there is little difference between the vertical permeability and horizontal permeability. KH-V in the seventh track refers to the difference between horizontal permeability and vertical permeability from core analysis. The vertical permeability and horizontal permeability of the formation in the study area are equivalent. It is inferred from the analysis that the main reason causing this phenomenon is the leaching and erosion by surface fresh water. When getting into the oil reservoir, the surface fresh water mainly diffuses outward and flows downward along the entry. In this process, the small pore throats in the vertical direction are reformed, the vertical permeability of the formation increases, and the anisotropy between layers decreases gradually[12].
2.2. Reformation to reservoir fluid by surface fresh water
The reformation of surface fresh water to reservoir fluid in the study area mainly shows in the changes of crude oil components, and involves escape of light oil and gas and crude oil thickening caused by external water[13].
The viscosity of crude oil refers to the ratio of shear stress per unit area to velocity gradient at any point in crude oil. The viscosity of crude oil indicates the difficulty degree of crude oil flowing, which is an important index indicating crude oil thickening. Based on experiment, Vinegar concluded that the horizontal relaxation time T2 had a good correlation with the crude oil viscosity η. The empirical relationship is:
${{T}_{2}}=\frac{{{C}_{1}}{{T}_{\text{K}}}}{298\eta }$
Fig. 5 shows the comprehensive logs and core analysis results of Well XXV. The η curve in the sixth track is the formation fluid viscosity calculated based on nuclear magnetic measurement results. The curve R5000 shows the measured resistivity of core after full saturated with 5000 mg/L NaCl solution. The core didn’t have oil washing and other treatments before saturated with NaCl. The eighth track is the T2 spectrum of NMR logging. Although the data points on R5000 in the sixth track are few, the overall distribution of data points is highly consistent with the viscosity calculated by NMR.
Fig. 5.
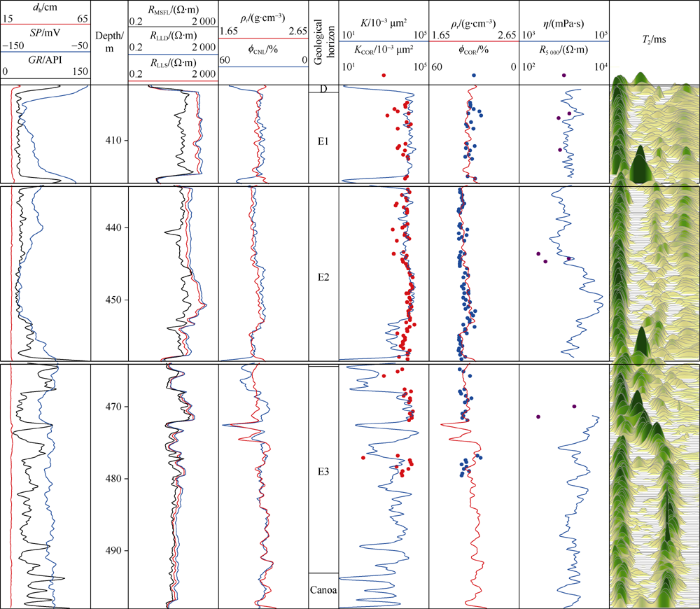
Fig. 5.
Comprehensive logs with core analysis data of Well XXV.
The oil in the study area was in “foamy” state before surface water invading into the reservoir. This was observed in the 1960s. Smith et al. [2] firstly used "multiphase flow" and "mixed flow" to describe the phenomenon that the heavy oil containing tiny bubbles flow with it. The term "foamy oil" was firstly introduced by Sarma et al. [3] In 1999, Sheng et al. investigated the displacement mechanism of foamy oil by gas[4]. In 2012, Wu Yongbin et al. quantitatively described factors affecting the stability of foamy oil by experiments and proposed that the reservoirs with foamy oil were not suitable for thermal recovery in early period[5,6]. When the core is taken from well bottom to the ground, the surrounding pressure on the core decreases, and the gas phase and light oil begin to escape as soon as the surrounding pressure drops below the bubble-point pressure, resulting the increase of crude oil viscosity and the core resistivity, and the foamy oil changes to oil and gas two phases. In the sixth track of Fig. 5, the resistivity of core saturated with NaCl solution is consistent with the viscosity calculated by NMR, which indicates that the viscosity calculated by NMR has high accuracy[14].
From the chemical element composition of asphalt, the carbon content of oil residue asphalt is higher than 85% and the carbon content of coal tar asphalt is higher than 92%. The density of asphalt is slightly higher than that of water. The density of coal tar asphalt is 1.15-1.25 g/cm³. Therefore, compared with conventional oil and gas, at the same lithology, physical properties and oil saturation of the formation, neutron log readings decrease and the density log does not change much in extra-heavy oil and asphalt layers. In Fig. 5, the density log at the interval of 450-458 m has little change, but the values of compensated neutron log obviously decrease exactly due to the increase of crude oil viscosity. Based on the log response and the viscosity calculated by NMR, the viscosity of oil in this section increases significantly, indicating that the crude oil in the oil reservoir has thickened.
As the surface fresh water gets into the oil reservoir, the large number of microorganisms it carries would degrade the crude oil, and the biodegradation would make the content of saturated hydrocarbon reduce, the contents of asphaltene, non-hydrocarbon and aromatic hydrocarbon increase, and the density and viscosity of crude oil increase. During biodegradation, n-alkanes are degraded first, then branched alkanes are consumed, and cyclic hydrocarbons are generally stable[13]. Fig. 6 shows composition analysis data of crude oil samples from different regions. The results shows that the components of crude oil in different wells of Junin block of Venezuela are quite different. The components of crude oil in Well HN11X and HNCUPBJ are close to the components of extra-heavy oil in China, with high content of saturated hydrocarbon, relatively higher content of aromatic hydrocarbon, and the lowest content of asphaltene. Compared with Well HN11X and HNCUPBJ, the components of crude oil in Well HN2X, HN9X, HN16X and HN8X have higher content of aromatics and resin, less asphaltene and saturated hydrocarbon, hence the crude oil in these four wells should be biodegraded crude oil.
Fig. 6.
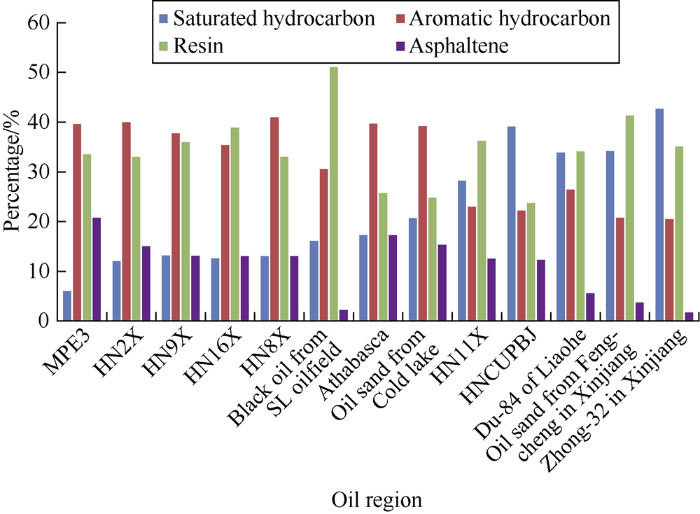
Fig. 6.
Histogram of components of heavy crude oil samples from different oilfields in China and abroad.
The heavy oil belt in the study area is located at the highest edge of the slope belt in the south of the east Venezuela basin. The oil and gas from the north of the basin accumulate in the Upper Cretaceous—Miocene river-delta facies unconsolidated sandstone at the edge of the basin in large scale, after long distance lateral migration of tens kilometers[8]. The structure of the target layer in the study area is lower in the north and higher in the south. The relative density of crude oil on the heavy oil belt is roughly the same from east to west. From north to south, the relative density of crude oil gradually increases from higher than 0.934 in the north to 1.029 in the south of JUNIN, and the viscosity of crude oil increases from 2000 mPa·s to more than 5000 mPa·s[1]. From the view of crude oil migration, light crude oil with small molecules and stronger diffusion ability is more likely to migrate long distance. However, the viscosity of oil in the study area is higher than that of oil in the south area which is more close to the oil source, which confirms that the crude oil in the study area has thickened.
3. Formation of flushed zone
After the surface fresh water flows along outcrops or faults into reservoir, the crude oil in the reservoir would thicken. The formation with extra-heavy oil is called the flushed zone. Flushed zones usually produce a lot of water, but not all flushed zones have free water. Flushed zones often exist in foamy oil reservoirs, which have log responses similar to ordinary heavy oil reservoirs except microspherically focused log.
3.1. Classification and log responses of flushed zones
The microspherically focused resistivity log reflects the resistivity of flushed zone, and deep lateral resistivity log reflects the original formation resisitivty. The circular belt around the hole formed after the movable fluid in the formation is totally displaced by drilling fluid is called the flushed zone. The resistivity difference between the flushed zone and the original formation can be small in two possible situations: the drilling fluid has the same resistivity with the formation, or there is no drilling fluid invasion. The resistivity of drilling fluid is 1.39 Ω·m at 26.7 °C in Well 14PV. The upper oil layer shows obvious invasion characteristic of resistivity drop, and the flushed zone adjacent to the oil layer has little possibility to show the equal resistivity invasion characteristic. Besides, the formation resistivity changes greatly, while the shape of microsphere resistivity is similar to that of the undisturbed formation, which shows that the log characteristics of the target layer isn’t closely related to the invasion of drilling fluid. Table 1 shows that the drilling fluids used in the study area change greatly in salinity. For example, drilling fluids used in Well 1E and 6E have an equivalent NaCl salinity of 5 000 mg/L and 14 000 mg/L respectively. But the interval 434.0-449.6 m in Fig. 2a and the interval 480.0-495.3 m in Fig. 2b show that the microsphere resistivity and deep lateral resistivity have similar shapes and similar reading values. Based on the above three points, it can be concluded that the special logging response of the flushed zone in the study area has little relationship with the drilling fluid, and should be caused by the formation fluid.
The special logging response of the flushed zone in the study area is caused by asphalt membrane. The results of core wettability analysis show that the reservoir rocks in this area are oil-wet and intermediate-wet. In the oil-water coexistence formation, the crude oil and the formation are in full contact. When the surface fresh water gets into the oil reservoir, the large amount of oxygen and bacteria it carries would cause thickening of oil, finally, forming asphalt membrane. The membrane prevents the drilling fluid from invading into the formation, resulting in similar microsphere resistivity and deep lateral resistivity.
From the logging responses, the flushed zones can be divided into two types: (1) The flushed zone with high resistivity: this kind of flushed zone has little difference in resistivity from oil layer, and slightly smaller spontaneous potential abnormality than oil layer, so it is difficult to distinguish this kind of flushed zone from oil layer only by resistivity, for example, the 478.5-513.5 m interval in Fig. 7. The flushed zone with high resistivity has very high oil saturation, and some flushed zones with high resistivity have no free water. However, due to the very high viscosity, the crude oil is hard to flow, resulting in high water cut in production. (2) The flushed zone with low resistivity: this kind of flushed zone has much lower resistivity reading than the oil layer, microsphere resistivity similar with deep lateral resistivity, and smaller spontaneous potential abnormality than oil layer; for example, the interval of 518.2-554.7 m in Fig. 7, the flushed zone with lower resistivity obviously contains water.
Fig. 7.

Fig. 7.
Comprehensive logs of Well 14PV.
In the formation model, the resistivity is the result of parallel connection of formation matrix resistivity and fluid resistivity. In the flushed zone, the formation water is wrapped up by asphalt membrane. In the conventional parallel branches, the formation water branch changes into a series-connect branch composed of asphalt, water and asphalt. The flushed zone with high resistivity contains little water or doesn’t contain free water, the existence of asphalt membrane weakens the water signal of the electric logging curve. For example, the interval of 493.8-513.6 m of Well 14PV in Fig. 7, NMR T2 spectrum indicates the formation contains water, but the deep lateral resistivity reading is still high. In the flushed zone with low resistivity, for example the interval of 521.2-548.6 m in Fig. 7, most of the pore space is filled with water, but the small pore throats are still blocked by membrane, thus, a large continuous water bearing space surrounded by the membrane with high resistivity is formed, which shows lower resistivity readings than the oil layer.
3.2. Formation of the flushed zone
The extra-heavy oil of Orinoco heavy oil belt exists mainly in the form of foamy oil flow, which is a special fluid flow form in solution-gas drive oil reservoir. With the damage of sealing of the oil reservoir, the foamy oil flows out of the channel, and the surface fresh water invades into the reservoir. The invasion of surface fresh water brings a lot of oxygen and bacteria, which provides proper conditions for crude oil thickening. Affected by surface fresh water, the remaining oil gradually increases in viscosity, until the asphalt membrane is formed to wrap up the free water, and consequently, the low resistivity flushed zone comes up at the low part of the oil reservoir.
With the external water continually getting into the oil reservoir, when the formation pressure drops to near the bubble point, the original homogeneous fluid containing dissolved gas in a oversaturated state would go through over-saturated foamy oil flow, forming, migration and combination of bubbles and eventually form a continuous gas phase[15,16,17]. After the gas phase and some light oil escape along the channels, the remaining crude oil would have high viscosity and weak mobility, and finally stay in the oil reservoir to form the flushed zone with high resistivity[18,19,20,21,22].
3.3. Flush by surface water invading along fault
With the surface fresh water flowing into the formation along the channel, the ions in the surface fresh water mix and exchange with ions in the original formation water with high salinity. The mixed water would have smaller salinity than the original formation water. The closer to the water source, the lower the salinity of the mixed water is; the further away from the water source, the higher the salinity of the mixed water is.
Table 2 shows drilling fluid information of all wells with positive spontaneous potential abnormality in the study area. Based on the abnormal situation of spontaneous potential and the relationship between salinity of drilling fluid and salinity of formation water, it can be seen that all the wells have formation water equivalent NaCl salinity of less than 5300 mg/L, indicating that the formation is flushed and the formation water has been changed by the fresh water. Fig. 8 shows the diagram of thickness of flushed zones in Junin zone 4 and nearby zones. The wells with names in blue all have positive anomaly of spontaneous potential. So far, all wells with positive anomaly of spontaneous potential and drilling fluid resistivity have equivalent NaCl salinity of formation water of less than 5300 mg/L (Table 2), indicating that the formation in this area is seriously flushed. Moreover, these wells are all near faults, suggesting that the water source is closely related to the fault.
Table 2 Properties of drilling fluid in some wells with positive anomaly of spontaneous potential.
| Well | Temp./°C | Rm/(Ω·m) | Rmf/(Ω·m) | Pwe/(mg·L-1) |
|---|---|---|---|---|
| 1E | 26.7 | 1.36 | 1.13 | 5 000 |
| 2E | 31.1 | 2.15 | 1.21 | 4 900 |
| 10PV | 23.9 | 1.39 | 1.24 | 5 100 |
| 14PV | 26.7 | 1.56 | 1.39 | 4 300 |
| 23PV | 20.0 | 1.22 | 1.1 | 5 300 |
Fig. 8.
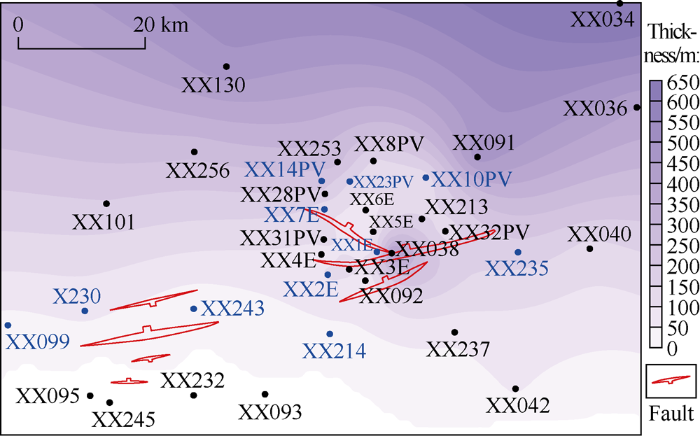
Fig. 8.
Thickness of flushed zones in Junin 4 block and nearby blocks.
The target layer in the area shown in Fig. 8 is higher in the south and lower in the north on the whole. The two regions with concentrated faults in Fig. 8 are called the eastern and western parts respectively. In the west part, the distribution of the flushed zones is closely related to the geometry and distribution of the faults. From the fault to the north, the flushed zone gradually increases in thickness. The thickness contour of the flushed zone is basically consistent with the strike of the fault. The target layer in this area is higher in elevation in the south and lower in the north in general, so the external water seeping down along the fault would flow to the north. The faults are important migration channels of water in flushed zone. However, in the east part, only the northernmost fault is related to the distribution of flushed zones nearby, and the distribution relationship between other faults and flushed zone is not clear. Besides, Well XX042 is in the high position of the structure and its position is higher than all the faults, but it also has a flushed zone found. This suggests there may be other surface water invasion channels besides the faults shown in this figure.
3.4. Multistage flush history of flushed zones
Fig. 9 shows the comprehensive logs of Well 2E. Based on the formation water information in Table 2 and positive anomaly of spontaneous potential of the section in Fig. 9, it is concluded that external water invaded the formation. But in this interval, the microsphere resistivity log has obvious difference from the deep resistivity log; NMR log displays stronger light oil signals and no obvious water signal. This implies that the reservoir sealing performance is not damaged after the oil reservoir accumulated. It is inferred that the flush should be earlier than the oil reservoir accumulation. All wells in Table 2 can come to this conclusion.
Fig. 9.
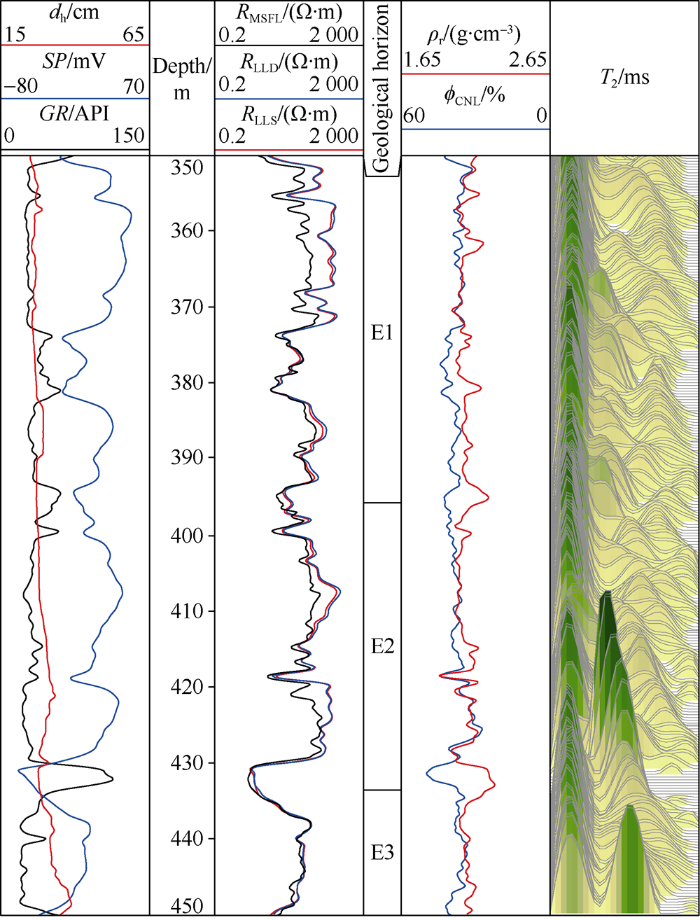
Fig. 9.
Comprehensive logs of Well 2E.
Based on the above analysis, we concluded that the flushed zone in the study area is formed due to fresh water entering into the oil reservoir after reservoir accumulation. Therefore, the oil reservoir in the study area is flushed by external water before and after reservoir accumulation.
4. Conclusions
There are flushed zones developed in the heavy oil belt in the study area. The main water source of the flushed zone is surface fresh water. The surface fresh water gets into the oil reservoir through outcrops or faults, triggering crude oil thickening. The flushed zones can be divided into two types, those with high resistivity and those with low resistivity. The flushed zone with high resistivity is rich in oil with high viscosity hard to flow, resulting high water cut in production. The flushed zone with low resistivity obviously contains free water. The surface water flushing in the study area has the characteristics of multi-stages and multi-sources. The surface fresh water flushed the formation before reservoir accumulation. After reservoir accumulation, the reservoir was flushed by fresh water too, thus the flushed zone is formed after reservoir accumulation.
Nomenclature
C1—empirical constant, related to free oxygen in crude oil, dimensionless;
dh—well diameter, cm;
K—calculated permeability, 10-3 μm2;
KCOR—permeability from core analysis, 10-3 μm2;
KH/V—ratio of horizontal permeability to vertical permeability from core analysis, dimensionless;
KH-V curve represents the difference between horizontal permeability and vertical permeability from core analysis, 10-3 μm2;
GR—natural gamma ray, API;
Pwe—equivalent NaCl salinity of formation water, from NaCl solution resistivity and the salt content and temperature conversion diagram[11], mg/L;
R5000—resistivity of core saturated with 5000 mg/L NaCl solution, Ω·m;
RLLD—deep lateral resistivity, Ω·m;
RLLS—shallow lateral resistivity, Ω·m;
Rm—mud filtrate resistivity, Ω·m;
Rmf—drilling fluid resistivity, Ω·m;
RMSFL—microsphere resistivity, Ω·m;
Rw—formation water resistivity, Ω·m;
SP—spontaneous potential, mV;
T2—transverse relaxation time in NMR, ms;
TK—Kelvin absolute temperature, K;
ρr—compensation density, g/cm-3;
ϕCOR—porosity from core analysis, %;
ϕCNL—porosity from compensated neutron log, %;
η—crude oil viscosity, mPa·s.
Reference
Development status and characteristics of Orinoco heavy oil belt in Venezuela
Fluid flow and sand production in heavy-oil reservoirs under solution-gas drive
Role of solution gas in primary production of heavy oils
Critical review of foamy oil flow
Experimental study on main controlling factors of foam oil stability
Quantitative evaluation of factors affecting foam oil recovery in heavy oil reservoirs
Static and dynamic models of formation water in Sincor Area, Orinoco Belt, Venezuela
Characteristics and development potential of Orinoco heavy oil belt reservoir in Venezuela
Evaluation of saturation of fresh water flushed overweight oil reservoir in Orinoco heavy oil belt in Venezuela
Characteristics of heavy oil accumulation in Orinoco heavy oil belt
Determination of anisotropic permeability and software research
Densification mechanism and classification development of crude oil in the Fourth Member of Sand Area in Kenxi
Research progress in domestic and foreign of foam oil
Experimental study on enhanced oil recovery by transfer of super heavy oil after gas flooding
Research progress on foam oil formation process and its influencing factors
Genetic mechanism, reservoir evaluation and accumulation law of deep heavy oil in Jiyang Depression
Sedimentary evolution characteristics of the Morichal section of the Carbobo oilfield M block in the Orinoco heavy oil belt, Venezuela
Rheological characterization of foamy oils under pressure
Factors affecting foam oil flow
Study on identification of heavy oil reservoir by 2D NMR logging
