


Introduction
The Fengcheng oilfield is located in the north end of the northwestern fringe of the Junggar Basin. It is bordered by the Hala’alat mountain to the north, the Xiazijie area to the east and the Wuerhe town to the west. It has an altitude range from 280 to 503 m and average altitude of 380 m. In this oilfield, Jurassic ultra-heavy oil geological reserves amount up to 3.7×10⁸ t. Ultra-heavy oil is defined as the crude oil with a degassed viscosity of over 5×10⁴ mPa•s under the reservoir temperature[1]. The Fengcheng ultra-heavy oil has an in-situ viscosity of 3.5×10⁶ mPa•s and a degassed viscosity of 9495-49 320 mPa•s at 50 °C on the ground surface[2]. With high density, high viscosity, high contents of silica gel, asphaltene and paraffin, this kind of oil must be produced by thermal recovery[2,3]. Currently, steam-assisted gravity drainage (shortened as SAGD) is the main development means for the Fengcheng ultra-heavy oil reservoirs. SAGD development consists of two stages: preheating and production. During the preheating step, steam is injected to both wells above and below (abbreviated as I well and P well) to heat the crude oil around the boreholes (4-5 m from the borehole) through thermal conduction and convection to make the oil mobile. In this stage, the hydraulic and thermal connection can be established between the two wells in a SAGD well pair. This process usually lasts for several months to a year. After the two wells are fully connected, the production stage initiates, during this period steam is injected in the I well while oil is produced from the P well continuously. The crude oil around the borehole after heated flows along the direction parallel to the fringe of the steam chamber in an upside-down water droplet shape to the production well under the joint effect of steam pressure and gravity. This process continues over the entire production life, lasting from several to tens of years[4,5,6].
The ultra-heavy oil reservoirs in Fengcheng oilfield have high mud content, multiple interlayers, relatively low permeability, and high crude oil viscosity, all these factors make the SAGD preheating stage long and large in steam consumption, the processing of produced fluid has high environment pressure and long gas breakthrough cycle problems, limiting the effects of preheating and production[3, 7-9]. Micro-fracturing before steam preheating can form microfractures around the wells and establish hydraulic and thermal communication between them to save steam injection cost, reduce produced water, lower the impact on environment, and enhance the daily oil production in early SAGD stage[10,11,12]. The micro-fracturing includes injecting 20-70 °C produced water (from previous SAGD stage) to the wells during the stage for pressure control and displacement control to create a dilated zone around them. This technology can not only improve the porosity and permeability near the borehole, establish a good connection between the wells and subsequently decrease the preheating cycle, but also dramatically enhance the efficiency of heat transfer and improve the effectiveness of the subsequent steam circulation by the heat transfer method of condensate convection[11,12]. Besides, the widespread interlayers with low permeability would hinder the development of the steam chamber and the oil above the interlayers flowing down to the borehole, therefore, hydraulic fracturing is needed to create flow channels through the mud interlayers to enhance the SAGD efficiency and the ultimate recovery ratio. Hence, it is necessary to understand the microfracture growth regularities when fracturing in the reservoir and the interlayer during this process. Some researchers investigated the fracture initiation and propagation mechanisms inside unconsolidated sandstone samples through virtual or true triaxial injection experiments[13,14,15,16,17,18,19,20]. However, these experiments were carried out on pure sand samples and didn’t consider the effect of viscous cementing agents such as heavy oil in the pore space. Yuan et al.[11] and Lin et al.[21] suggested that the hydraulic fracturing not only created microfractures around the borehole but also generated an elliptical dilated zone perpendicular to the azimuth of the minimum horizontal principal stress. Saeedi et al.[22] proposed to run in a tail pipe in the SAGD openhole and then conduct multi-stage hydraulic fracturing with sand to break the mudstone interlayers and create vertical fractures. They later used the extended Renshaw and Pollard principle[23] to illustrate the transverse extension of fractures through the mudstone-sand interface, proving the feasibility of such approach. However, no lab experiments or field cases verify that approach yet. In addition, fracturing in unconsolidated sandstone formation often results in short and wide cracks, accompanied by wellbore enlargement in reservoirs with low permeability[14-15, 20], or causes fracturing fluid to leak off and generates a homogeneous dilated zone around the borehole when the reservoir is high in permeability[7, 14-17]. Therefore, whether the hydraulic fracture initiated in the soft and plastic formation can break through the brittle mudstone interlayer far from the wellbore remains debatable.
In this study, based on the rock mechanics and porosity-permeability characteristics of the ultra-heavy oil reservoir and interlayer in Fengcheng oilfield, true triaxial and computer tomography (CT) tests were conducted to find out the microfracture and macro-fracture propagation mechanisms in the reservoir-interlayer interbeds. The tests considered the impact of injection rate, viscosity of the fracturing fluid, perforation density, and the location of fracture initiation.
1. Geological and engineering background
For a uniform ultra-heavy oil reservoir with few interlayers, micro-fracturing before preheating can create a homogeneous dilated zone and evenly distributed micro-scale fractures around the I and P wellbores through adjusting injection rate and wellhead pressure (Fig. 1). The resulting hydraulic and thermal communication can shorten the preheating period by more than 60%. However, if the microfractures join together into macrofractures that ultimately connect the I and P wells, steam channeling may emerge during the later stage of SAGD. Under the constraint of in-situ stress field and petrophysical features of the reservoir, the mechanisms that drive the initiation, propagation, and accumulation of microfractures to form millimeter-scale macrofractures remain unclear. This is especially true for the poor heavy oil reservoir with high mud content. Therefore, it is urgent to understand the generation mechanism and pressure propagation regularities of microfractures, to guide accurate crack control in the field, eliminate steam channeling risk, and increase the ultimate productivity as well as recovery ratio.
Fig. 1.
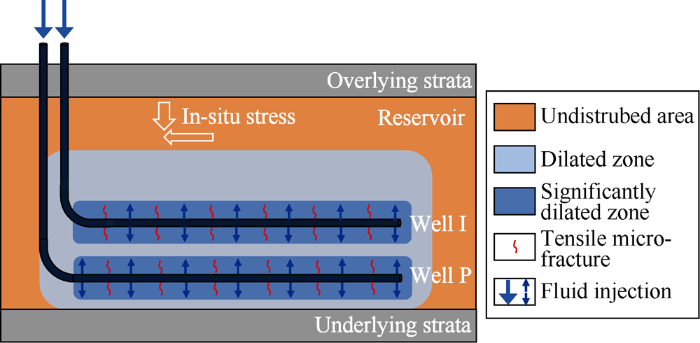
Fig. 1.
Sketch of micro-fracturing in an ultra-heavy oil reservoir[24].
The interlayers in ultra-heavy oil reservoirs feature large thickness (usually 0.5-3.0 m), complex distribution pattern, large distribution range, and low permeability. They exert significant influences on the steam chamber growth, cumulative production, and ultimate recovery of SAGD[22,23,24,25,26,27]. Meanwhile, the interlayers also inhibit the rise of the steam and the flow of condensed steam and heated oil, leading to an unevenly developed steam chamber. Thick interlayers between the I and P wells in a well pair would make the steam injection period longer and the hydraulic and thermal connection between the two wells difficult to build. When there are interlayers between a well pair, it is necessary to find out if micro-fracturing in the reservoir can break the interlayers in the reservoir indirectly to form local flow channels in the interlayers. When the interlayer exists above a well pair, the steam chamber is not able to reach the reservoir above the interlayer, leaving the ultra-heavy oil in this part unrecoverable. The interlayers also block the heat convection of other thermal recovery techniques, making the crude oil outside the reach of the convective heat flux unable to be recovered. If packers are set in the interlayer section inside a cased vertical well (for example a prospecting or testing well) to assist hydraulic fracturing in the horizontal SAGD well pair (Fig. 2), flow channels throughout the interlayers can be generated to dramatically improve the permeability of the reservoir, oil production rate, degree of recovery and cumulative production. Therefore, it is of scientific guiding significance for interlayer stimulation to understand the fracturing propagation mechanisms in the interlayer.
Fig. 2.
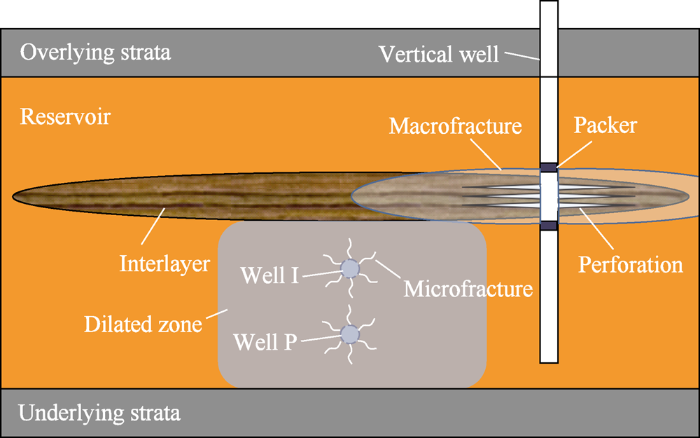
Fig. 2.
Schematic diagram of vertical well-assisted fracturing stimulation of a SAGD wellpair.
The interlayers in Fengcheng ultra-heavy oil reservoirs can be divided into two types: muddy interlayer and mudstone interlayer. Their differences lie in their degrees of diagenesis. The mudstone interlayer has stronger consolidation and thus much higher elasticity modulus (about 1.1-2.5 GPa) and much lower permeability than the muddy one (282-476 MPa)[28]. But they both have permeabilities much lower than the ultra-heavy oil reservoir. The core of the same barrel shows alternate reservoir beds, muddy interlayers, and mudstone interlayers, demonstrating apparent lithological heterogeneity of the reservoir (Fig. 3).
Fig. 3.

Fig. 3.
Core of Fengcheng ultra-heavy oil reservoir and interlayers.
In general, the three keys to the stimulation of ultra-heavy oil reservoir are as followings. The first one is the mechanism that causes the microfractures to joint together into macrofractures during fracturing in the reservoir. The second is whether the fracture initiated in the interlayer can cut through the interlayer and how the fracture propagates when it reaches the reservoir. The third is whether the microfractures in the reservoir can break through the interlayer after converging into microfractures. Therefore, true triaxial experiments were conducted to find out the mechanisms of fracture propagation in both the reservoir and interlayer in this work, in the hope to help design fracturing program.
2. Experiment design and method
2.1. Conventional triaxial test
As natural core samples have highly viscous heavy oil and strong heterogeneity, and reservoirs in different positions have widely different oil saturations and clay mineral contents, it is very difficult to this study, man-made reservoir and interlayer samples were prepared in layers in a steel cubic mold to meet the mechanical, hydraulic, and geometric properties of the reservoir and interlayer. A series of rock physics and mechanics experiments were performed to verify that the artificial samples have similar properties with the natural core samples.
To further ensure that the artificial samples can represent the natural core samples, standard cylindrical samples of 25 mm×50 mm with densities and composition same as the natural core samples from the reservoir and interlayer were compacted. Conventional drained triaxial compression (CIDC) tests were conducted on the samples following the ASTM- D7181 standard (2011)[29]. The experiments were conducted at the pore pressure of 5 MPa (average pore pressure in the reservoir), saturation coefficient of 0.88-0.92, and effective confining stress (confining stress minus pore pressure) of 0.5, 1.0, 2.0, 5.0 MPa, respectively. The above tests were performed on cylindrical samples of the same size cut from the reservoir, muddy interlayer and mudstone interlayer core samples.
2.2. True triaxial test
Considering the engineering background and requirement mentioned above, true triaxial test samples were made for the following 3 cases (Table 1): (1) Fracturing in pure reservoir sample to investigate the microfracture growth in low-quality but relatively homogeneous reservoir (sample 1). (2) Fracturing in mudstone interlayer of interbedded reservoir-interlayer to find out the effects of fracturing fluid rate, viscosity, and perforation density on the fracture growth (sample 2-5). (3) Fracturing in reservoir of a sample with interbedded reservoir and interlayer to study the propagation behavior of the fracture when it reaches the reservoir-interlayer interface (sample 6).
Table 1 Samples and test parameters.
| No. | Lithology | Injection rate/ (mm3•s-1) | Fracturing fluid viscosity/(mPa•s) | Perforation |
|---|---|---|---|---|
| 1 | Reservoir | 320 | 1 | 2 |
| 2 | Reservoir-interlayer-reservoir | 320 | 1 | 2 |
| 3 | Reservoir-interlayer-reservoir | 960 | 1 | 2 |
| 4 | Reservoir-interlayer-reservoir | 320 | 150 | 2 |
| 5 | Reservoir-interlayer-reservoir | 320 | 1 | 4 |
| 6 | Interlayer-reservoir-interlayer | 320 | 1 | 2 |
The No. 1-6 samples all have a sand-mud ratio of 65:35,same as the average ratio of the natural reservoir, and oil saturation of 70.6%, also close to that of the natural reservoir (67.1%). The artificial samples were made by mixing quartz sand and clay, which have the particle size distribution and clay composition (mostly kaolinite and illite) same with the natural samples. The silicon oil with a high viscosity of 7×10⁴ mPa•s at 20 °C was used to replace the ultra-heavy oil. All the samples were evenly compacted layer by layer in a cubic steel mold with a wall thickness of 1 cm. At the interface, scratches were made using a soil cutter before compacting the overlying layer to ensure that the particles between layers can interlock with each other to avoid the occurrence of man-made smooth bedding planes.
Based on the injection rate and fluid viscosity in the actual fracturing in the oilfield, the similarity principles proposed by Liu et al.[30] were followed to calculate the corresponding injection rates and viscosities used in the laboratory. The injection rates calculated were 320 mm3/s and 960 mm3/s, and the corresponding field injection rates were 0.6 m3/min and 1.8 m3/min. The viscosities were 1 mPa•s and 150 mPa•s, respectively, with corresponding field fracturing fluid viscosities of 6 mPa•s and 900 mPa•s.
The experiments were conducted in a true triaxial fracturing device[31]. To examine the growth of microfractures and macrofractures after fracturing by CT scanning, the samples were set at a dimension of 100 mm×100 mm×100 mm. Each sample was pasted with eight acoustic emission sensors on the sides to monitor the acoustic responses during fracture propagation (Fig. 4). The acoustic events mainly occur at the fracture initiation positions; the denser the fractures, the denser the acoustic events at the fracture will be[32].
Fig. 4.
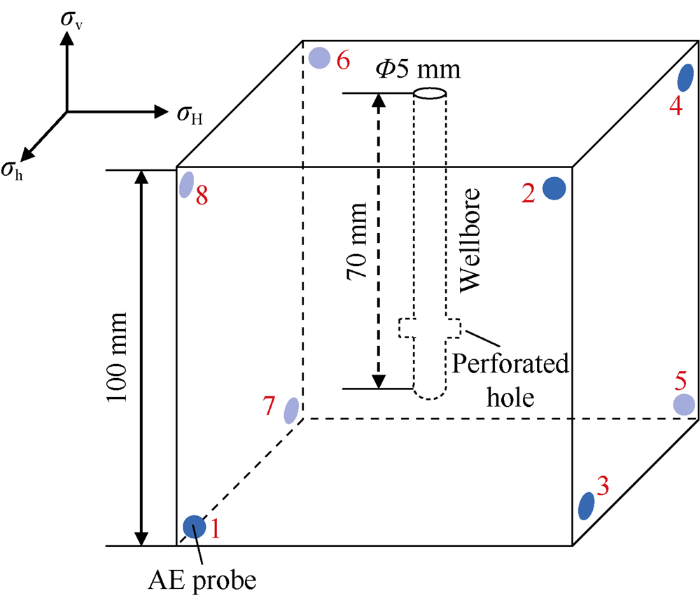
Fig. 4.
Schematic diagram of the true triaxial fracturing experiment model in ultra-heavy oil reservoirs.
The experiments follow five steps. (1) The samples were compacted layer by layer in a steel mold with a simulated wellbore preset and thickness of 10 mm by soil mechanics method. The aluminum wellbore has an outer diameter of 5 mm and a wall thickness of 1 mm, and 2-4 (in 1-2 rows with two holes in each row) holes of 1.5 mm in diameter simulating perforated holes (Fig. 4). As previously mentioned, the conventional triaxial tests were performed to make sure that the compacted samples have mechanical and physical properties similar to the samples from the actual reservoir, muddy interlayer and mudstone interlayer. (2) The polyethylene resin was applied on the surfaces of each sample to prevent the injected water from leaking. (3) Because the reservoir samples in this study are much less consolidated than the traditional tight rock samples for triaxial experiment, to prevent the injected fluid from flowing along the outer surface of the well- bore to the top of the sample, a thin layer of cement (10 mm thick) was placed on the top of each sample, consequently, the samples 1-6 in Table 1 are 90 mm thick, while each reservoir and interlayer in samples 2-6 is 30 mm thick. (4) The three-dimensional boundary stresses at the simulated depth were applied to the six faces of a sample. According to previous fracturing tests in the field and the Kaiser acoustic emission tests, the geo-stresses, σv, σH, and σh in the region have gradients of 0.021, 0.019, and 0.017 MPa/m respectively. Therefore, for the reservoir at the depth of 395 m in a vertical well in the SAGD region of Fengcheng oilfield, the σv, σH, and σh are 8.3, 7.5 and 6.6 MPa respectively. It is worth noting that the interlayers may have different σH and σh values from the upper and the lower reservoir layers because of the deposition environment and diagenetic process. It is necessary to do in-situ measurement to find out the difference in horizontal ground stresses between different layers and improve the boundary stress conditions in the future. (5) The servo-control system was turned on to implement the injection rate and fluid viscosity given in Table 1, and the probes were used to detect any acoustic emission signal generated during the fracturing.
3. Experiment results and discussion
3.1. Conventional triaxial and permeability experiments
where${p}'\text{=}\frac{{{I}_{1}}}{3}\text{=}\frac{{{\sigma }_{ii}}^{\prime }}{3}$, $q\text{=}\sqrt{3{{J}_{2}}}\text{=}\frac{\sqrt{6}{{({{s}_{ij}}{{s}_{ij}})}^{1/2}}}{2}$, and ${{\sigma }_{ii}}^{\prime }\text{=}$ ${{\sigma }_{11}}^{\prime }\text{+}{{\sigma }_{22}}^{\prime }\text{+}{{\sigma }_{33}}^{\prime }$.
Based on the results of triaxial shear experiments, the relationships of mean effective stress and the Mises stress of both the artificial and natural reservoir samples were fitted from the yield points (Fig. 5).
Fig. 5.
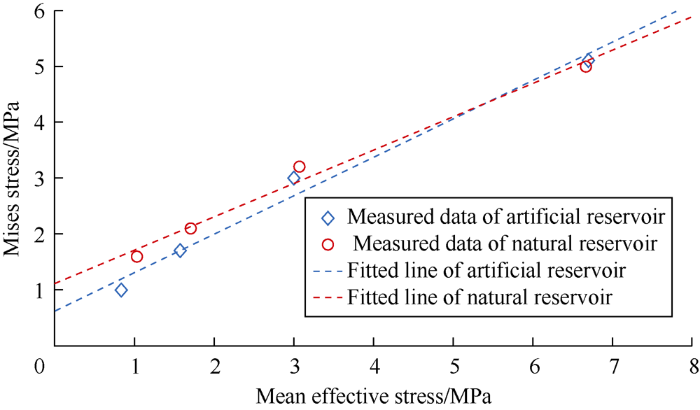
Fig. 5.
Fitted relationships between mean effective stress and Mises stress of artificial and natural reservoir samples.
Combining the β and d derived from Fig. 5, the conventional triaxial test results, and the petrophysical test results, the petrophysics and rock mechanical parameters of the artificial and natural reservoir samples were obtained and are shown in Table 2. Comparing the fitted results in Fig. 5 and mechanic and hydromechanical parameters in Table 2, it can be seen that the artificial reservoir has the same elasto-plastic mechanical and percolation properties and can substitute the natural reservoir sample in the true triaxial fracturing tests.
Table 2 Petrophysical and rock mechanical parameters of artificial and natural reservoir samples.
| Parameter | Value | |
|---|---|---|
| Artificial reservoir sample | Natural reservoir sample | |
| Viscosity (20 °C) | 7×10⁴ mPa·s | 1×10⁵ mPa·s |
| Mud content | 35% | 35% |
| Oil saturation | 70.6% | 67.1% |
| Porosity | 23.2% | 22.0% |
| Water permeability | 3.5×10⁻³ μm2 | 2.9×10⁻³ μm2 |
| Elasticity Modulus | 345 MPa | 476 MPa |
| Poisson's ratio | 0.4 | 0.4 |
| Inner friction angle | 34.4° | 30.7° |
| Cohesion | 0.63 MPa | 1.12 MPa |
| Dilatant angle | 14.0° | 20.2° |
The DP constitutive model was used to analyze the triaxial test results of the natural muddy interlayer, artificial interlayer, and natural mudstone interlayer, and the fitted p′ and q results are shown in Fig. 6. The same approach was used to derive the petrophysical and rock mechanical parameters of the three types of interlayers (Table 3).
Fig. 6.
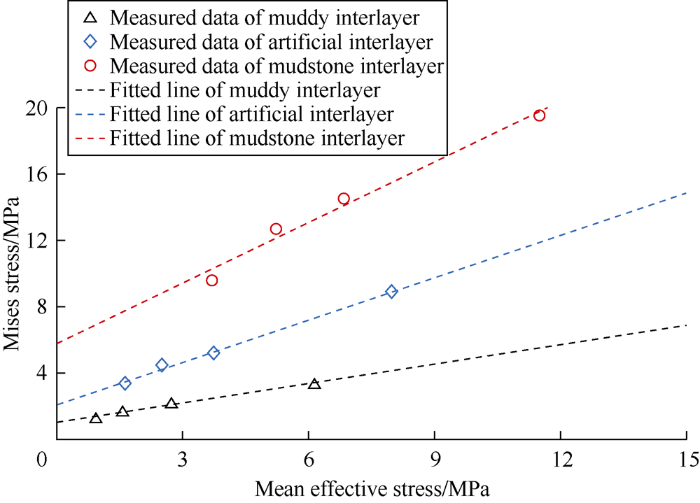
Fig. 6.
Fitted results of Mises stress and mean effective stress of the three kinds of interlayers.
Table 3 Petrophysical and rock mechanical parameters of artificial interlayer, natural muddy interlayer, and natural mudstone interlayer.
| Parameter | Value | ||
|---|---|---|---|
| Muddy interlayer | Artificial interlayer | Mudstone interlayer | |
| Mud content | 40% | 45% | 50% |
| Porosity | 16% | 8% | 10% |
| Water permeability | 0.33×10⁻³ μm2 | 0.55×10⁻³ μm2 | 0.02×10⁻³ μm2 |
| Elasticity Modulus | 382 MPa | 520 MPa | 1 250 MPa |
| Poisson's ratio | 0.3 | 0.3 | 0.2 |
| Inner friction angle | 21.4° | 40.3° | 50.6° |
| Cohesion | 1.04 MPa | 2.15 MPa | 5.78 MPa |
| Dilatant angle | 17.0° | 22.6° | 38.7° |
Comparing the fitted p’-q curves and the parameters in Table 3 shows that the properties of the artificial interlayer fall in between those of the other two types of interlayers. In fact, the natural muddy interlayer and the mudstone interlayer represent the two extreme cases in formations and most interlayers have mechanical properties in between them. It is legitimate to regard the artificial interlayer as the most representative of the situation on average.
3.2. True triaxial fracturing experiment
The fracturing experiment results of samples 1-6 include the injection pressure curves, acoustic emission events, and the CT scanned images after the fracturing (Figs. 7-12). The X, Y and Z axes are at the directions of σh, σH, and σv.
Fig. 7.

Fig. 7.
Pressure curve and acoustic emission events (a) and CT scan images (b-e) of sample 1.
Fig. 8.

Fig. 8.
Pressure curve and acoustic emission events (a) and CT scan images (b-e) of sample 2.
Fig. 9.

Fig. 9.
Pressure curve and acoustic emission events (a) and CT scan image (b-e) of sample 3.
Fig. 10.

Fig. 10.
Pressure curve and acoustic emission events (a) and CT scan images (b-e) of sample 4.
Fig. 11.

Fig. 11.
Pressure curve and acoustic emission events (a) and CT scan images (b-e) of sample 5.
Fig. 12.

Fig. 12.
Pressure curve and acoustic emission events (a) and CT scan images (b-e) of sample 6.
After each fracturing experiment, by analyzing the CT scanned image and the pressure curve, the fracture propagation behavior under different test conditions was figured out. Moreover, the software ImageJ was used to process the CT image to estimate the fracture width. First, the relationship between pixel and distance was calibrated. Straight line along the top edge of the image side was drawn to obtain the number of pixels on the line. Second, knowing the total number of pixels at the 100 mm long edges of the sample and that of the straight line sections, the resolution of the sample was calculated in a unit of mm/pixel. Finally, straight-line segments were drawn at the width of fractures, from which the width value was estimated by counting the number of pixels on each segment.
Fig. 7 shows the fracturing results in the pure reservoir. It can be seen from Fig. 7a that the pressure dropped by 0.5 MPa after the injection pressure reached the breakdown pressure (12.0 MPa) and then stabilized at around 12 MPa. At the same time, the acoustic emission signal enhanced sharply at 8 s after fracturing, and the intensity of the signal stayed constant until unloading (60 s), implying continuous generation of microfractures. It can be seen from the CT images that these microfractures exist mostly as dominant leak-off paths (thin solid curves in red) rather than linear aperture-like macrofractures with visible fracture surfaces. Red curves of different thicknesses were marked on the images to indicate fractures with different widths. It can be seen from Fig. 7 that microfractures less than 1 mm wide in both σH and σh directions were generated near the perforation holes.
The pressure curve of sample 2 shows that the pressure plunged to 12 MPa after reaching the breakdown pressure (18.3 MPa), then rose slightly and leveled up. Meanwhile, the acoustic signal became stronger significantly at the fracture initiation (5 s) and kept consistent until the 28 s when the pressure unloaded, implying constant development of microfractures in this period. By analyzing the pressure curve and the breakdown pressure of the interlayer and reservoir, it is believed that during fracturing, macrofractures of about 1.2 mm wide generated first inside the interlayer (bound by the elliptical dashed line in Fig. 8d), and then traversed the interface into the reservoir and propagated. Leak-off increased in the reservoir, and a single microfracture of about 80 μm wide was created.
Fig. 9a shows the injection pressure of sample 3 decreased dramatically after reaching the breakdown pressure (23.8 MPa), indicating macrofractures (1.5-2.0 mm wide) were generated and leak-off worsened. At the same time, the acoustic signal turned stronger. After injection for 30 s, the pressure fluctuated around 12 MPa for four times and then evened off. Meanwhile, the acoustic emission signal kept at a relatively high level, suggesting the macrofractures extended through the interface and generated microfractures in reservoir (less than 0.5 mm wide). Fig. 9b shows that linear macrofractures extending radially inside the interlayer, of which the fractures along the σH direction have the largest aperture. The macrofractures propagated through the interlayer to the reservoir and produced microfractures with limited extension. Compared with sample 2, increasing the injection rate in the interlayer can make the width and extension of the macrofracture increase. It is worth noting that the dark shaded parts in the blue dashed ellipses of Fig. 9d represent the fracture surfaces of the fracture propagation direction intersecting with the tangent line in the Y direction instead of macrofractures.
Fig. 10a shows that the pressure curve of sample 4 fluctuated violently multiple times at 12 MPa. Meanwhile, the acoustic signal became stronger behind the time of fracture initiation but remained at a relatively high level (with a peak value greater than 60 dB) later on. From the CT images after fracturing, it can be seen that not only a single transverse-layer fracture developed at the wellbore-interlayer interface, but also linear fractures along the interlayer-formation interface came up. This is because the cementing between the external surface of the wellbore and the interlayer was weak and some artificial microfractures existed there; the injected fluid propped open the artificial microfractures and made them grow down to the interlayer-reservoir interface. When the highly viscous fracturing fluid entered the reservoir, it reduced leakage, and induced a pore dilated zone by plastic compression of the sand matrix[20]. The plastic deformation in the reservoir caused the pressure to rise until a few tensile or shear microfractures emerged and then the pressure dropped. The small leak-off and repeated pressure build-up are the reasons of the apparent fluctuations of the pressure after fracture initiation.
The injection pressure of sample 5 decreased to some extent at 95 s and remained stable afterward, except two slight decreases at the 135 s and 225 s (Fig. 11a). The acoustic signal turned stronger 15 s after the first pressure drop but then remained stable until the last pressure unloading. Even though its pressure drop is not as significant as that of sample 2 or 3, sample 5 had linear macrofractures in both the interlayer and reservoir spread radially from the wellbore after fracturing (Fig. 11b-11e). There were noticeable fractures and leak-off zones (dashed line bounded area) around the two rows of perforated holes. The fractures inside the interlayer and the reservoir are about 2 mm and 0.06 to 1.2 mm wide respectively, indicating increasing perforation density can improve the fracturing effect of the reservoir-interlayer sample significantly. The fracturing fluid entered the reservoir immediately after the macrofractures initiated in the interlayer. Then the pressure build-up induced by plastic deformation of the sand layer offsets in large degrees the pressure decrease caused by the initiation of macrofractures in the interlayer.
Different from samples 2-5, fracturing in sample 6 was conducted in the reservoir bounded by two interlayers above and below. The pressure curve of sample 6 can be divided into two phases: First, when the pressure increased to the breakdown pressure of the reservoir (9.8 MPa), microfractures appeared near the wellbore, leading to a drop in pressure (70 s), and then the pressure became stable gradually with the further propagation of fractures. In the second phase, when the microfractures reached the reservoir-interlayer interface, the pressure increased again (130 s), which drove the microfractures to extend at the interface when the pressure reached the interface strength. Concurrently, the acoustic signal had two peaks at the 70 s and the 130 s, respectively. As illustrated in Fig. 12c-12e, microfractures and a leak-off zone (i.e., dilated zone, dotted oval in Fig. 12d) came up in the reservoir, but no fracture was created in the overlying and underlying interlayers. The propagation of the fractures follow similar pattern as that of sample 1; in other words, fractures arose in both σH and σh directions, and were 40-60 μm wide.
Based on the fracturing results of samples 1-6, the fracture propagation regularities under the effects of injection rate, fluid viscosity, perforation density, and location of fracture initiation have been sorted out (Table 4).
Table 4 Fracture propagation regularities during fracturing.
| Factors | Sample No. | With/without propagation through the layer | Fracture propagation shape | |
|---|---|---|---|---|
| Variable | value | |||
| Injection rate | 320 mm3·s-1 | 2 | Yes | Multiple vertical fractures |
| 960 mm3·s-1 | 3 | Yes | Macrofractures penetrate the interlayer into the reservoir and form microfractures | |
| Viscosity | 1 mPa·s | 2 | Yes | Multiple vertical fractures |
| 150 mPa·s | 4 | Yes | Single fracture penetrates the interlayer and linear fracture extends along the interface | |
| Perforation number | 2 | 2 | Yes | Multiple vertical fractures |
| 4 | 5 | Yes | Fractures increased in length and width; linear macrofractures were generated in the reservoir | |
| Fracture initia- tion position | Interlayer | 2 | Yes | Multiple vertical fractures |
| Reservoir | 1 | - | Microfractures and a dilated zone formed in the reservoir | |
| Reservoir | 6 | No | Microfractures and a dilated zone came up in the reservoir only; but interlayers were not fractured open | |
Note: “-” represent that since sample 1 is even reservoir sample, there is no layer penetration phenomenon.
If fracturing in the pure reservoir, microfractures would arise and extend in both σH and σh directions throughout the sample. If fracturing in the interlayer of reservoir-interlayer- reservoir interbedded sample, the cross-layer fractures propagate in both σH and σh directions inside the reservoir. The capacity of the fractures penetrating layers enhances, and the length and width of fracture extension increase with the increase of injection rate. Increasing the fracturing fluid viscosity would reduce the fluid leak-off and a single fracture is likely to be created, which would drive the fluid to leak off along the sand-mud interface. When the perforation density increases, the fractures increase in width, length and capacity of traversing layers. Complex macrofractures can generate in both the reservoir and interlayers. Finally, if fracturing in the reservoir layer between two interlayers, microfractures and a dilated zone would be created only in the reservoir, whereas the microfractures cannot break through the adjacent interlayers.
4. Conclusions
Micro-fracturing in the ultra-heavy oil reservoir primarily induces the development of microfractures and dilated zones, whereas it can hardly generate linear macrofractures. Moreover, the microfractures cannot break through the interlayers and can only extend along the reservoir-interlayer interface. Therefore, in the implementation of vertical well assisted fracturing stimulation, it would be better to fracture inside the mudstone or muddy interlayer rather than the reservoir, to improve the fracturing efficiency. When fracturing in the interlayer, to break through the interlayer more efficiently, the injection rate shall be higher than 0.6 m3/min to strengthen the capacity of the fracture to break the interlayer. Produced water with low viscosity from earlier SAGD project is suggested to be used as the fracturing fluid to enhance the complexity of the fracture network. Increasing perforation density is also proposed to boost the ability of the fractures in crossing layers, raise the fracture network complexity, and increase the fracture width and extending length.
Therefore, the fracturing position and engineering parameters can be optimized to stimulate the reservoir effectively, and to construct high efficient flow channels in desired regions of the reservoir. This way can shorten the preheating period of a SAGD project, increase the recovery ratio, reduce the consumption of steam, and finally lower the environmental stress.
Nomenclature
d—cohesion, MPa;
f—yield surface function, MPa;
I1—invariable of the first principle stress, MPa;
J2—invariable of the second deviator stress, MPa2;
pf—formation pore pressure, MPa;
p′—average effective stress, MPa;
q—Mises stress, MPa;
sij—deviator stress, i=1, 2, 3, j=1, 2, 3, MPa;
αb—Biot coefficient;
β—internal friction angle, (°);
σH—maximum horizontal stress, MPa;
σh—minimum horizontal stress, MPa;
σii′—effective stress, MPa;
σij—total stress, i=1, 2, 3, j=1, 2, 3, MPa;
σij′—effective stress tensor in Einstein index method, i=1, 2, 3, j=1, 2, 3, MPa;
σv—vertical ground stress, MPa;
σ11′, σ22′, σ33′—principle effective stresses in 3 directions, the values on the diagonal line of the effective stress tensors, MPa.
Reference
Application of steam recycle preheating technology to bilateral horizontal well
Experimental study on dilation mechanism of micro-fracturing in continental ultra-heavy oil sand reservoir, Fengcheng Oilfield
Steam assisted gravity drainage-concept, development, performance and future
Geomechanical response of heavy oil reservoirs to the steam assisted gravity drainage process
Models of steam- assisted gravity drainage (SAGD) steam chamber expanding velocity in double horizontal wells and its application
A criterion for evaluating the efficiency of water injection in oil sand reservoirs
Evaluating constitutive models for simulation of water injection in land facies Karamay oil sand reservoirs: The 50th U.S. Rock Mechanics/Geomechanics Symposium
Consideration of geomechanics for in-situ bitumen recovery in Xinjiang, China
Prediction on the reservoir dilatation results by squeeze preprocessing in SAGD wells
Fracturing in the oil sand reservoirs
Geomechanics for the thermal stimulation of heavy oil reservoirs: Canadian experience
Experimental study on hydraulic fracturing of soft rocks: Influence of fluid rheology and confining stress
DOI:10.1016/j.petrol.2006.01.009 URL [Cited within: 1]
Experimental study of hydraulic fracturing in sand as a function of stress and fluid rheology
Closure of hydraulic fractures visualized by X-Ray CT technique in sand: The 1st Canada-U.S. Rock Mechanics Symposium
Observation and modeling of the hydraulic fracture tip in sand: The 42th U.S. Rock Mechanics Symposium
Experimental study of the impact of shear dilation and fracture behavior during polymer injection for heavy oil recovery in unconsolidated reservoirs
Experimental study of hydraulic fracturing in unconsolidated sands using X-ray CT method: The 47th U.S. Rock Mechanics/Geomechanics Symposium
Laboratory study for pore water effect on hydraulically-induced fracture behavior in unconsolidated sands: The 48th U.S. Rock Mechanics/Geomechanics Symposium
Experimental study of hydraulic fracturing in unconsolidated materials
Evaluation of reservoir deformation induced by water injection in SAGD wells considering formation anisotropy, heterogeneity and thermal effect
DOI:10.1016/j.petrol.2017.07.067 URL [Cited within: 1]
SAGD operation in interbedded sands with application of horizontal multistage fracturing: Geomechanics and fracturing aspects
An experimentally verified criterion for propagation across unbounded interfaces in brittle linear elastic materials
Evaluation of the influencing factors of dilatancy effects by squeezing liquids in SAGD wells in the Fengcheng oilfield of Xinjiang oilfield
Heterogeneity impact on SAGD process performance in mobile heavy oil reservoirs
Impact of heterogeneous geomechanical properties on coupled geomechanical-flow simulation of SAGD
Shale layers issues in oil sands SAGD process
Experimental investigation on dilation mechanisms of land-facies Karamay oil sand reservoirs under water injection
Method for consolidated drained triaxial compression test for soils: ASTM-D7181
Similarity criterion in hydraulic fracturing simulation experiment. Journal of the University of Petroleum,
Cyclic hydraulic fracturing of cubic granite samples under triaxial stress state with acoustic emission, injectivity and fracture measurements: The 52th U.S. Rock Mechanics/Geomechanics Geomechanics Symposium
Propagation law of hydraulic fractures during multi-staged horizontal well fracturing in a tight reservoir
Effect of stress and stress path on Young’s modulus and Poisson ratio of unconsolidated rocks: A new idea for hydraulic fracturing
Study on the crack experiment of argillaceous loose sandstone cracks
