


Introduction
Most reservoirs in China are sandstone reservoirs, and waterflooding has been commonly used to stabilize production and increase recovery efficiency. China has been a leader in waterflooding development[1,2,3]. But for most oilfields nowadays with high water cut and high degree of recovery, e.g. Daqing and Shengli, it is difficult to stabilize oil production and control water cut due to highly scattered remaining oil and extremely complex oil-water distribution[4,5,6]. At the stage of oilfield development, different layers in a long borehole interval have different degrees of recovery; besides, it is hard to complete a perfect injection-production pattern owing to casing failure and casing distortion in aging wells[7,8]. High- permeability flowing channels tend to occur in heterogeneous reservoirs after waterflooding for a long period of time; this leads to invalid or inefficient circulation of injected water. The issues above resulted in decreased efficiency of EOR and increased difficulties in improving recoverable reserves. So, smart analysis of water-drive reservoir is of important engineering significance for enhancing oil recovery of mature oilfields.
Our team have been focusing on some key techniques, e.g. implanted downhole adjusting device, layer-oriented gauging device, and borehole two-way communication, and developed technologies of real-time monitoring and auto-control of separated-layer water injection in recent years. These technologies enable digitized real-time monitoring of separated-layer pressure and flow rate in water injection wells and network informatization of dynamic water injection monitoring for oil reservoirs, and are boosting digitalization, automation, and integration of separated-layer water injection[9,10,11]. With these technologies, the workload of gauging and adjusting after detailed single-well layer subdivision can be reduced, and the issue of multiple cost increase caused by more investment in staff and equipment can be mitigated. What is more important is that our achievements can provide technical support to detailed smart reservoir characterization. In this paper, we discuss reservoir modeling and history matching in combination with injection and production monitoring data to reduce the uncertainties of remaining oil and flood effectiveness prediction for further EOR improvement.
1. Big-data application to reservoir characterization
Conventional water injection optimization is based on numerical simulation, as shown in Fig. 1. The first step is geologic modeling based on static and dynamic reservoir data and numerical reservoir simulation, or history matching in accordance with the experience of reservoir engineers. The second step is oil production prediction using reservoir numerical simulation for each plan, which is designed for water injection adjustment after a specific proportion of data are matched, until an optimal plan is finally obtained. This workflow suffers from a typical long time cost, strong dependence on the experience of reservoir engineers, and limited plans for optimization. The workload of numerical simulation will be further increased if massive performance data of water injection are involved in the calculation. Besides, it is hard to take full advantage of performance data within the current framework of numerical simulation.
Fig. 1.
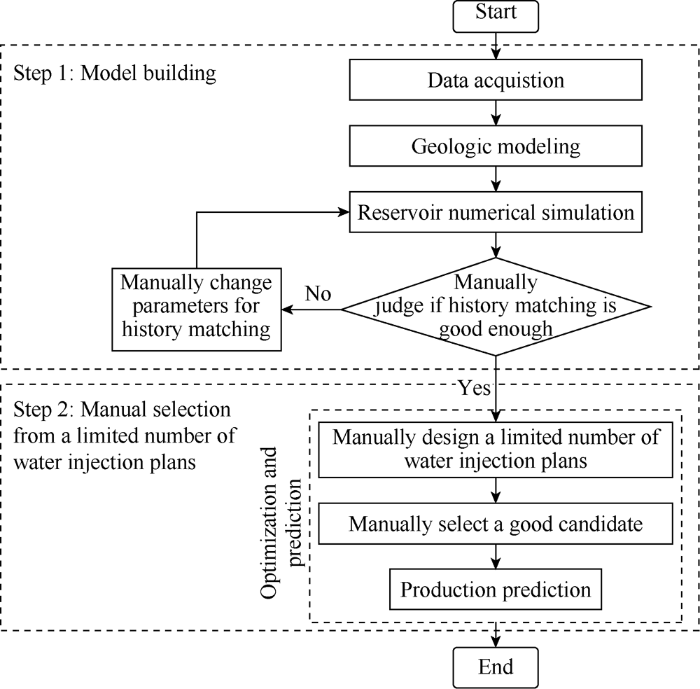
Fig. 1.
Conventional workflow for water injection plan optimization.
In recent years, the development of big data has given some enlightenment to algorithm upgrading in petroleum exploration and development, and big data has been applied first to well log and seismic interpretation, indicator diagram optimization for petroleum production engineering, and intelligent drilling. In reservoir engineering, we want to apply artificial intelligence to reservoir characterization to get better understanding on reservoirs and then propose more efficient plans for reservoir engineering. But there are some unique challenges when we take a reservoir as the objective of measurement, interpretation, and planning. (1) Reservoir interpretation and observation data points are highly heterogeneous in time and space. (2) There are great uncertainties in reservoir geology and petrophysical properties[12]. (3) Reservoir performance data are very sparse, especially measured data, e.g. separated-layer water injection and oil/water output,. This means that there are not sufficient valid training samples for machine learning.
To address the issues above, we propose a method on how to elaborate and optimize data-driven water injection plans based on numerical simulation and optimization algorithms, and we also use hard data derived from real-time monitoring and auto-control of separated-layer water injection and recovery. First, automatic history matching is performed for the geologic model using intelligent assimilation to obtain reservoir fluid saturation and pressure changes under constraint of the hard data, i.e. detailed separated-layer water injection and recovery data. Then machine learning is used to quantify and assess the water injection indexes for each well group (layer) to obtain an optimal plan for multi-well separated-layer water injection. If more performance data are available, we can deepen the understanding of reservoir heterogeneity and flow banding using our algorithm and workflow; thus, it provides a systematic approach to reduce the uncertainties of remaining oil and flood effectiveness prediction, and elaborate the plan of water injection.
2. Plan design
Similar to the conventional workflow of water injection optimization, the data-driven workflow also has two steps, but each step is integrated with big-data analytical algorithms (Fig. 2). The first step is model construction integrated with data assimilation; thus, sustained data-driven parameter correction are performed automatically. The second step is plan optimization and prediction integrated with machine learning to quantify and assess separated-layer flood effectiveness for further adjustment. The final injection plan is obtained using big-data intelligent optimization.
Fig. 2.
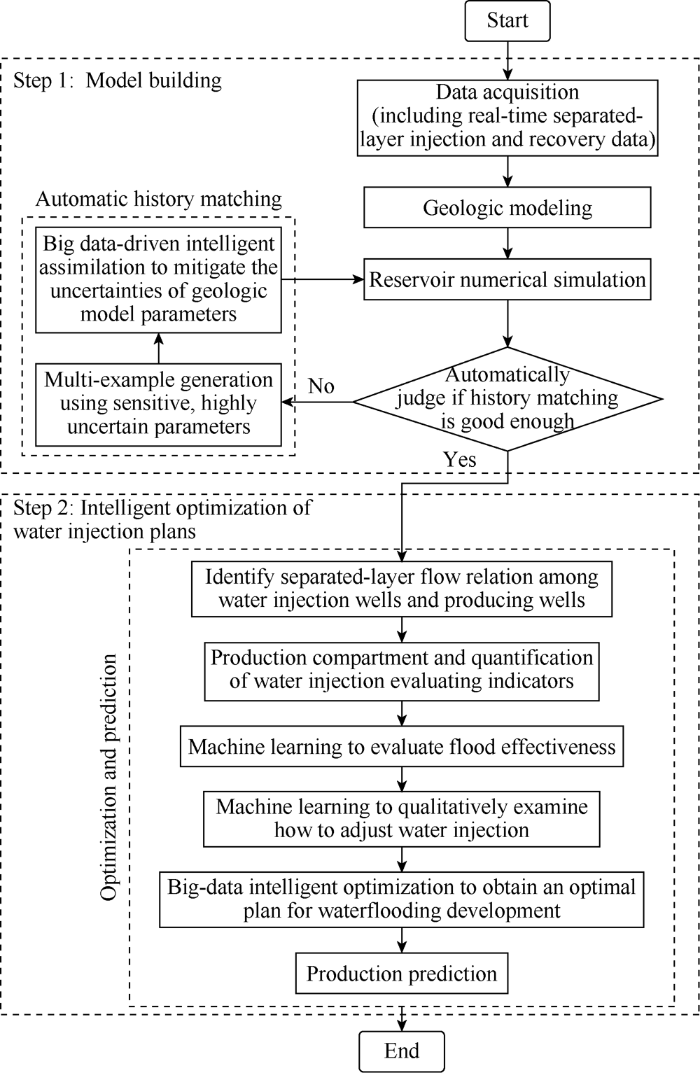
Fig. 2.
Big data-driven workflow for water injection plan optimization.
2.1. Model construction
The geologic structure and static attribute model is built based on static reservoir data and real-time hard data, e.g. cumulative discharge from injection and productive layers, instantaneous flow rate, and pressure. The model for reservoir numerical simulation is automatically fitted using data assimilation. Here we use ensemble Kalman filtering to adjust and correct the reservoir model in accordance with performance data[13].
Kalman filtering is an inversion method based on least square and Bayesian theory. Ensemble Kalman filtering is Monte-Carlo implementation of Kalman filtering. A group of initial models (initial sample set) are generated using priori information. All the models are tested in parallel, and initial models will be adjusted as per the difference, i.e. error covariance matrix, between results predicted by the model and performance data. Uncertain parameters of the numerical model are updated step by step to reduce the error between predicted and observed quantities. This method is good at handling issues involving large-scale data.
In the process of history matching, 4 types of parameters sensitive to simulation results with low reliability are to be adjusted, i.e. matrix porosity, permeability, ratio of vertical to horizontal permeability for each layer, and initial capillary pressure at the oil-water contact (which affects the initial distribution of oil and water). The range of adjustment is determined in accordance with geologic setting and well log interpretations (Table 1).
Table 1 Value ranges of parameters to be adjusted.
| Parameter to be adjusted | Min. | Max. |
|---|---|---|
| Porosity multiplier for each layer | 0.8 | 1.2 |
| Permeability multiplier for each layer | 0.5 | 2.0 |
| Ratio of vertical permeability to horizontal permeability for each layer | 0.02 | 0.10 |
| Initial capillary pressure at the oil-water contact/kPa | 0 | 30 |
We set 20 realizations for history matching, with 4 iterations for data assimilation, through ensemble Kalman filtering. Fig. 3 compares calculated water cut for all realizations with observed water cut. The calculated curves run close to and finally arrive at the observed curves with more iterations of assimilation. At the 24th year, there is good fit between calculated curves and observed curves; this means that our history matching was satisfactory.
Fig. 3.
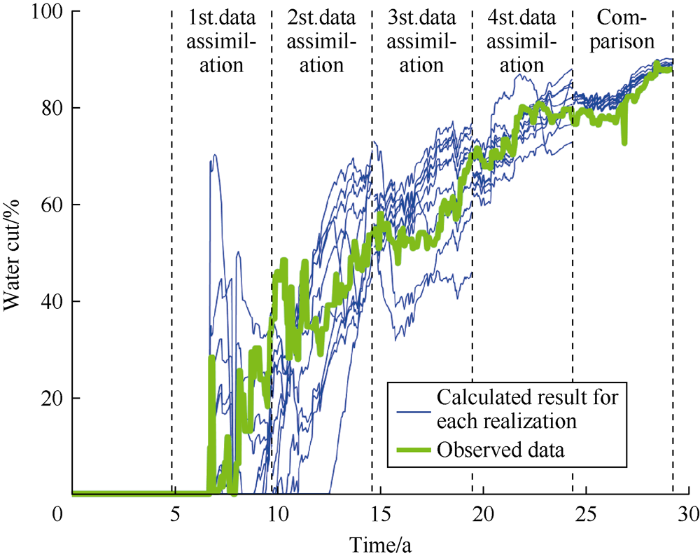
Fig. 3.
History matching and convergence.
In the process of history matching, 4 types of adjusting parameters converged quickly with data assimilation, as shown in Fig. 4 for the scenario of a major layer. For this geologic model, porosity multiplier, permeability multiplier, and initial capillary pressure at the oil-water contact show good convergence, indicating they are highly sensitive; permeability ratio shows a poorer convergence, indicating it is not sensitive due to poor vertical connectivity and small proportion of vertical fluid flow caused by well-developed barriers in this reservoir.
Fig. 4.
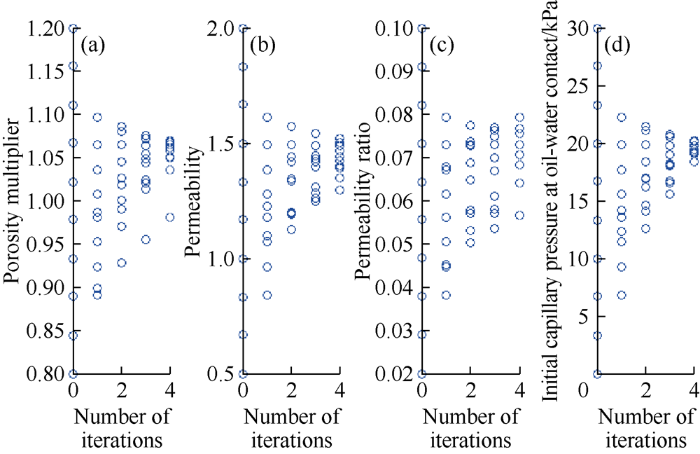
Fig. 4.
Convergence process of parameters to be adjusted.
The best matched model was used for subsequent study; this model can reasonably reflect the process of production and fluid flow in the reservoir.
2.2. Intelligent optimization of water injection plans
After obtaining a history matched model, we optimized the injection-production system by making adjustments for each well or layer, i.e. increasing oil production and decreasing water cut, to control water output, stabilize oil production, and slow down production decline. Thus, we addressed the issue of injection allocation by manually using a limited number of plans. There are 6 steps in intelligent optimization.
2.2.1. Identification of separated-layer flow relation between water injection wells and production wells
Based on the geologic model calibrated after automatic history matching, we used an algorithm[14] to automatically identify fluid flow among separated-layer water injection wells and producing wells. Relevant parameters include reservoir petrophysical properties, single-sand extension and geometry, fault geometry and sealing properties, performance data, injection and production profiles, layers with perforation and stimulation in oil wells and water wells, relative position of oil wells and water wells, and tracer monitoring. The criteria of identification are detailed as follows. (1) For the same sand, there is connected fluid flow path among water injection wells and producing wells in an appropriate well pattern with a proper spacing interval. (2) For different sands, water injection wells and producing wells are not connected. (3) Water injection wells or producing wells drilled in a mudstone area are not connected. (4) Water injection wells and producing wells in the vicinity of closed faults or a mudstone area are not interconnected. (5) For a sand geometry which causes overlong flowing channels among water injection wells and producing wells, there is no fluid flow or weak flow among water injection wells and producing wells. (6) Injected water may bypass barriers under proper conditions. (7) Second-tier oil wells in the same direction cannot be affected. (8) Oil wells can be affected from several directions. (9) At proper angles and spacing intervals, a water injection well can affect several oil wells. (10) There is no fluid flow in a layer which was not perforated simultaneously in water injection wells and producing wells. (11) Streamlines cannot cross each other.
2.2.2. Quantification of water injection evaluating indicators for a well group
Based on the identification of separated-layer flow relation between water injection wells and production wells, multi- layer multi-direction production splitting[15] is used to calculate fluid output and oil production in different layers and directions. This method aims at making full, proper use of all kinds of production data available in a mature field, such as well pattern, static reservoir petrophysical properties, re-perforation, layer adjustment, fracturing, injection and production performance, injection profiles, well logs at water flooded layers, pressure buildup/drawdown, features of injection and production, and pressure. Water injection rate at water injection wells and fluid output and water cut at producing wells were comparted in different layers and directions using fluid mechanics in porous media, petroleum reservoir engineering methods, and reservoir production data in combination with separated-layer fluid flow among water injection wells and producing wells.
As per production compartment, flood effectiveness centered around the injection well was quantified into 3 grades. Evaluating indicators include the number of surrounding oil wells affected by the injection well, fluid output and oil production driven by water injection, injection-production ratio, water rate, injection water retaining in the reservoir, water drive index, instantaneous water injection rate, and cumulative water injection volume. Additional indicators include cumulative flooding time and water intake per unit thickness[16]. Three-grade indicators for a water injection well group include (1) full-borehole indicator, centered around the whole wellbore; (2) layer indicator, centered around the injection layer; (3) single-bed indicator, centered around a single bed. The following equation shows how to calculate the water rate of three grades for a water injection well group.
2.2.3. Evaluation of flood effectiveness
Machine learning was used for the clustering of all indicators. The indicators were graded to be very good (large), good (large), medium, bad (small), and very bad (small). For example, the water rate for all well groups was graded to be very good, good, medium, bad, and very bad; the water intake per unit thickness for all well groups was graded to be very large, large, medium, small, and very small. We used the K-means algorithm for clustering.
2.2.4. Qualitative analysis of injection adjustment
As per the evaluating indicators for the water injection well group, we used the clustering algorithm in machine learning to diagnose whether or not to increase, decrease, or maintain the water injection rate and build a decision tree for qualitative analysis of injection adjustment (Fig. 5).
Fig. 5.
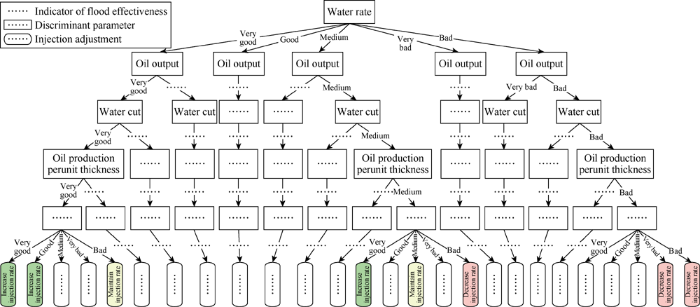
Fig. 5.
Schematic decision tree (the indicators of flood effectiveness are evaluated to be very good, good, medium, bad, and very bad; injection adjustment is diagnosed to be increasing, decreasing, and maintaining injection).
2.2.5. Injection plan optimization
Multi-objective optimization was performed using multi-objective particle swarm optimization. Particle swarm optimization[16] was developed by Kennedy and Eberhart, inspired by social behavior of bird flocking, for global stochastic optimization based on swarm intelligence. The optimal solution is searched by using the iteration starting from a swarm of initial random particles (random solutions). In each iteration, two extremum values are tracked to update the particles. The optimal solution for the particles is entitled individual extremum, and the optimal solution for the whole swarm is entitled global extremum. After multi-objective particle swarm optimization, a group of non-inferior solution particles are obtained as an "elite set". The degree of adaptability is then calculated using the niche technique for the non-inferior solution particles in the "elite set". The degree of particle aggregation decreases with the degree of adaptability. Those particles with the largest adaptability are taken as the optimal solution.
After the total injection in the area, injection adjustment for the well group, and the range of injection allocation adjustment were determined, we used particle swarm optimization and niche algorithm to optimize injection allocation. In other words, we quantitatively optimized the injection increase for those well groups (or layers) to be increased and the injection decrease for those well groups to be decreased in accordance with some indicators, e.g. oil production and water cut.
2.2.6. Production prediction
According to the optimized plan for injection allocation, the history matched reservoir model is used to predict oil production and water cut in the area.
3. Case study
A complex fault-block reservoir in eastern China was studied as a field example. This block has an oil-bearing area of 2.93 km2, geologic reserves of 1.655×10⁷ t, and 42 small layers. This block is a horst-type anticline with a major axis between two normal faults in north-east direction. The surrounding part is structurally high and the inner part is structurally low. Reservoir rocks consist of finestone and siltstone with large lithologic variation and strong interbedding feature of sandstone and mudstone. The reservoir rocks are of medium porosity and medium permeability. The development experienced 4 periods, including (1) the period of productivity construction and full production, (2) period of layer subdivision and adjustment with infill well pattern, (3) period of commingled water injection and production and local refinement with water cut increase and production decline, and (4) period of controlling water cut and stabilizing oil production. The block has 237 wells now, including 102 oil wells and 60 water wells in operation, and a composite water cut of 89.12%. As per geologic setting and well log data, we built a geologic model with 42 layers and 143 000 effective grids (Fig. 6). Oil saturations in different periods (Fig. 7) were obtained by automatic history matching. The overall ratio of fitted single-well water cut was above 85%. Fig. 8 shows the calculated water cuts and observed water cuts of two oil wells. Based on the geologic model after history matching, we calculated injection-production flow relation of each layer using automatic identification of fluid flow between separated-layer water injection wells and production wells (Fig. 9).
Fig. 6.
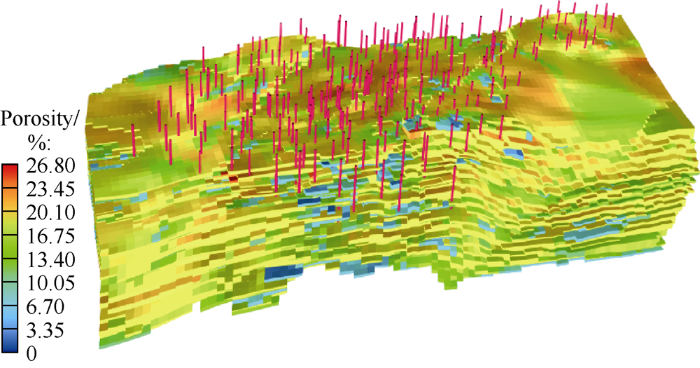
Fig. 6.
Geologic model of the example block.
Fig. 7.
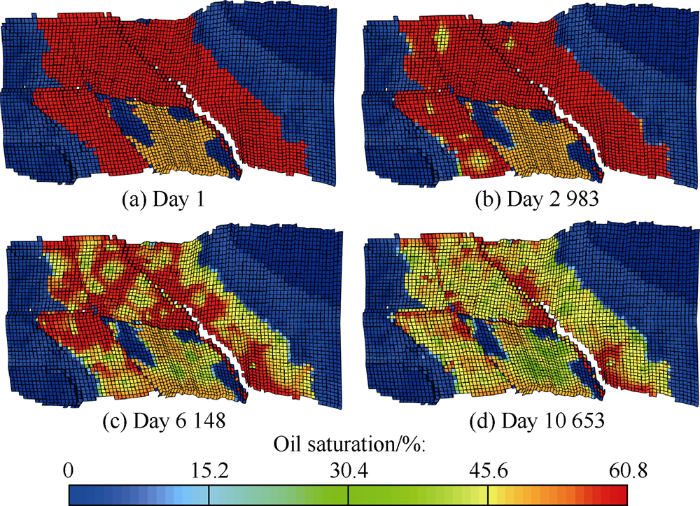
Fig. 7.
Oil saturation variation of a layer in the example block.
Fig. 8.

Fig. 8.
Observed water cuts and calculated water cuts of two wells.
Fig. 9.

Fig. 9.
Fluid flow among separated-layer water injection wells and producing wells.
Based on the estimation of separated-layer injection-production fluid flow, we calculated some evaluating indicators, e.g. water cut, water rate, oil production, fluid output, injection- production ratio, and total thickness of produced reserves. Fig. 10 shows the water cut, oil production, and water consumption rate of producers in all water injection well groups. All the indicators were graded into very good, good, medium, bad, and very bad by using machine learning clustering. Fig. 11 shows the clustering results of water rate, injection-production ratio, and oil production for all water injection well groups. As per the evaluation results, we used the decision tree algorithm to classify all the water injection well groups into 3 types, i.e. increasing injection, decreasing injection, and maintaining injection, as shown in Fig. 12. For example, injection rate should be decreased, maintained, and increased at Wells 187, 73, and 95, respectively.
Fig. 10.
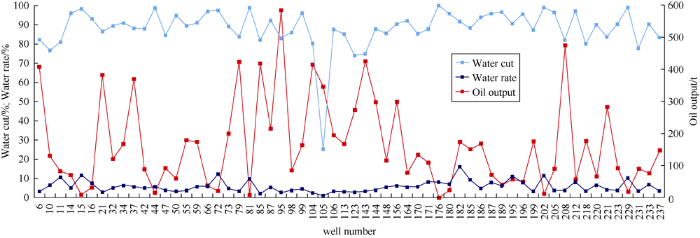
Fig. 10.
Evaluating indicators for producing wells.
Fig. 11.
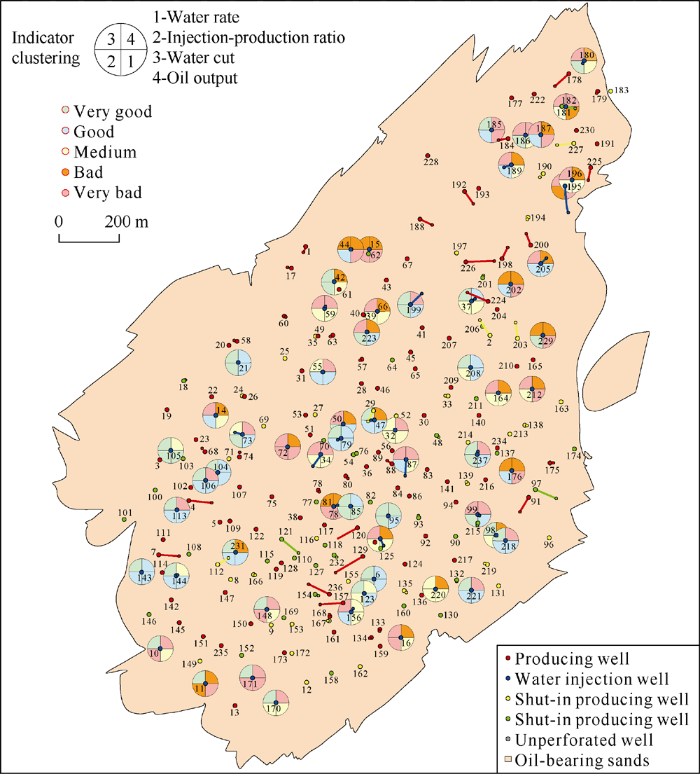
Fig. 11.
Qualitative evaluation of flood effectiveness
Fig. 12.
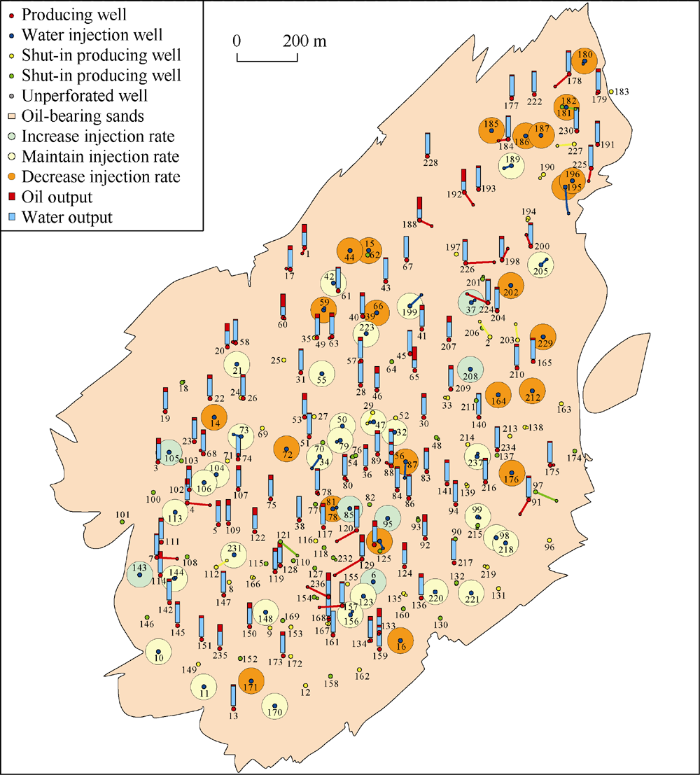
Fig. 12.
Qualitative analysis of water injection adjustment.
To increase cumulative oil production and reduce water cut, we used the particle swarm optimization and niche algorithms to optimize the injection allocation for the wells with increased and decreased injection rate. The cumulative oil production in 12 months after optimization was calculated to increase by 8.2% compared with the production without optimization. Optimized injection allocation is shown in Table 2.
Table 2 Quantitative optimization of injection allocation.
| Well group number | Qualitative conclusion | Daily injection increase (decrease)/m3 | Percentage of injection increase (decrease)/% |
|---|---|---|---|
| 187 | Decrease injection rate | -1.98 | -36.30 |
| 73 | Maintain injection rate | 0 | 0 |
| 95 | Increase injection rate | 10.12 | 14.23 |
In accordance with optimized injection allocation, we predicted water cut and monthly oil production within 12 months without any stimulations. The same prediction was also made for the scenario without injection optimization (Fig. 13). The composite water cut in the 12th month after optimization was calculated to decrease by 1.11% compared with that without optimization; monthly oil production was calculated to increase by 1 138.2 t compared with that without optimization.
Fig. 13.
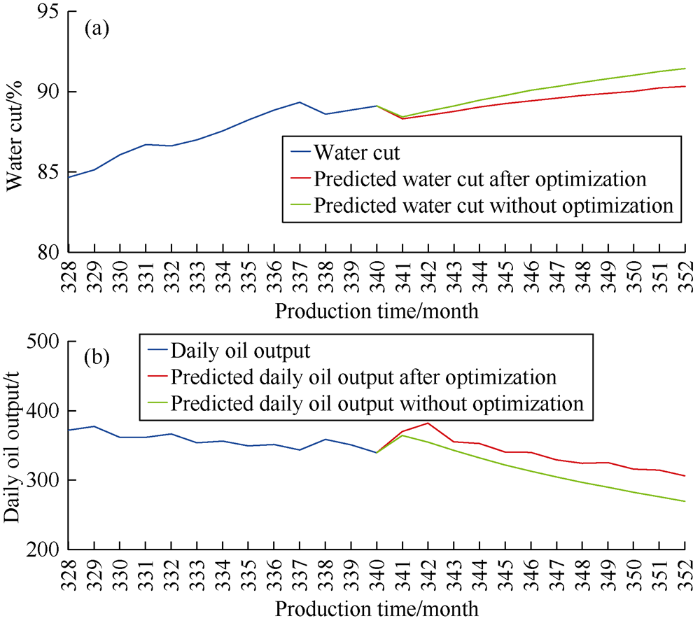
Fig. 13.
Water cut and oil production curves.
4. Conclusions
To address the issues in separated-layer water injection in mature fields, we presented a data-driven method to optimize elaborated water injection plans. History matching was performed automatically using data assimilation constrained with performance data. Multi-well multi-layer water injection was quantified and evaluated using machine learning to judge how to adjust water injection. The final optimal plan for injection adjustment was obtained using intelligent optimization. Compared with conventional methods, our methodology and workflow involved automated, intelligent data-driven and machine learning algorithms; 85% of data were matched. As per the case study, the cumulative oil production in 12 months after optimization was calculated to increase by 8.2% compared with the production without optimization. History matching and water injection plan optimization, which used to be time-consuming, laborious tasks with uncertain results, can be accomplished efficiently using machine learning algorithms. Thus, it is possible to elaborate a detailed water injection plan for the mature field.
With the development of separated-layer water injection technology of the fourth-generation and breakthroughs in implanted downhole adjusting device, layer-oriented gauging device, and borehole two-way communication, abundant performance data can be obtained. Thus, it is possible to realize the integration of petroleum reservoir engineering and petroleum production engineering, which features water injection planning, intelligent optimization, and synchronous adjustment, through big data-driven water injection optimization for mature fields.
Nomenclature
Bg—gas volume factor;
Bo—oil volume factor;
k—oil well No.;
No—total number of oil wells with fluid flow;
ρ—oil density, t/m3;
Qg,T,k—cumulative volume of dissolved gas driven from the corresponding interval in the kth oil well by water injection in the whole wellbore/section/layer in the injection well, m3;
Qo,T,k—cumulative oil production driven from the corresponding interval in the kth oil well by water injection in the whole wellbore/section/layer in the injection well, t;
W—cumulative water injection volume, m3;
WCR—water consumption rate.
Subscript:
T—3 grades for the whole wellbore, section, and layer, respectively.
Reference
The 10 great advances of petroleum science and technology of CNPC in 2012
Current status and trend of separated layer water flooding in China
Development and evaluation of water injection technology in north Saertu oilfield
Optimum development options and strategies for water injection development of carbonate reservoirs in the Middle East
Review and outlook of separate layer water injection technology in Daqing
Connotation, application and prospect of the fourth-generation separated layer water injection technology
Variable-universe adaptive fuzzy control of layered water injection technique
Research on processing methods of vortex flowmeter signal processing in layered water injection technology
Management and instant query of distributed oil and gas production dynamic data
Characterization of non- Gaussian geologic facies distribution using ensemble Kalman filter with probability weighted re-sampling
DOI:10.1007/s11004-014-9548-8 URL [Cited within: 1]
A new production splitting method based on discrimination of injection-production relation: Proceedings of the International Field Exploration and Development Conference 2017
Particle swarm optimization
