


Introduction
The Mahu Sag in the northwestern margin of the Junggar Basin is one of the onshore hydrocarbon exploration hotspots in China at present, where the world’s biggest conglomerate oil province has been constructed, and the main productive formations are the Lower Triassic Baikouquan Formation (T1b) and the Permian upper and lower Wuerhe Formations (P3w and P2w). Exploration has shown that the large conglomerate oil province in the Mahu Sag is characterized by poor reservoir physical properties, large-area distribution of reservoirs, and extensive development of overpressure, etc.[1,2,3,4,5,6,7,8,9,10] It is generally a low permeability-tight conglomerate oil province. Unlike the integrated source-reservoir of tight oil and gas, the source and reservoir of the large conglomerate oil province of the Mahu Sag are vertically separated. The hydrocarbon-bearing series, the T1b, the P3w and the P2w, are vertically 1000 to 4000 m from the major source rock in the Lower Permian Fengcheng Formation (P1f). For low-permeability-tight hydrocarbon accumulation, vertical hydrocarbon migration passing several formations over such a long distance is rare. The dynamic mechanism of this migration has become one of the issues waiting to be answered urgently in the study of the accumulation process and enrichment laws.
With deepening of exploration and research, it has been found that the distribution of hydrocarbon in the above-source large conglomerate oil province is closely related to overpressure[2-4, 6-7], suggesting that overpressure may be the dynamic mechanism for cross-formation long-distance hydrocarbon migration. However, the origin of the overpressure and its effect on petroleum accumulation are still unclear. The concrete manifestations are as follows: Firstly, traditional methods are generally used to identify the origin of overpressure. The multi-logging combination method[11,12,13,14,15], Bowers method (the loading-unloading curve method)[16], sonic velocity-density cross-plot method[17,18,19,20], porosity comparison method[14, 21], reverse reasoning from the pressure calculation method, etc.[14, 20, 22-30] are all empirical identification methods which have been widely used in recent years abroad but have not been applied to obtain crucial information on the origin of overpressure in this oilfield. Secondly, there are differences between empirical identification methods of overpressure origin in different compaction models. There is no analysis on the two-stage linear mechanical compaction model and identification of the overpressure origin on this background. Thirdly, only a few researchers analyzed the mechanisms of overpressure by interval transit time curve and basin simulation methods, etc. Due to limited data available and other reasons, it has been accepted that overpressure is mainly caused by disequilibrium compaction, hydrocarbon generation makes a small contribution, and fault activity plays an important role in the formation of overpressure near fault zones on the margin of the sag[2]. Fourthly, overpressure is considered to be one of the main controlling factors for enrichment and high yield of petroleum[2-4, 6-7], but there is no in-depth analysis of the formation and evolution of overpressure and its working mechanism and coupling relationship in the process of hydrocarbon accumulation.
Overpressures of different origins have different evolution processes and different coupling relationships with the formation and adjustment of reservoirs, and play different roles in the accumulation models and enrichment laws of reservoirs[11, 25, 28, 30-33]. Through in-depth study of the origin of overpressure in the Mahu Sag and effect of overpressure on hydrocarbon accumulation, this paper provides a geological basis for future exploration, and provides a comparison for the study of overpressure and hydrocarbon accumulation in areas with similar geological settings.
1. Geological settings
The large conglomerate oil province in the Mahu Sag of the Junggar Basin is located on the southeastern side of the fault zone in the northwestern margin of the basin. The Mahu Sag in NE-SW strike overall, with an area of about 6800 km2, is one of the most prolific sags in the Junggar Basin[1, 4-7] (Fig. 1). The main reservoirs in the large conglomerate oil province of the Mahu Sag are the Lower Triassic Baikouquan Formation (T1b), the Middle Permian Lower Wuerhe Formation (P2w), and the Upper Permian Upper Wuerhe Formation (P3w) conglomerate layers. With poor physical properties and strong heterogeneity, they are typical low permeability-tight reservoirs. The cap rocks are the thick Middle Triassic Karamay Formation (T2k) and the Upper Triassic Baijiantan Formation (T3b) argillaceous rocks.
Fig. 1.
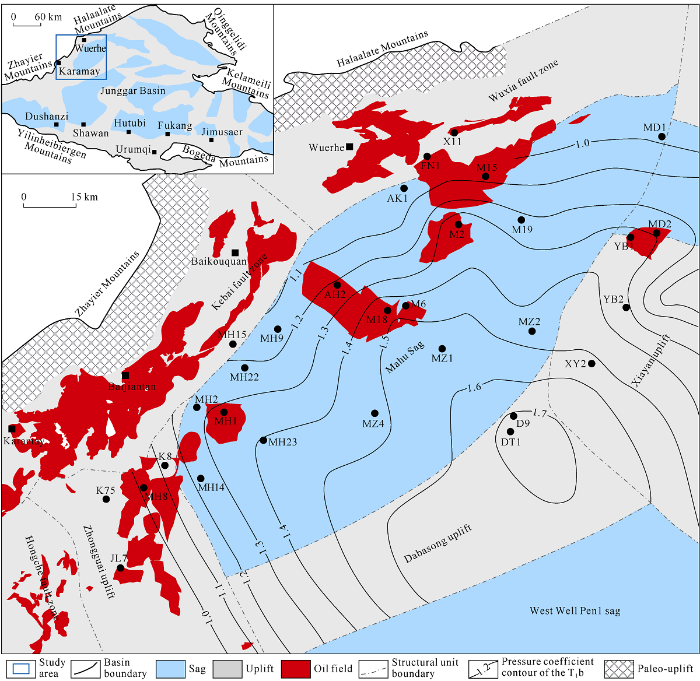
Fig. 1.
Location and pressure coefficient distribution of the T1b conglomerate oil province in the Mahu Sag, Junggar Basin, NW China.
Four sets of possible source rocks in the Mahu Sag are the Carboniferous, the Lower Permian Jiamuhe Formation (P1j) and the Fengcheng Formation (P1f), and the Middle Permian Lower Wuerhe Formation (P2w). But oil-source correlation indicates that hydrocarbon in the above-source large conglomerate oil province is mainly generated by the Fengcheng Formation source rock[3-4, 6-7]. The Fengcheng Formation source rock is the oldest alkaline-lacustrine source rock discovered in the world so far, which is about 50 m thick, rich in bacteria and algal mother material, high in organic matter abundance, dominated by type Ⅱ1 organic matter, and strong and lasting in hydrocarbon generation capacity[7, 34]. Reverse and strike-slip faults formed since the Indosinian movement build communication between the source rock and the reservoirs. In particular, the widespread strike-slip faults in the sag provide paths for large-scale vertical migration of oil and gas[1, 3-7].
2. Distribution of pressure and origin of overpressure
2.1. Distribution of pressure
Current drilling results show that overpressure distribution in the large conglomerate oil province of the Mahu Sag is very wide and regular. Vertically, overpressure mostly occurs in strata more than 3000 m deep, including the T1b, P3w and P2w, with pressure coefficients mainly from 1.20 to 1.60, and 1.93 at maximum (Fig. 2). The Baijiantan Formation (T3b) is the transfer zone from normal pressure to overpressure. On the plane, the current exploration activities of the P3w and P2w are mainly concentrated in the southwest of Mahu Sag. Affected by the exploration scope, overpressure is also primarily distributed in the southwest. T1b in the marginal area of the Mahu Sag, close to the side of the fault zone in the northwestern margin of the Junggar Basin is largely normal in pressure, and gradually changes to overpressure towards the west slope and central area of Mahu Sag. It reaches the pressure coefficient of over 1.8 in the Dabasong and Xiayan uplift in the east, with mainly overpressure overall (Fig. 1).
Fig. 2.
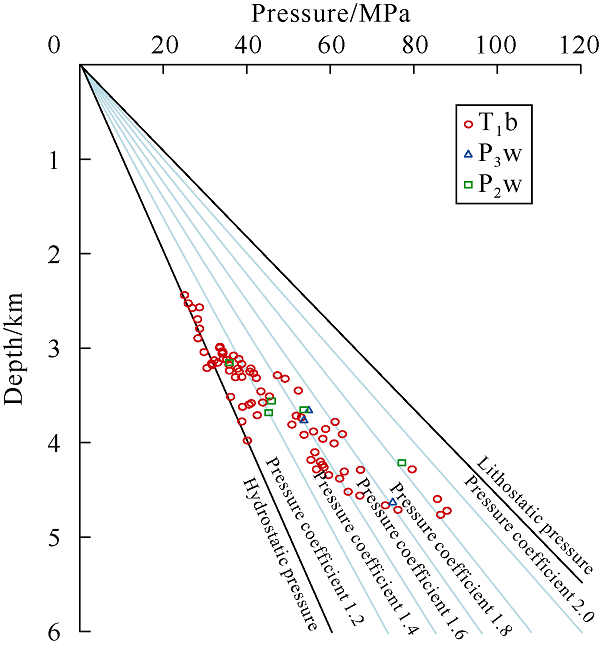
Fig. 2.
Depth vs. pressure coefficient in the conglomerate oil province of the Mahu Sag.
2.2. Normal compaction model of the shale
Whether the overpressure point falls in the normal compaction trend is an important means to identify the origin of overpressure by various methods[11,12,13,14,15,16]. For the identification of the origin of overpressure in an area, the normal compaction trend and compaction model need to be clarified first, and then the appropriate method to identify the origin of overpressure in the corresponding compaction model can be selected. Two normal compaction models, two-stage linear and exponential, have been found through analyzing the logging curve characteristics of more than 100 wells in the Mahu Sag and compiling shale compaction profiles of over 20 key wells.
2.2.1. Exponential compaction model of the Xiayan and Dabasong uplift
The exponential compaction model of shale is the most common normal compaction model, that is, under normal compaction, shale porosity decreases exponentially as burial depth increases. The compaction characteristics of shale in the Xiayan and Dabason uplifts accord with this typical exponential compaction model. The compaction profiles of shale show that from the surface to the middle part of the Badaowan Formation (J1b, with a burial depth of about 3500 m), as the burial depth increases, the shale decreases exponentially in porosity and interval transit time, increases exponentially in density and resistivity. For formations such as the T3b, T2k, T1b, P3w and P2w, with increase of burial depth, the interval transit time, resistivity and density logging curves show reversal and different degrees of deviations from the trend of the normal compaction curve, accompanied by the development of overpressure (Fig. 3).
Fig. 3.
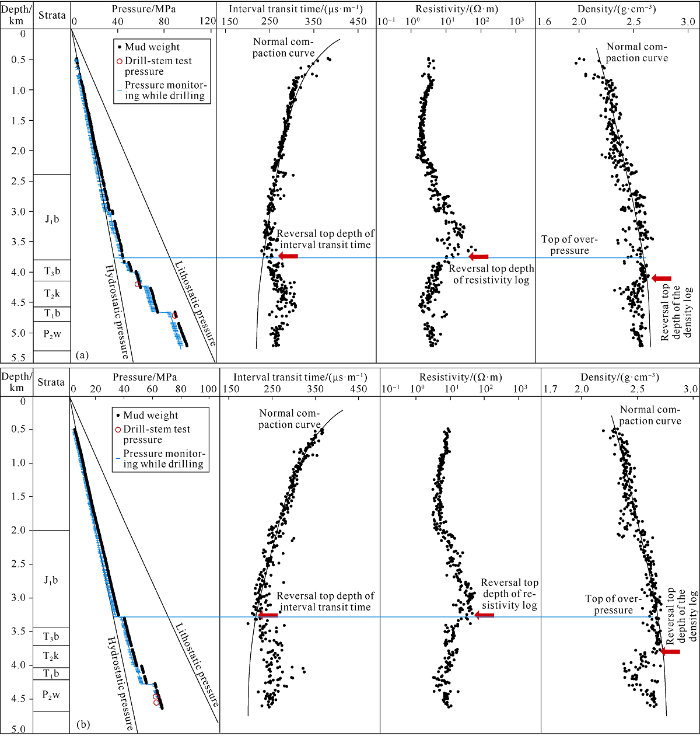
Fig. 3.
Shale compaction features and formation pressure profiles of Well D9 in the Dabasong uplift (a) and Well YB2 in the Xiayan uplift (b) of the Mahu Sag. J1b—Badaowan Formation; T3b—Baijiantan Formation; T2k—Karamay Formation; T1b—Baikouquan Formation; P2w—Lower Wuerhe Formation.
2.2.2. Two-stage linear compaction model in the west slope and central area of Mahu Sag
Unlike the eastern area, shale compaction in the west slope and central area of Mahu Sag shows two-stage characteristics. The first stage is mainly in the strata above the middle and lower J1b with buried depths of 2000-2500 m. With the increase of burial depth, the shale decreases in porosity and interval transit time linearly, increases in density linearly, and increases in resistivity normally. The second stage is from the middle and lower J1b with burial depths of 2000-2500 m to the P2w. As the burial depth increases, the shale formations remain essentially unchanged in porosity, interval transit time, and density. Overpressure turns up in the T2k, T1b, P3w and P2w below 3000 m (Fig. 4). The top interface of the overpressure is usually 500 to 1000 m below that of the second compaction stage of shale.
Fig. 4.
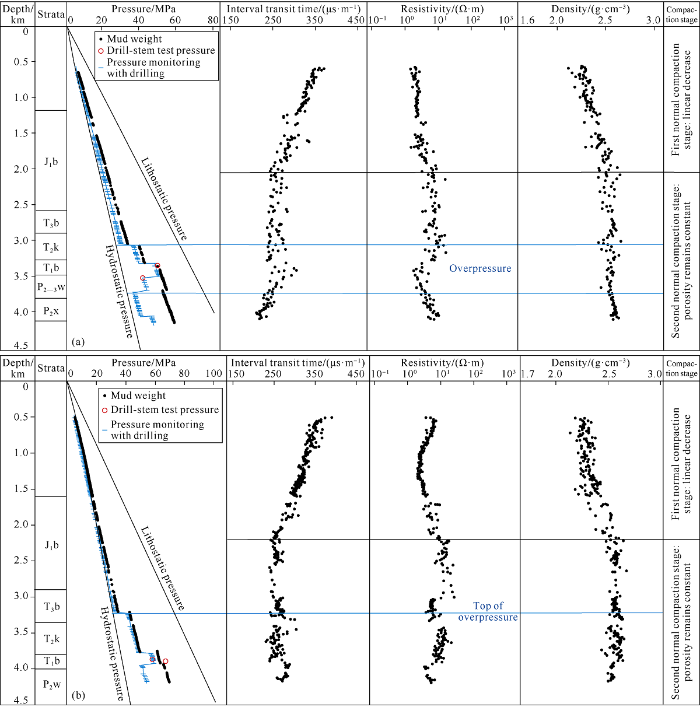
Fig. 4.
Shale compaction features and formation pressure profiles of Well MH2 in the west slope (a) and Well M18 in the central area (b) of the Mahu Sag. J1b—Badaowan Formation; T3b—Baijiantan Formation; T2k—Karamay Formation; T1b—Baikouquan Formation; P2w— Lower Wuerhe Formation.
The two-stage linear compaction model is also a basically model of shale normal compaction in sedimentary basins[35,36,37], that is, the compaction of shale is divided into deep and shallow burial stages. In the shallow burial stage, with the increase of burial depth, the shale formations decrease linearly in porosity, sonic velocity, and density. In the deep burial stage, the shale formations remain unchanged in porosity, sonic velocity, and density. In the 1990s, Hunt et al.[36,37] examined the two-stage linear compaction model of shale in the Gulf Coast Region, US, and concluded that its development was primarily related to high quartz content. X-ray diffraction and elemental analysis of hundreds of shale samples show that clay-scale minerals of grain size less than 4 μm have a quartz content of 74% and content of clay minerals of 24%. Among them, samples containing fine-grained quartz and carbonate with small internal surface area stop compaction when the porosity is about 3%, while shale samples containing smectite and illite with large internal surface area stop compaction when the porosity is about 10%. Some researchers suggested that the shale sections with constant porosity, sonic velocity and density occurring in the Qiongdongnan Basin of China were related to the combination and transformation of clay minerals[38].
According to the traditional exponential compaction model, the second stage (constant porosity stage) of the two-stage linear compaction model can easily be mistaken for a manifestation of disequilibrium compaction, and the existence of overpressure may then be attributed to disequilibrium compaction. In fact, the second stage of the two-stage linear compaction model also belongs to the normal compaction stage, and is a manifestation of the cessation of mechanical compaction and dominance of chemical compaction, and isn’t related to the formation of overpressure[11, 37]. It cannot be regarded as the basis of disequilibrium compaction overpressure.
The compaction characteristics of the shale formations in the west slope and central area of the Mahu Sag conform to the two-stage linear compaction model. The first stage is from the surface to burial depths of 2000-2500 m where the porosity decreases linearly, the second stage is more than 2500 m deep where the porosity remains constant (Fig. 4). The compaction model difference between this area and the Xiayan and Dabasong uplift areas may be related to the differences in source materials of the two areas. The sediments in the west slope and central area of Mahu Sag are mainly from the western provenance, while those of the Xiayan and Dabasong uplifts are from the eastern provenance. Taking the T1b as an example, it has finer grain size, better sorting and higher shale content in the eastern Xiayan and Dabasong uplifts than in the west slope and central area of the sag[39,40].
Since the west slope and central area of the Mahu Sag have different normal compaction model from the Xiayan and Dabasong uplift, different identification methods of overpressure origin should be adopted for them, so several differnt methods were used to identify the overpressure origins in the two areas. Wells MH2 and M18 in the west slope and the central area of the sag, and wells D9 and YB2 in the Xiayan and Dabasong uplifts were taken as examples.
2.3. Origins of overpressure in the Xiayan and Dabasong uplifts
2.3.1. Multi-logging combination method
Analysis of logging curve combination is a basic and reliable method for identifying the origins of overpressure in sedimentary basins. The combination characteristics of three logging curves, interval transit time, resistivity, and density at least must be used in this method[11,12,13,14,15]. Firstly, if the interval transit time, resistivity and density log curves show large reversal synchronously in the overpressure section, the overpressure is caused by disequilibrium compaction. Secondly, if the three don’t show reversal synchronously or the density does not change or slightly reduces, the overpressure is caused by hydrocarbon generation etc. fluid expansion origin, or pressure transfer. Thirdly, if all the three do not show reversal, the overpressure may be caused by tectonic compression.
The log curves of overpressure sections in the Xiayan and Dabasong uplifts show obvious characteristics of asynchronous reversal. The reversal depth of the density curve lags behind that of the interval transit time and resistivity curves. For example, the reversal depth of the interval transit time and resistivity curves of Well D9 is at 3800 m, and that of the density curve is at 4100 m; the reversal depth of the interval transit time and resistivity curves of Well YB2 is at 3300 m, and that of the density curve is at 3800 m (Fig. 3).
The overpressure in the reservoirs of T1b, P3w and P2w in the large conglomerate oil province in the Mahu Sag is inferred to be caused by fluid expansion or pressure transfer.
2.3.2. Bowers method and sonic velocity-density cross-plot method
Bowers considered that the charts of changes in sonic velocity and vertical effective stress in the overpressure section (that is, loading-unloading curve charts) can be used to identify the origins of overpressure[16]. These charts are widely used, and have been generally accepted to discriminate the origins of overpressure and have achieved good application results[16, 41-50]. To identify the origin of overpressure effectively, when applying Bowers method, the sonic velocity-density cross plot and the relation plate of effective stress- density should be considered[17-20, 24, 43, 47]. So far, only a few domestic researchers used this method to identify the origin of overpressure in the Qingshankou Formation of the Songliao Basin[11] and Paleozoic overpressure in the Ordos Basin in China[40], with good results achieved.
In this study, the vertical effective stress of the key wells in the Mahu Sag was calculated using the calculation method of overburden pressure proposed by Tingay et al.[48] and the Terzaghi equation. The cross plots of sonic velocity-effective stress, sonic velocity-density and the relation plate of effective stress-density were accordingly compiled. In the cross plots of vertical effective stress-sonic velocity (Bowers method) and vertical effective stress-density, the overpressure points in the Xiayan and Dabasong uplifts fall on the unloading curve (Fig. 5), indicating that the overpressure is the result of fluid expansion/pressure transfer.
Fig. 5.
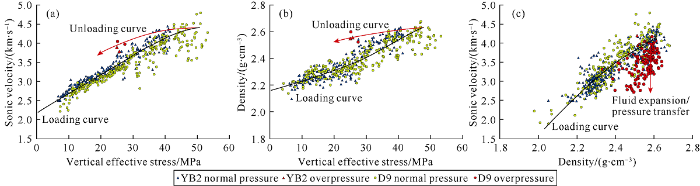
Fig. 5.
Overpressure origin identification charts by Bowers method and sonic velocity-density cross-plot method for Well D9 in the Dabasong uplift and Well YB2 in the Xiayan uplift of the Mahu Sag.
In the density-sonic velocity cross plot, the overpressure points of the study area fall in the overpressure area caused by non-disequilibrium compaction, such as fluid expansion/pressure transfer, outside the loading curve (Fig. 5). In the sonic velocity-density chart, the overpressure caused by non-disequilibrium compaction deviates from the loading curve, but the overpressures of different non-disequilibrium compaction origins differ in distribution. Firstly, non-disequilibrium compaction caused by fluid expansion/pressure transfer manifests as a slight decrease of sonic velocity, and constant or slightly reduction of density with the increase of overpressure intensity[43]. Secondly, overpressure caused by the transformation of clay minerals such as smectite to illite features an increase in density and unchanged or slightly decrease of sonic velocity with the increase of overpressure intensity[19, 24]. Thirdly, overpressure caused by load transfer and combination origin shows a decrease in sonic velocity and an increase in density with the increase of overpressure intensity[11]. According to comprehensive analysis, the overpressure of the Xiayan and Dabasong uplifts is of pressure transfer origin.
2.3.3. Porosity comparison method
Bowers and Katsube[49] found that disequilibrium compaction usually enabled the preservation of a large number of primary pores and led to significant changes in the volume attributes of the rock. In contrast, the effective stress reduction in fluid expansion/transfer overpressure horizons can generally only result in increase of pore width reflecting connectivity. Differences in the changes in connected pores and reservoir pores in the overpressure horizon (the porosity comparison method) can be used to identify the origin of overpressure.
There is little measured porosity data of shale samples available. Hermanrud et al.[14], Bowers[17], Bowers and Katsube[49] concluded that neutron and density logs reflected volume attributes, whereas sonic velocity and resistivity logs reflected the conductivity attributes of rocks. Logging data can be used to calculate the size of different types of pores in the overpressure section, and the origin of overpressure can be determined through comparative analysis. Some scholars used this method and achieved good application results[14, 21-22, 47].
In this study, the method proposed by Tingay et al.[22] was used to calculate sonic porosity (reflecting the conductivity attribute of rock) and density porosity (reflecting the volume attribute of rock), and plates of sonic porosity vs. depth and density porosity vs. depth were compiled. The calculated porosities based on shale density of the overpressure sections in the Xiayan and Dabasong uplifts basically conform to the normal compaction trend, indicating that the overpressure has not significantly changed the volume properties of the rock. That the calculated porosity based on sonic velocity deviates from the normal compaction trend (Fig. 6) is because the higher pressure coefficient (the pressure coefficient of the T1b in Well D9 is greater than 1.8) and the large excessive pressure causes the width of connected pores, such as throats and microfractures, to increase significantly, resulting in a small dilatancy effect. Accordingly, it is believed that overpressure in the study area is the result of fluid expansion/pressure transfer.
Fig. 6.
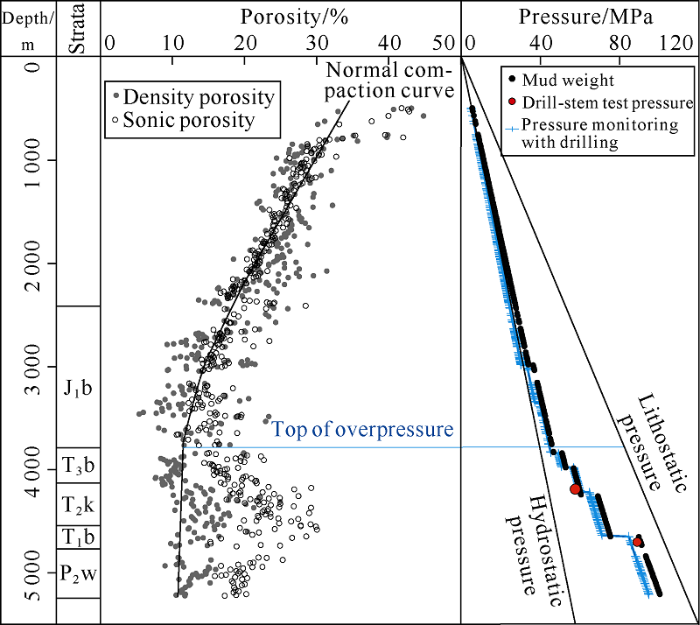
Fig. 6.
Overpressure origin identification chart by porosity comparison for Well D9.
2.4. Origin of overpressure in the west slope and central area of Mahu Sag
2.4.1. Analysis of multi-logging combination
Unlike the Xiayan and Dabasong uplifts, the shale formations in the west slope and central area meet the two-stage linear compaction model. The analysis of logging curve combination has been seldom reported to identify the origin of overpressure in this model.
2.4.1.1. Characteristics of diverse origins of overpressure on logging curve combination in the two-stage linear compaction model
Based on the mechanisms of overpressure of various origins and existing literatures[36,37], combined with the characteristics and identification methods of different origins of overpressure with logging curve combinations under the exponential compaction model of shale[11-15, 40], an scheme to identify different origins of overpressure with logging curve combination in a two-stage linear compaction model has been established (Fig. 7) to improve the identification system of overpressure origin and guide the identification of overpressure origins in the study area.
Fig. 7.
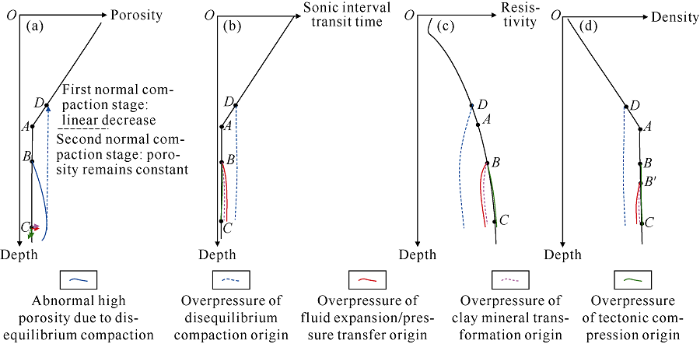
Fig. 7.
Overpressure origin identification chart by multi-logging combination method under the two-stage linear compaction model. A—Transition point of linear decrease stage and constant stage of porosity; B—Occurrence depth of overpressures of different origins; B°—Reversal depth delay of the logging curve of non-disequilibrium compaction overpressure; C—normal compaction/normal pressure; D—Equivalent depth of disequilibrium compaction.
For overpressure caused by disequilibrium compaction, due to the preservation of primary porosity (the porosity of the overpressure section is likely to be significantly greater than that of the normal compaction section), the overpressure section should exhibit a marked increase in interval transit time, or an obvious decrease in sonic velocity, resistivity, and density.
Among overpressures not caused by disequilibrium compaction, the overpressure of fluid expansion (hydrocarbon generation pressurization) / pressure transfer origin would change the pore connectivity of the rock (for example, by making throats turn wider) but has no, or little, effect on volume attributes, so it may lead to an increase in interval transit time, slight reduction or no variation in density, or obvious delay in the depth of density decrease than the depth of increase of interval transit time (that is, the two do not reverse synchronically). When tectonic compression occurs, most of the compaction has stopped, and the compaction effect caused by lateral loading is weak or negligible. Thus, the overpressure of tectonic compression origin features interval transit time, resistivity, and density curves are in line with the normal compaction trend, or slightly stronger than normal compaction. In comparison, the overpressure of smectite to illite transformation origin is characterized by an increase in interval transit time or a decrease in sonic velocity and an increase in density.
2.4.1.2. Origin of overpressure in the west slope and central area of Mahu Sag
Overpressure in the west slope and central area of the sag mainly occurs in the T2k to the P2w in the second normal compaction stage (at burial depth of over 3000 m). The overpressure section shows a slight decrease in resistivity and constant or slight deviation of the interval transit time and density from the normal compaction trend (Fig. 4). These characteristics of logging curve combination are similar to those of overpressure resulted from fluid expansion/pressure transfer described above, but obviously inconsistent with those of overpressure caused by disequilibrium compaction.
2.4.2. Bowers method and sonic velocity-density cross-plot method
Comparing the differences in formation mechanisms of overpressures[15-16, 19-20, 24, 43] of different origins shows that the loading curve in the two-stage linear compaction model consists of two segments, of which, the first segment is similar to the exponential compaction model, with the increase of sonic velocity, vertical effective stress and density increase. In the second segment, with the increase of vertical effective stress, the sonic velocity remains constant and shows a "platform". In the sonic velocity-density cross plot chart, the sonic velocity and density stagnate at (near) the transition point of the linear decrease segment and the constant segment (Fig. 8).
Fig. 8.
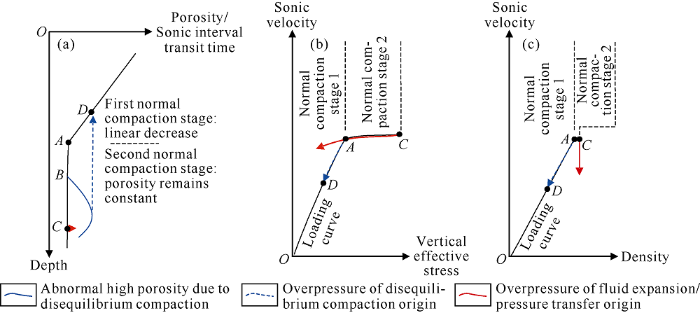
Fig. 8.
Loading curve-unloading curve features and overpressure origin identification under two-stage linear compaction model. A—Transition point of linear decrease stage and constant stage of porosity; B—Occurrence depth of overpressures of different origins; C—Normal compaction/normal pressure; D—Equivalent depth of disequilibrium compaction.
Disequilibrium compaction will cause the preservation of a large number of pores and a significant reduction in sonic velocity. Although overpressure caused by disequilibrium compaction occurs in the second stage, the intersection points in vertical effective stress-sonic velocity and density-sonic velocity will be located in the first stage rather than the second stage. Overpressure resulting from fluid expansion/transfer is still on the unloading curve. It should be noted that the unloading curve and the loading curve in the second stage of normal compaction are often close to each other or even coincide, hence, it is easy to mistake the overpressure caused by non-disequilibrium compaction on the unloading curve of the second stage as overpressure caused by disequilibrium compaction (Fig. 8). The location of overpressure due to non-disequilibrium compaction, such as fluid expansion/transfer on the unloading curve, depends on the intensity of the overpressure. When the sum of the excessive pressure and the hydrostatic pressure of the AC section is less than the formation pressure generated by the AC section, the overpressure point will fall in the second stage of normal compaction. In the sonic velocity-density cross plot, overpressure caused by non-disequilibrium compaction, such as fluid expansion/transfer, is similar to the exponential compaction model, with density remaining basically constant and sonic velocity decreasing to some degrees depending on the genesis of the overpressure (Fig. 8).
Well MH2 in the western slope area and Well M18 in the central area of the sag are taken as examples to illustrate. In the vertical effective stress-sonic velocity (Bowles method) and vertical effective stress-density cross plots, the overpressure points fall on the unloading curve section of the second stage of normal compaction (constant porosity section), which is close to or coincides with the loading curve (Fig. 9). According to the identification basis for overpressure origin discussed above, overpressures in these two wells are identified as fluid expansion/pressure transfer origin, rather than disequilibrium compaction. In the density-sonic velocity cross plot, the overpressure points in wells MH2 and M18 fall on the trend of fluid expansion/transfer overpressure outside the loading curve (Fig. 9). Comprehensive analysis suggests that the overpressure in the west slope and central area of the sag is transfer overpressure.
Fig. 9.
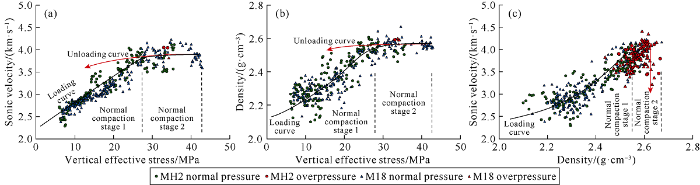
Fig. 9.
Overpressure origin identification charts by Bowers method and sonic velocity-density cross-plot method for Well MH2 in the west slope and Well M18 in the central area of the Mahu Sag.
2.4.3. Porosity comparison method
The analysis results show that the overpressure in the west slope and central area has not changed the volume attributes of the shale layers and reservoirs where it occurs significantly, but obviously changed conductivity attributes of the shale layers and reservoirs. Accordingly, the identification results of the porosity comparison method also confirm that the overpressure in the west slope and central area is caused by fluid expansion/pressure transfer (Fig. 10).
Fig. 10.

Fig. 10.
Overpressure origin identification chart by porosity comparison method for Well M18.
3. The causes and control factors of overpressure and the effects of overpressure on hydrocarbon accumulation
The identification of the above empirical methods shows that the overpressure in the main hydrocarbon-bearing series in the large conglomerate oil province in the Mahu Sag originates from pressure transfer. For overpressure originating from pressure transfer, it is critical to find out the source of pressure transfer (the mechanism of pressure generation)[11, 25, 32]. Previous studies have shown that the possible sources of overpressure in the Junggar Basin where the Mahu Sag is located are: disequilibrium compaction, tectonic compression, and hydrocarbon generation[2, 7, 33]. In this study, the causes of overpressure and the controlling factors of its formation were investigated from these three aspects, and the effects of overpressure on hydrocarbon accumulation were discussed.
3.1. Relationship between disequilibrium compaction and overpressure
Abnormal porosity resulted from well preservation of large amount of primary pores is a major evidence of the existence of disequilibrium compaction. Analysis results of shale compaction profiles of key wells in the Mahu Sag show that the density logging curves of the overpressure sections and the calculated porosities do not significantly deviate from the normal compaction trend (Figs. 3 and 4). Analysis of reservoir characteristics shows that the T1b, P3w and P2w have poor physical properties and are low permeability-tight reservoirs, with secondary pores accounting for a large proportion of the reservoir space[3-5, 7]. Consequently, there is no evidence of abnormal high porosity caused by disequilibrium compaction in the Mahu Sag.
The commonly used pressure prediction method with equilibrium depth is mainly based on the theory of disequilibrium compaction. Xu et al.[51] predicted the overpressure of the Permian and Triassic in the Manan slope area using the equilibrium depth method, but the prediction results had large errors when compared with the measured pressure. Particularly in the main overpressure series of strata below the T3b, the predicted pressure coefficients are much larger than the measured pressure coefficients. The prediction results confirm beyond doubt that the formation and distribution of overpressure in the Mahu Sag is not in accord with the law of disequilibrium compaction.
Overpressure of disequilibrium compaction origin usually turns up in Meso-Cenozoic fine-grained sediments formed in fast sedimentation and subsidence. But there was no high sedimentation and subsidence rates leading to disequilibrium compaction in the Mahu Sag. The sedimentation rate of Well MH3 in the center of the sag is 50-170 m/Ma[2] and the sedimentation rate at the slope and margin of the sag is even lower, significantly lower than those of other basins, such as the Yinggehai Basin[52] and Bohai Bay Basin[53], etc. which have typical disequilibrium compaction. Even in these basins with high sedimentation rates, analysis results from empirical methods in recent years indicate that the overpressure in them is not entirely caused by disequilibrium compaction[44].
In summary, there is little possibility that the overpressure of the reservoirs in the large conglomerate oil province of the Mahu Sag is the result of pressure transfer due to disequilibrium compaction.
3.2. Relationship between tectonic compression and overpressure
Lateral loading formed by tectonic compression is also an important pressurization mechanism[11, 25-26, 28, 50]. Comprehensive analysis has shown that, despite strong tectonic compression in the northwestern margin of the Junggar Basin where the Mahu Sag is located, the overpressure of the T1b, P3w and P2w reservoirs in the large conglomerate oil province in the Mahu Sag is unlikely to be the result of overpressure transfer caused by tectonic compression. Firstly, the above empirical method has confirmed that there is no tectonic compression-type overpressure; and secondly, the distribution law of the measured pressure coefficients is opposite to the distribution law of the strength of tectonic compression. Tectonic compression is strongest in the fault zone on the northwestern margin, gradually weakens towards the margin and slope area of the Mahu Sag, and is weakest in the center of the sag. The pressure coefficient of the main productive reservoir (the T1b) gradually increases from the fault zone on the northwestern margin and the margin of the Mahu Sag to the center of the Mahu Sag. For instance, the pressure coefficient of Well MH2 in the slope margin is 1.35, 1.53 in Well MH1 in the slope area, and over 1.6 in Well M18 in the center of the sag.
3.3. Relationship between hydrocarbon generation and overpressure
3.3.1. Overpressure depth is consistent with the depth of mass hydrocarbon generation and expulsion of the source rock
The P1f is the main source rock formation in the Mahu Sag, and part of the P2w also has some hydrocarbon generation potential[7, 34]. The P1f is generally 1000 m deeper than the T1b, and at 4000 m deep at maximum. The top interface of overpressure is consistent with the depth of mass hydrocarbon generation and the expulsion of the source rock. Taking the Mabei slope as an example, the top interface of overpressure of the T1b is at a burial depth of about 3000 m, and the corresponding burial depth of source rock is greater than 4000 m. The maturity profile of the source rock shows that the Ro value corresponding to the burial depth of about 4000 m is about 1.0% (Fig. 11), indicating that the source rock is already in a stage of mass hydrocarbon generation. This suggests that the development of overpressure may be related to mass hydrocarbon generation of source rock.
Fig. 11.
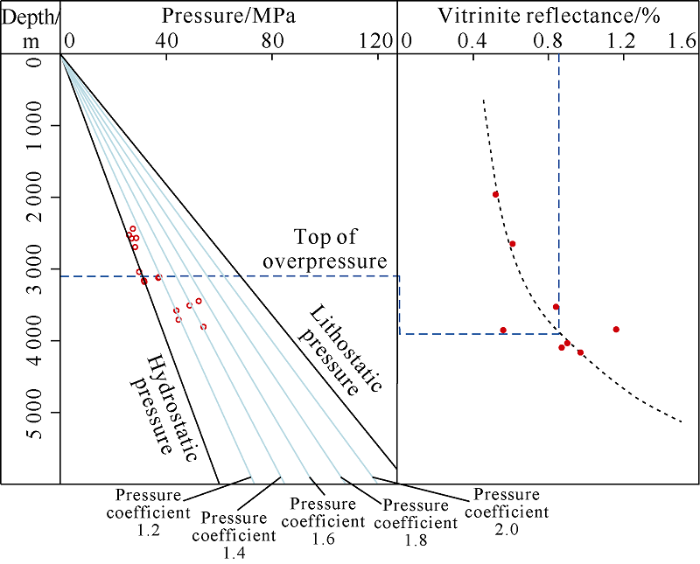
Fig. 11.
Overpressure top and source rock maturity in the Mabei slope.
3.3.2. Overpressure intensity is mainly controlled by maturity of source rock
In-depth analysis of the relationship between overpressure distribution and the major source rock of the P1f shows that the intensity of overpressure is mainly controlled by factors such as the thickness and maturity of the source rock. The control effect of maturity is the most obvious, namely, formation pressure coefficient increases with the increase of source rock maturity. It should be noted that, due to the large burial depth, the source rock of the P1f in the Mahu Sag has not been encountered in most wells, so measured maturity data of the source rock of the P1f in the sag and central area are therefore unavailable. However, maturity parameters such as gas-oil ratio, density and viscosity crude oil of the T1b (consistent with the distribution and thermal evolution of source rock and less secondary alteration) are in good agreement with the distribution of overpressure intensity. In the eastern and southern uplift areas, the source rocks are characterized by high maturity, the oil is light in quality, and the pressure coefficient is high[3, 7], reflecting that the intensity of overpressure is closely connected with the distribution and thermal evolution of the source rock. On the other hand, the basin simulation shows that, from the west slope area to the central area of the sag and the eastern uplift area, the source rocks change from mature to high-over-mature and the excessive pressure of the T1b gradually increases from less than 20 MPa to about 50 MPa[2].
3.3.3. Distribution of overpressure is closely related to the distribution of faults connecting the source rock during the main accumulation period
There are three types of faults in three stages developed in the Mahu Sag: Hercynian-Indosinian reverse faults, Indosinian-Himalayan strike-slip faults, and Middle Yanshanian normal faults[5, 54]. The Hercynian-Indosinian reverse faults mainly control the distribution of paleo-uplifts and fault steps, cut horizons from the Carboniferous to the Triassic, and are mainly distributed in the thrust fault zone on the northwestern margin of the basin and in the Xiayan and Dabasong uplifts. Affected by thrusting in the piedmont of the basin margin during the Hercynian-Himalayan, particularly in the Indosinian-Himalayan, there develop a series of nearly EW, NW-SE trending strike-slip faults with adjustment property in the Mahu Sag[5]. These strike-slip faults are characterized by small fault displacement and steep fault planes. Most of these faults cut the Permian-Triassic T1b. These faults are large in number, in rows and belts on the plane, and accompanied with the main faults. Directly communicating with the lower source rock, these faults are the main paths for oil and gas generated by the source rock of the P1f in the Mahu Sag to migrate vertically into the reservoirs of the T1b, P3w and P2w[4-7, 55]. The normal faults formed in the middle Yanshanian period primarily control the migration and accumulation of Jurassic oil and gas and has little impact on the formation and distribution of the Permian-Triassic oil and gas reservoirs.
The pressure systems of oil and gas reservoirs associated with diverse types of faults show that the distribution of overpressure is closely related to the distribution of the nearly EW, NW-SE trending strike-slip faults formed in the Indosinian-Himalayan period (Fig. 12). This suggests that this type of fault may not only be the main pathways for the vertical migration of oil and gas from the P1f into the reservoirs of the T1b, P3w and P2w, but also provide the vertical pressure transfer pathways for overpressure caused by hydrocarbon generation of the P1f source rock, which is an important manifestation that overpressure caused by hydrocarbon generation provides the main driving force for the vertical migration of oil and gas along faults.
Fig. 12.
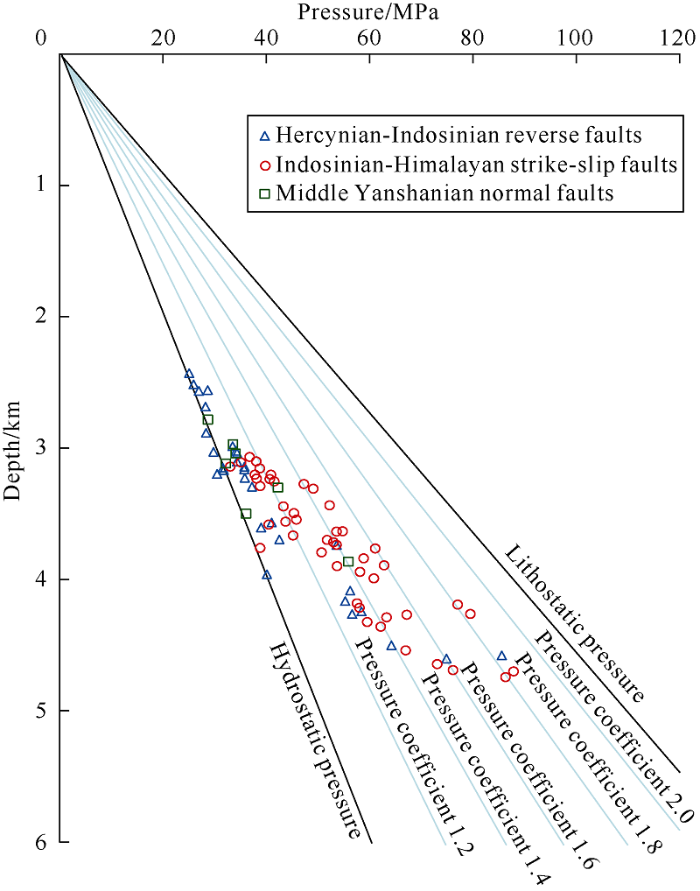
Fig. 12.
Features of pressure systems in different fault related reservoirs of the Mahu Sag.
The formation of overpressure in the reservoirs of the T1b, P3w and P2w in the Mahu Sag is most likely related to hydrocarbon generation.
3.4. Effects on hydrocarbon accumulation and significances in exploration
In summary, the source of overpressure in the large conglomerate oil province in the Mahu Sag is mainly caused by hydrocarbon generation. The formation of overpressure is the geological response to oil and gas migration and accumulation driven by overpressure caused by hydrocarbon generation. The development of overpressure is closely related to the accumulation of oil and gas in this area. The large pressure coefficient reflects that the region has experienced intensive oil and gas charge and that the accumulated oil and gas has been well preserved. For example, exploration practices of the T1b in the Manan slope area show that the overpressure well MH1 produced 39.4 t of oil and 2500 m3 of gas per day, the adjacent well MH2 also had evidence of oil and gas charging and accumulation; but Well MH3 with normal pressure had poor oil and gas shows. It is inferred through analysis that low oil and gas charging intensity or even a lack of charging is the main reason of failure in Well MH3[3, 55]. The results of drill stem test in the Mahu Sag show that, as the pressure coefficient increases, the water-oil ratio of the oil and gas reservoir gradually decreases; when the formation pressure coefficient is greater than 1.4, the fluid produced in the test is basically water free (Fig. 13), indicating that hydrocarbon abundance in the reservoirs increases with the increase of overpressure and charging intensity.
Fig. 13.
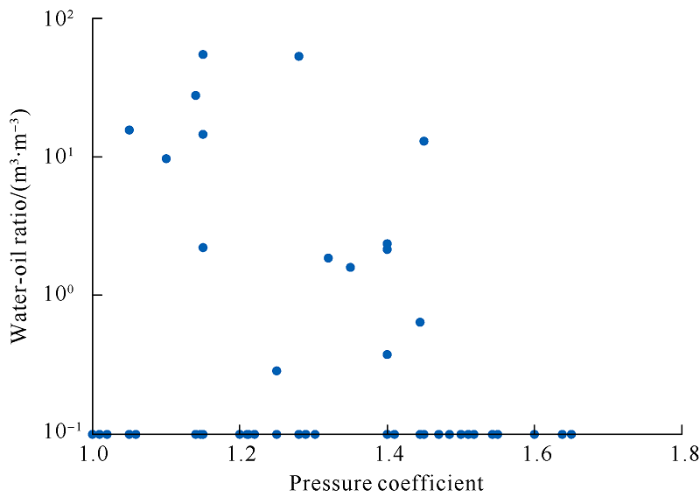
Fig. 13.
Reservoir pressure coefficient vs. water-oil ratio of wells in the conglomerate oil province in the Mahu Sag.
The research results will help break the previous understanding of "source-reservoir neighborhood" accumulation model of large-scale tight oil and gas reservoirs, open up an above-source cross-formation large-area accumulation model of tight oil and gas, and expand the field of tight oil and gas exploration. Faults developed in multiple stages connecting source rocks provide efficient migration channels between deep source rocks and above-source reservoirs. Overpressure caused by hydrocarbon generation is a crucial driving force for upward cross-formation migration of oil and gas. Thus, driven by overpressure, the hydrocarbon from the Permian main source rock migrated upward crossing several formations and formed large-scale reservoirs in the widely distributed fan-delta sedimentary reservoirs. These research results provide a basis for searching large-scale above-source reserves in the development zones of faults connecting source rocks in hydrocarbon-rich sags, and also make profitable exploration of medium and shallow layers in sags with deep source rocks possible. In addition to the major oil-bearing formations, such as the T1b and P3w, the P2w and other above-source strata series in the Mahu Sag are expected to have great exploration potential. These research results also provide a reference for exploration of other hydrocarbon-rich sags in the Junggar Basin and above-source oil and gas accumulation in other basins. Identifying the cause and distribution of overpressure may be the key to the exploration and development of hydrocarbon accumulations far from source formation.
4. Conclusions
The characteristics of normal compaction of shale in the large conglomerate oil province in the Mahu Sag of the Junggar Basin vary in different regions, and at least two normal compaction models can be identified. The Xiayan and Dabasong uplifts conform to the common exponential compaction model, while the west slope and central area of the sag accord with the two-stage linear compaction model. The identification methods for various overpressure origins under the two-stage linear compaction model have been summarized, including the multi-logging combination method, Bowers method and sonic velocity-density cross-plot method.
Overpressure in the large conglomerate oil province reservoirs in the Mahu Sag is primarily caused by pressure transfer. The overpressure source is overpressure formed by fluid expansion of the main source rocks (the P1f) caused by hydrocarbon generation. The formation and distribution of overpressure are mainly controlled by the thickness and maturity of the source rock and the strike-slip faults connecting the source rock in the Indosinian-Himalayan period. Driven by overpressure caused by hydrocarbon generation, oil and gas generated by the source rock migrated along faults and other pathways into the reservoirs to accumulate, thereby forming the Permian/Triassic overpressure reservoirs.
Overpressure is the main driving force for the migration of long-span separation reservoirs of source-reservoir in the large conglomerate oil province in the Mahu Sag. The formation and distribution of above-source oil and gas reservoirs are closely associated with the development of overpressure.
Reference
A new breakthrough in exploration of large conglomerate oil province in Mahu Sag and its implications
Abnormal pressure distribution and formation mechanism in Mahu Sag, Junggar Basin
Accumulation mechanism and enrichment rules of the continuous hydrocarbon plays in the Lower Triassic Baikouquan Formation of the Mahu Sag, Junggar Basin
DOI:10.11764/j.issn.16721926.2016.02.0241
URL
[Cited within: 6]

Hydrocarbon exploration in the Mahu Sag of the northwestern Junggar Basin has recently gained a significant discoverycontinuous oil plays in the Lower Triassic Baikouquan Formation glutenite reservoir with a proven oil reserve of hundreds of millions tons,which is characterized by an extensive hydrocarbon accumulation far from source sequences.This displays significance of fundamental and practical studies.Here,to improve the theory and practice of the accumulation of this discovery,we address the accumulation mechanisms and enrichment rules of the hydrocarbon accumulations.Results show that there are three favorable conditions for the hydrocarbon accumulation in general:Large hydrocarbon resource base,good reservoir and overlying and underlying preservation conditions,and well matched hydrocarbon charge and evolution.The hydrocarbon accumulation has three special characteristics.High quality lacustrine source rocks provide a good resource base.Largescale transverse faults communicating with source and reservoir sequences make the longdistance migration possible.Fandelta sedimentary system provides good conditions for reservoir and continuous hydrocarbon occurrence.The enrichment of hydrocarbon accumulation is controlled by three elements:prodelta sedimentary facies,structural high points and faults.Abnormal reservoir overpressure and fractures have important impacts on hydrocarbon production.The combination of these controls decides the future favorable exploration targets.
Discovery and hydrocarbon accumulation mechanism of quasi-continuous high-efficiency reservoirs of Baikouquan Formation in Mahu Sag, Junggar Basin
Discovery, distribution and exploration practice of large oil provinces of above-source conglomerate in Mahu Sag
Study on the forming conditions and exploration fields of the Mahu Giant Oil (Gas) Province, Junggar Basin
Large-area petroleum accumulation model of the Triassic glutenite reservoirs in the Mahu Sag, Junggar Basin: Triple controls of fan, fault and overpressure
Seismic sedimentologic study of facies and reservoir in middle Triassic Karamay Formation of the Mahu Sag, Junggar Basin, China
DOI:10.1016/j.marpetgeo.2019.05.012 URL [Cited within: 1]
Reservoir quality variations within a conglomeratic fan-delta system in the Mahu Sag, northwestern Junggar Basin: Characteristics and controlling factors
DOI:10.1016/j.petrol.2017.03.002 URL [Cited within: 1]
New concepts for deepening hydrocarbon exploration and their application effect in the Junggar Basin
DOI:10.1016/S1876-3804(19)30001-1 URL [Cited within: 1]
Advances in the origin of overpressures in sedimentary basins
How down hole temperature, pressure affect drilling, part 3: Overpressure detection from wireline methods
Abnormal formation pressure, implication to exploration, drilling, and production of oil and gas reservoirs
Shale porosities from well logs on Haltenbanken (offshore mid-Norway) show no influence of overpressuring
Detecting high overpressure
DOI:10.1190/1.1452608 URL [Cited within: 5]
Pore pressure estimation from velocity data: Accounting for overpressure mechanisms besides under compaction
Determining an appropriate pore-pressure estimation strategy
Influence of clay diagenesis on shale velocities and fluid-pressure
Geologically-driven pore fluid pressure models and their implications for petroleum exploration: Introduction to thematic set
DOI:10.1111/gfl.2011.11.issue-4 URL [Cited within: 3]
Evidence for overpressure generation by kerogen-to-gas maturation in the northern Malay Basin
DOI:10.1306/09041212032 URL [Cited within: 4]
The lack of relationship between overpressure and porosity in North Sea and Haltenbanken shales
DOI:10.1016/S0264-8172(98)00035-X URL [Cited within: 2]
Origin of overpressure and pore-pressure prediction in the Baram Province, Brunei
DOI:10.1306/08080808016 URL [Cited within: 3]
Origin of overpressures in shales: Constraints from basin modeling
Overpressure generation by load transfer following shale framework weakening due to smectite diagenesis
DOI:10.1111/gfl.2011.11.issue-4 URL [Cited within: 3]
Origin of over-pressure in clastic rocks in Yuanba Area, northeast Sichuan Basin, China
Vertically transferred overpressures in Brunei: Evidence for a new mechanism for the formation of high-magnitude overpressure
DOI:10.1130/G23906A.1 URL
Origins of overpressure tight gas reservoirs in the Xujiahe Formation, northeastern Sichuan Basin
Systemic analysis on the potential causes of the overpressure in the northeastern Sichuan basin shows that the overpressures in tight gas reservoirs in Xujiahe Formation has been resulted mainly from the hydrocarbon accumulation and tectonic compression during the medium Yanshian to the Himalaya period, rather than compaction disequilibrium. By the SRK gas state equation, the pressure value of 25.21 MPa is calculated in Yuanba gas reservoirs, which indicates that there is an average pressure amplitude of 60.86% and resulted from hydrocarbon accumulation. Meanwhile, the pressure value of 45.81 MPa is calculated in Tongnanba gas reservoirs, which has average pressure amplitude of 72.04%. The additional excess pressures have been generated mainly by tectonic compression, which account for 39.14% and 27.96% of the excess pressures in Yuanba gas reservoirs and Tongnanba gas reservoirs respectively. The difference of the tectonic compression intensity during the Medium Yanshanian and Himalaya period controlled the distribution of present pressure, the distribution of stress release area as well as the pressure-temperature reducing extent for tectonic uplift. The Tongnanba area is located in stress release area nowadays, and the pressure reducing process after hydrocarbon accumulation and tectonic compression is the major cause of the currently lower pressure than in the Yuanba area.
Identification and calculation of transfer overpressure in the northern Qaidam Basin, northwest China
Overpressure mechanisms in compressional tectonic Borneo deepwater fold-thrust belt
Control of main expelling pathway for overpressure fluid on gas migration and accumulation in Kelasu Thrust Belt of Kuche Depression
Factors controlling petroleum accumulation and leakage in overpressured reservoirs
DOI:10.1306/01021514145 URL [Cited within: 1]
Generation and evolution of overpressure caused by hydrocarbon generation in the Jurassic source rocks of the central Junggar Basin, northwestern China
DOI:10.1306/1213181614017139 URL [Cited within: 2]
Geochemistry and origin of natural gas in the petroliferous Mahu Sag, northwestern Junggar Basin, NW China: Carboniferous marine and Permian lacustrine gas systems
DOI:10.1016/j.orggeochem.2016.08.004 URL [Cited within: 2]
Shale compaction and its relationship to fluid seals.
Relation of shale porosities, gas generation, and compaction to deep overpressures in the U.S. Gulf Coast
Petroleum geology and geochemistry
Geopressure field and its relation to petroleum migration in Qiongdongnan Basin
Fan delta group characteristics and its distribution of the Triassic Baikouquan Reservoirs in Mahu Sag of Junggar Basin
Origin of abnormal pressure in the Upper Paleozoic shale of the Ordos Basin, China
DOI:10.1016/j.marpetgeo.2019.07.016 URL [Cited within: 3]
Relationships between pore pressure and stress in different tectonic settings
Analysis of overpressure on the Gulf of Mexico shelf
Origins of overpressure in the Malay Basin and its influence on petroleum systems. Durham,
Oil generation as the dominant overpressure mechanism in the Cenozoic Dongying Depression, Bohai Bay Basin, China
DOI:10.1306/05191009179 URL [Cited within: 1]
Estimation of multiple sources of overpressures using vertical effective stress approach: Case study of the Niger delta, Nigeria
Unloading mechanism indications in overpressure: A Niger delta example, ASSN Field
Magnitude, mechanisms, and prediction of abnormal pore pressure using well data in the Krishna-Godavari Basin, east coast of India
DOI:10.1306/05131615170 URL [Cited within: 2]
Variation in vertical stress in the Baram Basin, Brunei: Tectonic and geomechanical implications
The role of shale pore structure on the sensitivity of wire-line logs to overpressure
Predicting pore pressure in active fold-thrust systems: An empirical model for the deepwater Sabah Foldbelt
DOI:10.1016/j.jsg.2014.07.013
URL
[Cited within: 2]
Measurements related to mudrock (shale and siltstone) porosity such as acoustic velocity, density or electrical resistivity, have traditionally been used to predict pore pressures in extensional stress settings. The underlying assumption is that burial and vertical effective stress (VES), which is the overburden minus the pore pressure, controls the compaction of these rocks through porosity loss. The dataset presented here compares VES and acoustic velocity of similar composition mudrocks in both an extensional and a compressional stress setting. In the extensional stress environment, the mudrocks follow a typical compaction trend with a porosity loss and increase in acoustic velocity that can be related to VES. In an active fold-thrust belt, the compressive stresses further reduce the porosity and increase the acoustic velocity of the mudrocks. First a layer-parallel shortening compacts sediments beyond what is observed for the VES. This additional compaction is further enhanced near thrust faults and in anticlinal forelimbs, presumably due to additional shear stress in these areas. The mudrocks located in folds that are buried by additional sedimentation do not compact again until the tectonic compaction is overridden by enough new burial. After that, the mudrocks follow the observed extensional setting compaction trend. In the fold-thrust belt, the observed reduction in porosity by stresses other than burial leads to an under-prediction of pore pressure using traditional methods. To account for this, we present a correction that can be applied to the acoustic velocity (or porosity) using two parameters: (a) proximity to thrust faults and anticlinal forelimbs and (b) the amount of burial after fold formation. With these corrections, the extensional velocity-VES compaction trend can be used to accurately predict pore pressure within the active fold-thrust belt. The correction is calibrated with well data and is empirical. None-the-less, it is a first step toward understanding the magnitudes of the compressive lateral stresses involved in generating the observed porosity loss within the fold thrust belt. (C) 2014 Elsevier Ltd.
Application of abnormal formation pressure prediction technologies in Junggar Basin
Overpressure system of hydrocarbon-bearing basins in China
Fault characteristics and control on hydrocarbon accumulation of middle-shallow layers in the slope zone of Mahu Sag, Junggar Basin, NW China
