


Introduction
When abnormal high pressure formations are encountered in deep waters, gas kick is likely to occur, even causing serious blowout. For example, the Deepwater Horizon oil spill and blowout happened in 2011[1] caused heavy human casualties, huge economic losses, and destruction of the marine ecological environment. As an important part of well control technology in deep water drilling, the earlier the gas kick is detected, the smaller the volume of influx gas, the lower the bottom hole pressure change and the higher the probability of successful well control will be.
At present, there are three kinds of gas kick detection methods: detection method on platform, detection method in seawater, and downhole detection method while drilling[2,3]. Detection on platform is simple and convenient, but low in accuracy, the detected time of gas kick by this method lags way behind the occurrence time of the gas kick. Downhole detection method while drilling can compensate the distortion and delay of the above method, but the signals of this method may attenuate or even disappear in the process of transmission. Moreover, this method is costly and not suitable for high temperature and high pressure conditions. Detection methods in seawater, such as acoustic wave monitoring method, can detect gas kicks more quickly. But the undulation of drilling platform with seawater causes interference to the monitoring equipment, making it difficult to identify the characteristic signals. There is a 500-3000 m riser exposed to seawater[4] in a deep water drilling system. Instead of expensive downhole detection, detecting gas kick outside the riser is safer and more efficient.
The Doppler ultrasonic wave technique has been used widely in medical imaging[5,6], nondestructive testing[7,8], and flow measurement[9,10]. It has the advantages of no direct contact with the measured fluids, low cost and simple tool structure. Nguyen et al.[10] proposed a method based on ultrasonic propagation velocity section to measure flow velocity and void fraction of bubble flow. Abbagoni et al.[11] used an ultrasonic sensor and an artificial neural network to identify the flow regime of two-phase flow. Sui, Geng, Li et al.[12,13,14] did experiments to detect gas kicks with Doppler ultrasonic wave. They found the influx gas could cause attenuation of Doppler ultrasonic wave. Due to the limitations of experimental equipment and methods of signal processing, they only gave a qualitative relationship between gas void fraction and Doppler signal, but failed to find the quantitative relationship between them. In addition, the method they proposed isn’t applicable to the situation without circulation at drilling stops, and doesn’t consider the effect of drilling fluid viscosity.
Based on the theory of gas-liquid two phase flow, the feasibility of gas kick detection outside the riser above mud line was demonstrated. Then, an experimental platform of gas kick monitoring was designed according to the propagation characteristics of Doppler ultrasonic wave; experiments of Doppler ultrasonic wave propagation in two-phase flow of gas and water (sucrose solution) were conducted; and the experimental data was analyzed in the time and frequency domain to find out the quantitative relation between Doppler signal and gas void fraction. The feasibility and correctness of gas kick early detection with Doppler ultrasonic wave outside the riser were verified.
1. Feasibility analysis of gas kick detection outside the riser
After gas kick occurs, multiphase flow of drilling fluid, cuttings, and influx gas would appear in the wellbore annulus. Some researchers have studied multiphase flow during gas kick[15,16,17]. Considering phase change and dissolution of gas in drilling fluid, Sun et al. proposed a multi-component and multi-phase flow model[17], and described the flow pattern transition in detail. Their predicted results with the model were in good agreement with field data. The Sun’s model was used to simulate the gas kick. A deep water well in the South China Sea was taken as an example. The well is at the water depth of 1500 m. At 3500 m, the well was drilled at the pump displacement of 30 L/s, with drilling fluid of 1.2 g/cm3 in density. The formation pressure was 33 MPa, and formation temperature was 105 °C. When the initial gas void fractions (Hg) were 1%, 3%, and 5% respectively, the predicted curves of the Hg with well depth are shown in Fig. 1. The predicted increments of drilling fluid in pit (shortened as pit gain) with gas kick time are shown in Fig. 2.
Fig. 1.
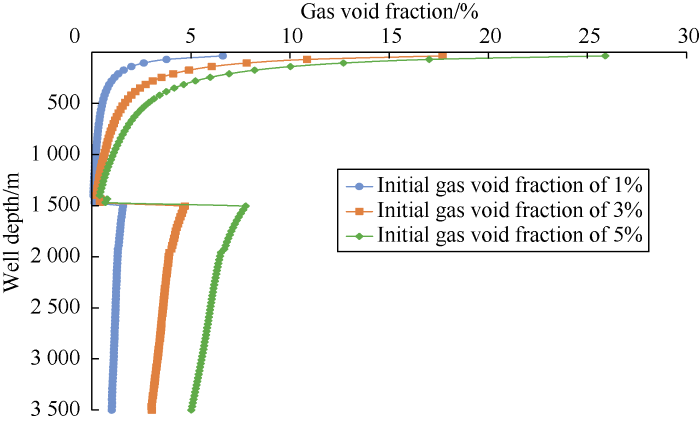
Fig. 1.
Relationship between gas void fraction and well depth.
Fig. 2.
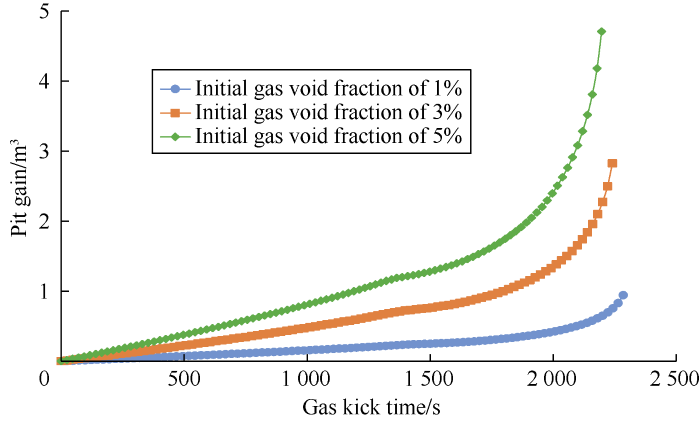
Fig. 2.
Variation of pit gain with gas kick time.
As shown in Fig. 1, the gas void fraction increases rapidly when the well depth is less than about 500 m. It is too late to control the well if the gas kick is detected at this moment, and the gas kick could lead to a blowout out of control. From the simulated results and Fig. 2, the corresponding times for the invading gas to rise from well bottom to sea level in three cases were 2304.93, 2259.46, and 2214.24 s respectively. The commonly used method for gas kick detection is to monitor the pit gain. If the pit gain is greater than 1 m3, an alarm will be sounded. However, for the case with Hg of 1%, the total pit gain is less than 1 m3 when the influx gas reaches the sea level. Hence, this pit gain method can’t detect the gas kick. For the case with Hg of 3%, the pit gain is 1 m3 when the invaded gas rises to the well depth of 803 m, and gas kick time is 1796.32 s at this point. If the gas kick is detected at this moment, there is no more than 463.14 s left to handle the gas kick. If the gas kick is detected at the mudline of about 1500 m deep, the pit gain is only 0.73 m3 and the gas kick time is 1376.11 s, and there would be 883.35 s left to kill the well. This is almost 420.21 s earlier than the conventional method. Therefore, the gas kick can be detected earlier if monitoring outside the rise, leaving longer time to handle the gas kick, and ensuring safer drilling.
2. Construction of experimental platform for gas kick early detection
2.1. Gas kick detection principle based on Doppler ultrasonic wave propagation
As shown in Fig. 3, the Doppler ultrasonic transmitter as a fixed sound source emits ultrasonic wave into the pipeline. When the emitted ultrasonic wave encounters bubbles moving together with the fluid during propagation, the ultrasonic wave will reflect on the bubble surfaces, causing a frequency difference between the received and emitted ultrasonic waves. This is the Doppler frequency shift resulting from the movement of bubbles in the fluid. The Doppler frequency shift of a single reflected wave is expressed as:
Because the propagation velocity c of the ultrasonic wave in the fluid is much larger than the flow velocity u of the fluid, ucosα can be omitted. The equation (1) can be simplified as:
In a gas-liquid two phase flow, the bubble is the reflector of Doppler signal. The velocity, volume, and quantity of bubbles are main factors affecting the Doppler signal. When a gas kick occurs, bubbles will become the reflection sources of the Doppler signals, causing frequency change of some signals. The gas kick detection method with Doppler ultrasonic wave uses this change to monitor the gas void fraction inside the riser. When gas gets into the drilling fluid, a frequency difference would occur between the emitted and received ultrasonic waves, and the frequency difference varies with the gas void fraction. Therefore, the gas void fraction can be monitored.
Fig. 3.
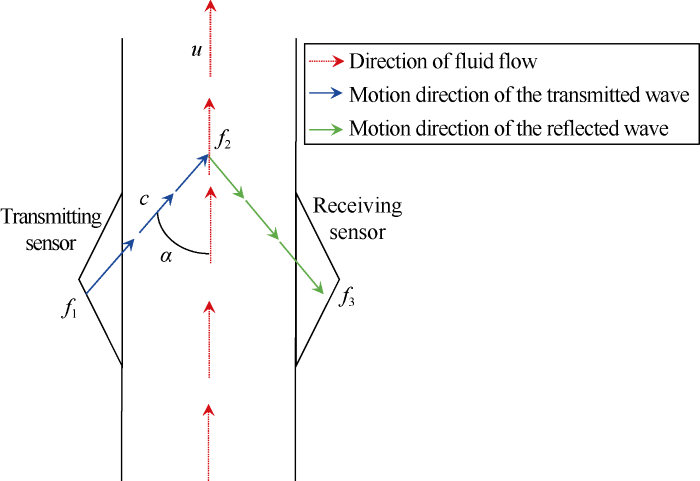
Fig. 3.
Sketch of gas kick detection with Doppler ultrasonic wave.
2.2. Design and construction of the experimental platform
Based on the above principle, we constructed an experimental platform for gas kick early detection, as shown in Fig. 4. It includes a main circulation system, a liquid injection and discharge system, a bubble breaking system, and a signal detecting system.
This experimental platform can be used to study the variation of Doppler ultrasonic wave signal with flow velocity, gas void fraction, and liquid properties (such as density, viscosity, etc.), and the variation of flow pattern with gas void fraction.
Fig. 4.
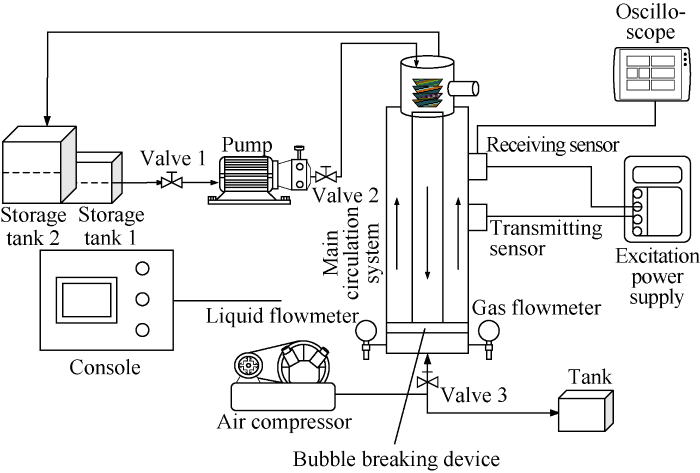
Fig. 4.
Diagram of the experimental platform.
3. Gas kick early detection method
3.1. Propagation experiments of Doppler ultrasonic wave in gas-water two phase flow
Experiments of Doppler ultrasonic wave propagation were conducted when the pump was on and off. The Doppler signals were processed by time domain analysis and frequency domain analysis[18].
3.1.1. Time domain analysis of Doppler ultrasonic wave signals
(1) Time domain analysis of signals obtained when the pump was stopped: the experiments were conducted under the conditions that the circulation pipe was filled with water and the pump was off. The gas void fraction varied from 0 to 46%. The voltage signals at 22 different gas void fractions were collected. We counted the frequencies of 10 000 points in 0.1 s in different voltage ranges at the gas void fractions of 2.4% and 35.2%, and a histogram was plotted (Fig. 5). It can be seen most signals fall in the voltage range between -1 V and 1 V. As the gas void fraction increases, the number of the low voltage signals (absolute value of 0-1 V) decreases, and the number of the high voltage signals (absolute value of 1-2 V) increases. The normal distribution curve becomes flatter as the gas void fraction increases.
Fig. 5.
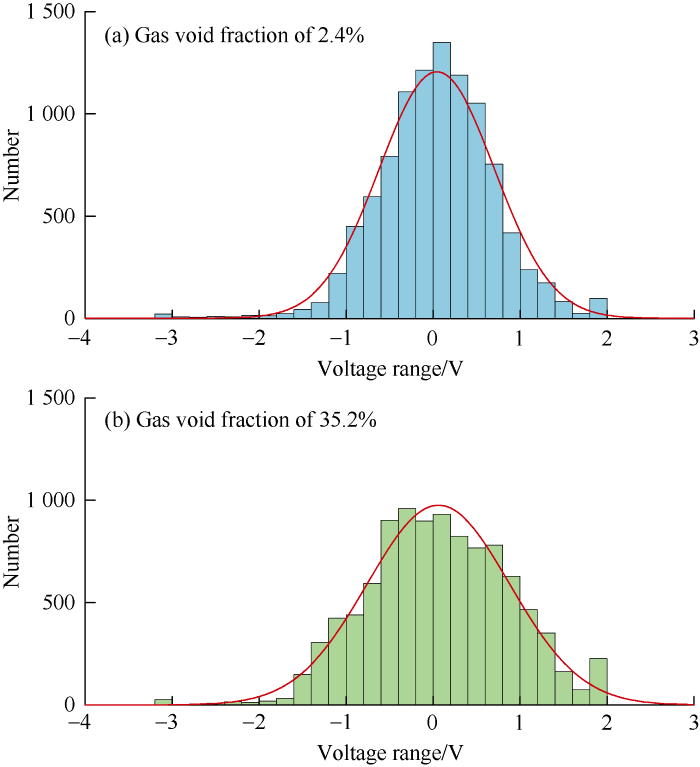
Fig. 5.
Number of signals in different voltage ranges at different gas void fractions.
We took the average of absolute values of the voltage of all the signals of 10 000 points in 0.1 s at fixed gas void fraction and plotted the relationship curve between the average value and the gas void fractions (Fig. 6). It can be seen that the average signal voltage first rises and then falls as the gas void fraction increases. When the gas void fraction is less than 22.5%, the increment of signal voltage caused by the multi- reflection is more than the attenuation of ultrasonic wave, so the average signal voltage increases with the increase of gas void fraction. When the gas void fraction is greater than 22.5%, as the volume occupied by the gas becomes larger and larger, the attenuation of the ultrasonic wave amplitude is greater than the amplitude increase caused by multiple reflection, and this trend would get stronger as the gas void fraction increases. Consequently, the average voltage of the signals would decrease constantly.
Fig. 6.
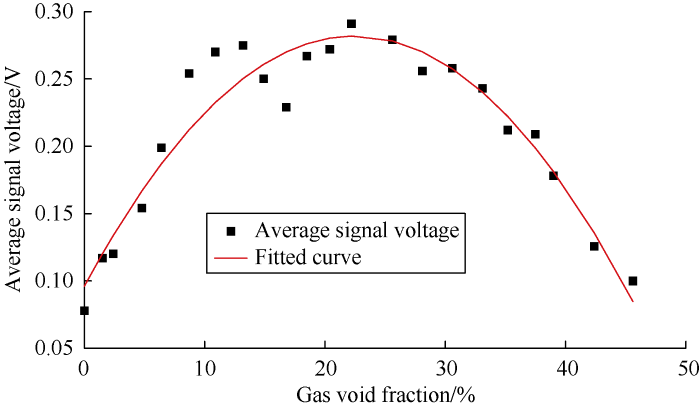
Fig. 6.
The relationship between the average voltage of signals and gas void fraction during pump stopping.
The scatter points of average signal voltages and gas void fractions were fitted into a quadratic function:
According to this equation, the approximate value of gas void fraction can be calculated when the average signal voltage is given.
(2) Time domain analysis of signals collected when the pump was on: The pump was open for circulation. When the flow velocities in the pipe were stabilized at 0.40 m/s and 0.65 m/s, the gas injected into the pipe gradually increased to simulate the variation of Doppler signals at different gas void fractions. 22 groups of voltage signals were taken at each velocity. The relationships between the average signal voltage and gas void fraction at different velocities are shown in Fig. 7. It can be seen that the average signal voltage first increases and then decreases as the gas void fraction increases, similar with the situation when the pump is off.
Fig. 7.
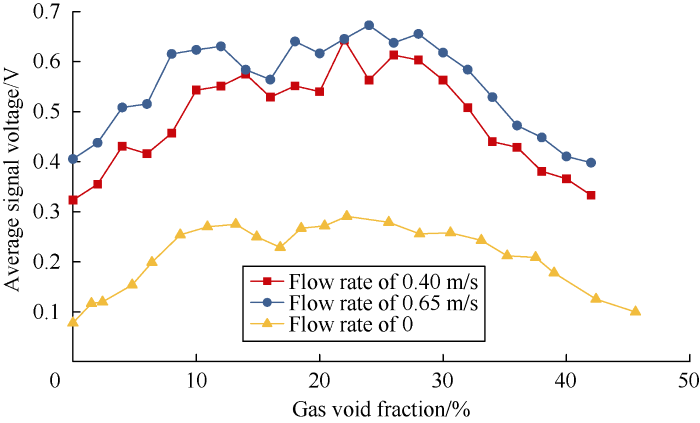
Fig. 7.
The relationship between the average signal voltage and gas void fraction during pumping.
The average signal voltage values when the pump is on are higher than those when the pump is off, but they vary in similar pattern. The peak points of average signal voltage values during pumping appear at the gas void fraction between 20% and 25%, which is close to the gas void fraction of 22.5% when the pump is off. The scatter points of average signal voltages and gas void fractions at the flow velocities of 0.40, 0.65m/s were fitted into two quadratic functions.
At 0.40 m/s, the function is:
At 0.65 m/s, the function is:
The symmetry axes of the equations (3)-(5) are 22.5%, 21.0% and 20.2% respectively. It can be seen that the three formulas are similar in form, so they can be expressed by the same quadratic function:
In this quadratic function, the symmetry axis is (21.85± 1.65)%; the values of a and b are related to the flow rate and signal voltage strength. Equation (6) reflects the relationship between the average signal voltage and gas void fraction quantitatively.
3.1.2. Frequency domain analysis of Doppler ultrasonic wave signals
(1) Frequency domain analysis of signals collected when the pump is off: The 22 sets of signal data collected when the pump is off previously were made Fourier transform to obtain the corresponding amplitude spectra. As the ordinate values of the amplitude values are too small for comparison and observation, the amplitude values were transformed into logarithmic form. Fig. 8 shows the amplitude spectrum after logarithmic transformation at the gas void fraction of 0. To investigate the influence of gas void fraction on Doppler frequency shift, we used the peak point around 18 000 Hz as a reference point with the abscissa of 18 620 Hz to compare the changes of frequency corresponding to this peak point at different gas void fractions. When the gas void fraction was 0, there was only water in the circulation pipe, the frequency of ultrasonic wave did not change much during propagation. Thus, the frequency difference between the receiving and transmitting frequencies was close to 0. When gas was injected into the circulation pipe, Doppler frequency shift occurred when the ultrasonic wave passed through the bubbles. It is found from the amplitude spectrum at the gas void fraction of 2.4% that the dominant frequency peak point also appeared near 18 000 Hz. The frequency corresponding to this peak point is 18 630 Hz. This frequency is subtracted from the frequency of 18 620 Hz corresponding to the gas void fraction of 0, and the Doppler frequency shift difference is 10 Hz.
Fig. 8.
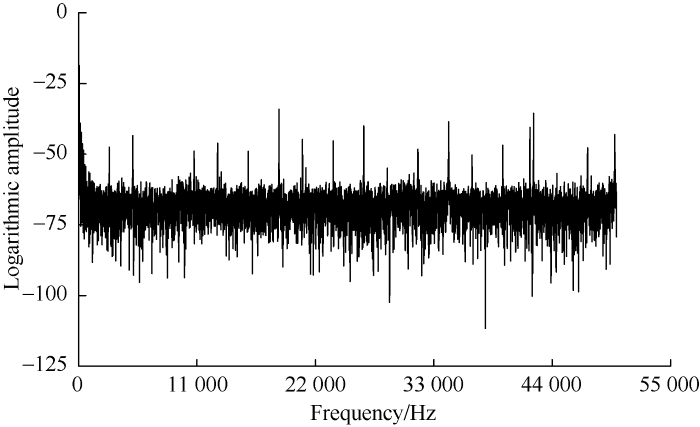
Fig. 8.
Amplitude spectrum after logarithmic transformation at gas void fraction of 0.
After Fourier transform and peak point search in target area, the frequency shifts of the remaining 20 sets of data at different gas void fractions were worked out as shown in Fig. 9. It can be seen that the Doppler frequency shift increases with the increase of gas void fraction. When the gas void fraction reaches 45%, the Doppler frequency shift reaches 150 Hz.
Fig. 9.
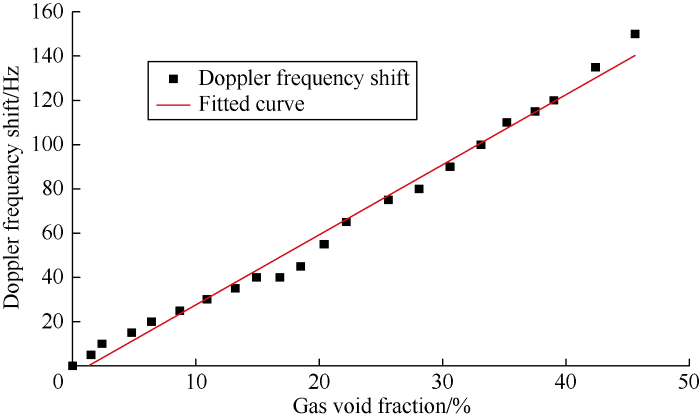
Fig. 9.
The fitted curve of Doppler frequency shift versus gas void fraction when pump is off.
The scatter points of Doppler frequency shift versus gas void fraction were fitted into a linear function:
Therefore, Doppler frequency shift can also be used to quantitatively describe the variation of gas void fraction during pump stopping without circulation.
(2) Frequency domain analysis of signals collected during pumping: The 22 groups of signal data previously collected when pump was on were made Fourier transform and logarithmic transform to obtain the corresponding amplitude spectra (Fig. 10). Compared with the amplitude when pump was off, the amplitude values during pumping increase significantly, and the amplitude values at the flow velocity of 0.65 m/s are slightly higher than those at the flow velocity of 0.40 m/s overall. This is because the displacement of pump depends on pump pressure, the greater the pump pressure, the greater the frequency of the converter is, and the greater the contribution of energy generated during the operation to the amplitude is. By analyzing the amplitude spectra at the flow rates of 0.4 m/s and 0.65 m/s, it is found that the main frequency is the same 16 000 Hz at the gas void fraction of 0 under the two different flow velocities.
Fig. 10.
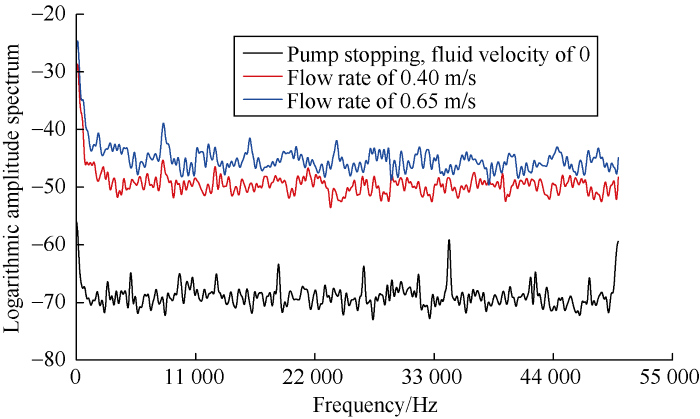
Fig. 10.
Amplitude spectra when pump is on and off at the gas void fraction of 0.
Fig. 11 shows the frequency spectra at five gas void fractions of 0, 10%, 20%, 30%, 40% and the flow velocity of 0.65 m/s. It can be seen that the five sets of amplitude spectrum curves are basically the same in configuration, and there is no main frequency shift. Moreover, all the peak points correspond to the frequency of 16 000 Hz, clearly, the change of gas void fraction has no effect on the peak point. The data collected at the flow velocity of 0.40 m/s follows the same law. This means that the contribution of sound energy generated by the inverter to the amplitude spectrum exceeds the influence of gas void fraction when the pump is open. Therefore, it is impossible to judge whether a gas kick occurs with this method.
Fig. 11.
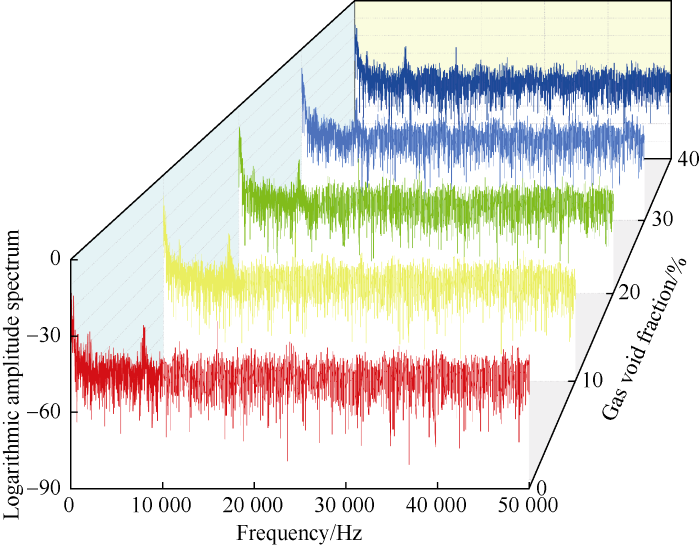
Fig. 11.
The influence of gas void fraction on amplitude spectra at the flow velocity of 0.65 m/s.
3.2. Experiments of Doppler ultrasonic wave propagation in gas-sucrose solution two-phase flow
Harker et al.[19] found that the propagation of Doppler ultrasonic wave was mainly affected by drilling fluid viscosity of and solid particles. Due to the small gap in the bubble breaking device at the bottom of the main circulating pipe, solid particles are highly likely to block the experimental device and thus disrupt the experiment. Therefore, the influence of solid particles on Doppler ultrasonic wave propagation could not be simulated. Instead, the density of drilling fluid was changed by increasing sucrose content, and the viscosity of drilling fluid was changed by adding polyacrylamide (PAM) to test the influence of density and viscosity on Doppler ultrasonic wave propagation in this experiment.
The sucrose solution with a density of 1.15 g/cm3 was prepared in the storage tank, and the Doppler ultrasonic wave propagation experiment in this solution was carried out. After this experiment, the density of the sucrose solution was increased to 1.22 and 1.30 g/cm3 respectively. The viscosity of the three solutions was tested by a Brookfield viscometer. The viscosity of sucrose solutions with a density of 1.15, 1.22 and 1.30 g/cm3 were 2.5, 3.6 and 4.8 mPa•s, respectively.
The same time-domain and frequency-domain signal analysis methods were used to analyze the Doppler ultrasonic wave signals in sucrose solution when pump was off and on.
3.2.1. Time domain analysis of Doppler ultrasonic wave signals
(1) Time domain analysis of signals collected when pump is off: 23 groups of experiments in sucrose solutions of different densities and gas void fractions from 0 to 45% were conducted. Fig. 12 shows the variations of signal voltage with time in water and the three sucrose solutions with different densities at the gas void fraction of 20%. It can be seen that the amplitude of the signal voltages decrease slightly with the increase of solution density at the same gas void fraction. This means that the attenuation degree of the ultrasonic wave increases slightly with the increase of solution density, and thus the signal voltage amplitude reduces slightly. Apparently, solution density has little impact on the signals.
Fig. 12.
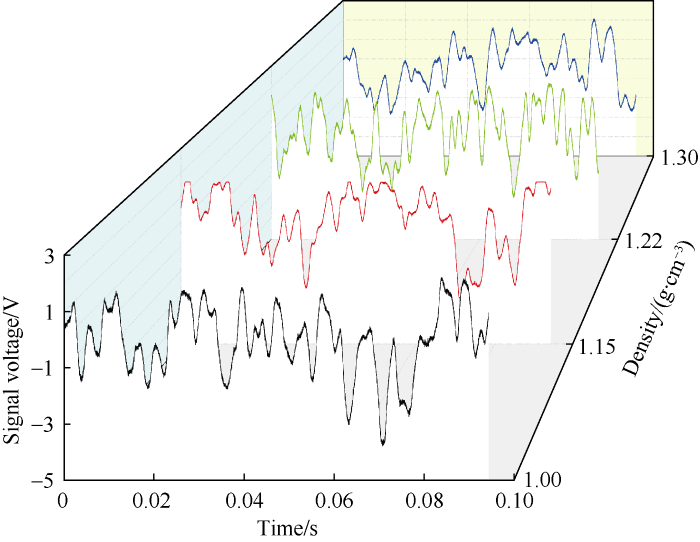
Fig. 12.
The influence of solution density on signal voltage at the gas void fraction of 20%.
We studied the effect of viscosity on the signal voltage byusing sucrose solution with a density of 1.30 g/cm3. PAM was added into the solution to make its viscosity increase to 35.46 mPa·s. The bubbles in the original solution were small in size, after PAM was added into the solution, the bubbles were much larger (Fig. 13).
Fig. 13.

Fig. 13.
Comparison of bubble sizes in sucrose solutions before and after PAM added at the gas void fraction of 18%.
Fig. 14 shows the relationships of the average signal voltage with gas void fraction of 5 kinds of solutions. It can be seen that the average signal voltage increases first and then decreases with the increase of gas void fraction. The average signal voltages of the four different density sucrose solutions without PAM differ little in amplitude, and decrease slightly with the increase of the solution density. The maximum average signal voltages of the four solutions all occur at the gas void fraction between 20% and 25%. The average signal voltage of the sucrose solution with PAM decreases significantly. When the gas void fraction was less than 20%, affected by viscosity, most of the bubbles moved upward in the form of large bubbles, and the number of bubbles in unit volume decreased, the total area of gas-liquid interfaces decreased, and multi-reflection of the ultrasonic wave at the gas-liquid interface weakened, so the average signal voltages of the solution with PAM were lower than those of the other four solutions without PAM. When the gas void fraction exceeded 20%, the number of bubbles in the pipe increased, and the gasliquid interface area increased too. But the reduction of signal voltage caused by attenuation of the ultrasonic wave is larger than the effect of multi-reflection. Moreover, with the increase of gas void fraction, the degree of ultrasonic attenuation increases, so the average signal voltage decreases subsequently.
Fig. 14.
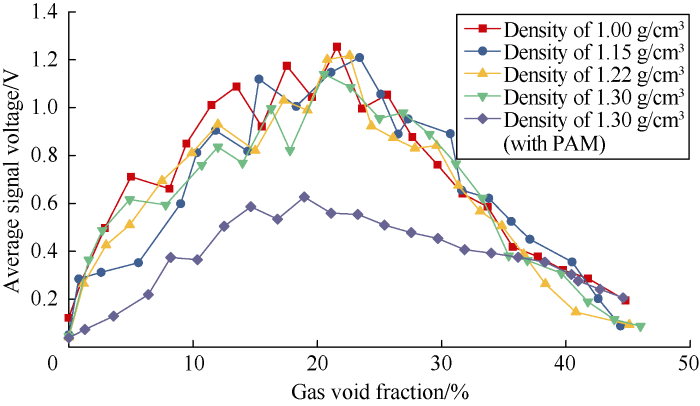
Fig. 14.
Variations of average signal voltage with gas void fraction of different solutions.
The relations of the average signal voltage and gas void fraction of solutions with different densities were fitted from the scatter points shown in Fig. 14. The fitted relations are as follows:
For the solution with a density of 1.15 g/cm3:
For the solution with a density of 1.22 g/cm3:
For the solution with a density of 1.30 g/cm3:
For the solution with a density of 1.30 g/cm3 with PAM added:
The symmetry axes of the equations (8) -(11) are 21.6%, 20.5%, 20.9% and 23.5% respectively. The equations are all in quadratic function form, and can be expressed by equation (6).
(2) Time domain analysis of signals collected when the pump was on: When the pump was open, experiments with sucrose solutions of 1.22, 1.30 g/cm3 in density and sucrose solution with PAM added of 1.30 g/cm3 in density were conducted to obtain the variation curves of signal voltage with gas void fraction (0-45%) at the liquid flow velocities of 0, 0.40, 0.65 m/s (Fig. 15). It can be seen from the figure that the average signal voltage increases with the increase of flow velocity in general. The average signal voltage increases first and then decreases with the increase of gas void fraction. Under the three flow velocities, the maximum signal voltages all occur in the gas void fraction between 20% and 25%. The average signal voltages at the gas void fractions of 0 and more than 40% are all very small. In the experiment of sucrose solution with PAM higher in viscosity than the pure sucrose solutions, the average signal voltages at different flow velocities decrease somewhat than those in the experiments with the pure sucrose solutions, and increase and decrease slower.
Fig. 15.
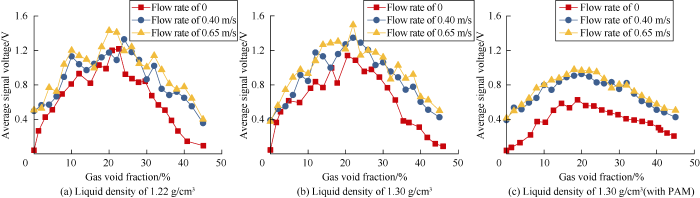
Fig. 15.
Variations of average signal voltages with gas void fraction of different density sucrose solutions.
The fitted curves of the average signal voltage with gas void fraction of 1.30 g/cm3 sucrose solution at different flow velocities are shown in Fig. 16. They are basically the same in shape with those of the above experimental results. The fitted relations are all in the form of quadratic function and can be expressed by equation (6). Similarly, the functional formulas of the fitted curves of average signal voltage and gas void fraction of the solution with 1.22 g/cm3 in density can also be expressed by equation (6), indicating that the gas kick in the sucrose solution can also be quantitatively characterized by the time-domain signal analysis method.
Fig. 16.
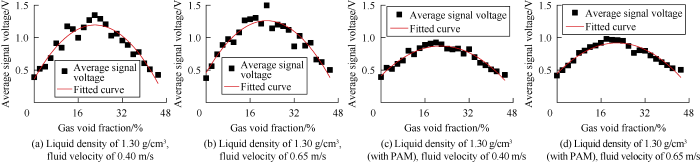
Fig. 16.
Fitting curves of average signal voltage and gas void fraction in sucrose solutions of different densities and flow velocities.
3.2.2. Frequency domain analysis of Doppler ultrasonic wave signals
(1) Frequency domain analysis of signals collected during pump stopping period: On the basis of the frequency domain analysis method for the signals, the amplitude spectra of signals in the experiments with sucrose solutions of 1.00, 1.15, 1.22, and 1.30 g/cm3 in density and sucrose solution with PAM and 1.30 g/cm3 in density at the gas void fraction of 0 were found. They have main frequencies of 17 938, 17 928, 18 058, 18 048, 18 018 respectively, with not much differences. The Doppler frequency shifts under different gas void fractions were counted to obtain the relationships between the Doppler frequency shift and gas void fraction for the five kinds of solutions (Fig. 17). Fig. 17 shows the Doppler frequency shift increases with the increase of gas void fraction in general, frequency shift curves of the four different sucrose solutions without PAM mostly overlap and show the same linear relationship. The Doppler frequency shift curve of the sucrose solution with PAM increases slowly, and drops significantly in amplitude than the solution without PAM at the same gas void fraction, but it still shows a linear relationship. Therefore, the method of frequency domain signal analysis can also be used to quantitatively characterize the gas void fraction of sucrose solutions when pump is off.
Fig. 17.
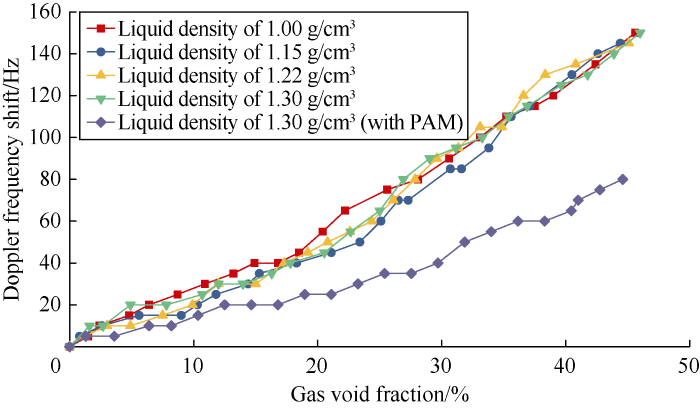
Fig. 17.
Fitted curves of Doppler frequency shift and gas void fraction of different sucrose solutions.
(2) Frequency domain analysis of signals collected when pump is on: Fig. 18 shows the variations of amplitude spectrum with frequency of the signals of 5 solutions at the gas void fraction of 0 and flow velocity of 0.65 m/s. The 5 amplitude spectrum curves are basically same in shape, only differ slightly in amplitude, and all have dominant frequencies of 16 000 Hz. The figure also shows gas void fraction has little effect on Doppler frequency shift. The experimental results at the flow rate of 0.4 m/s are basically the same. This means the change of the solution property has little effect on the main frequency when the pump is open. By comparing with the experimental results when pump is stopped, we found that the contribution of sound energy generated by the inverter to the amplitude spectrum exceeded the influence of gas void fraction, so the dominant frequency did not shift with the increase of gas void fraction. Therefore, the frequency domain signal analysis method can’t be used to quantitatively characterize the gas void fraction in sucrose solutions when the pump is open.
Fig. 18.
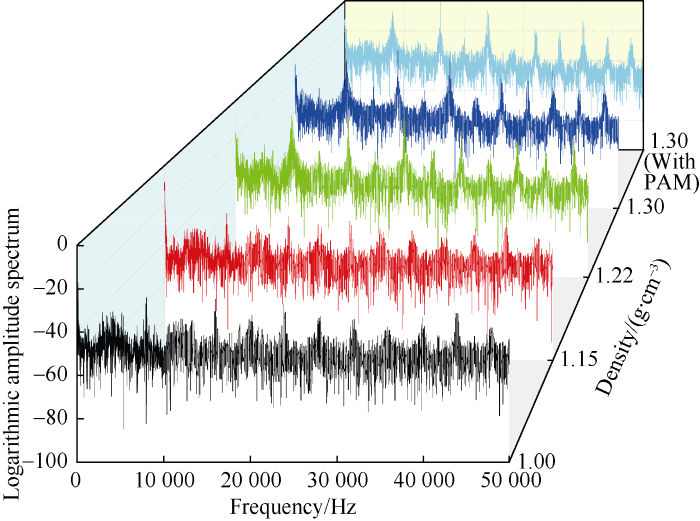
Fig. 18.
The effects of fluid density (viscosity) on amplitude spectrum at the gas void fraction of 0.
Based on the above analysis, the gas kick early detection method based on Doppler ultrasonic wave propagation outside the riser can be summarized as follows: (1) Doppler transmitting and receiving modules are installed along the outer wall of riser. The transmitting modules send out Doppler ultrasonic signals and penetrate through the wall of riser into the drilling fluid. The receiving modules receive the signals. (2) The received signals are analyzed by the signal acquisition and analysis system on the platform. If the received signal is consistent with the transmitted signal in waveform, no gas kick occurs. If the received signals change in waveform, the signals must be analyzed in the time domain and frequency domain. (3) According to the established relations between Doppler signal and gas void fraction based on the time-domain and frequency-domain analysis, the gas void fraction can be calculated quantitatively to guide the well killing next.
4. Conclusions
Whether the pump is on or off, the average voltage of Doppler ultrasonic signal detected outside the riser during deep water drilling increases first and then decreases with the increase of gas void fraction. The average signal voltage shows a quadratic function relationship with gas void fraction. Therefore, the gas void fraction can be calculated with the average signal voltage. The Doppler ultrasonic wave signals significantly reduced in amplitude in the solution with a higher viscosity and change gentler. The viscosity has stronger effect than density on the signals.
When the pump is off, the Doppler frequency shift increases with the increase of gas void fraction, and they show a linear relation, so Doppler frequency shift can be monitored to quantify the gas void fraction. When the pump is on, the influence of sound energy produced by frequency converter on amplitude spectrum is greater than that of gas void fraction, so it is impossible to tell whether gas kick occurs with frequency domain signal analysis in this situation.
Gas kick early detection method outside riser based on Doppler ultrasonic wave propagation is a non-contact measurement. With no need to contact the drilling fluid and not affected by the drilling operations, it can quantitatively characterize the gas void fraction according to the change of Doppler ultrasonic wave signal, and thus detect gas kicks in deep water drilling earlier.
Nomenclature
a, b—fitting constants;
c—propagation speed of ultrasonic wave in liquid, m;
f1—the frequency of ultrasonic wave emitted by the emission sensor, Hz;
f2—the frequency of ultrasonic wave received by the gas bubble in the liquid, Hz;
f3—the ultrasonic frequency received by the receiving sensor;
Hg—the gas void fraction, %;
u—the flow velocity of fluid, m/s;
U—the Doppler ultrasonic average signal voltage, V;
α—the incidence angle of the ultrasonic wave, (°);
Δf—the Doppler frequency shift, Hz.
Reference
Deepwater horizon marine casualty investigation report
Research status of early monitoring technology for deepwater drilling overflow
Automatic de-noising and recognition algorithm for drilling fluid pulse signal
Design of a marine drilling riser for the deepwater environment
Ultrafast imaging in biomedical ultrasound. IEEE Transactions on Ultrasonics, Ferroelectrics,
Intravascular tri-modality system: Combined ultrasound, photoacoustic, and elasticity imaging
Review of magnetostrictive patch transducers and applications in ultrasonic nondestructive testing of waveguides
Surface reconstruction accuracy using ultrasonic arrays: Application to non-destructive testing
DOI:10.1016/j.ndteint.2018.03.004 URL [Cited within: 1]
Ultrasonic detection of moving interfaces in gas-liquid two-phase flow
DOI:10.1016/j.flowmeasinst.2010.03.007
URL
[Cited within: 1]

Abstract
Ultrasound reflects strongly off the gas–liquid interface when there is a large change in acoustic impedance. We exploit this phenomenon to detect the instantaneous position of the interface from the time of flight of pulsed ultrasound. Because the characteristics of the reflected wave depend on the shape and size of the interface relative to the ultrasound wavelength, the single-sensing principle is insufficient to capture the interface for generalized gas–liquid two-phase flows. In the present study, we design and examine three types of ultrasound interface detection techniques: the echo intensity technique, the local Doppler technique, and the velocity-variance technique, and investigate and compare the merits and limitations of each. The results indicate that the echo intensity technique is appropriate for turbulent interfaces that cause ultrasound scattering over wide angles. In contrast, the local Doppler technique is required to capture information from waves reflected from smooth interfaces and bubbles. Finally, we find that the velocity-variance technique works for quasi-steady and periodical two-phase flow, and we apply this technique to horizontal slug flow in a tube.
Measurement of bubbly two-phase flow in vertical pipe using multiwave ultrasonic pulsed Dopller method and wire mesh tomography
DOI:10.1016/j.egypro.2014.11.887 URL [Cited within: 2]
Non-invasive classification of gas-liquid two-phase horizontal flow regimes using an ultrasonic Doppler sensor and a neural network
DOI:10.1088/0957-0233/27/8/084002 URL [Cited within: 1]
Early monitoring of the gas-cut in deepwater riser based on Doppler measuring system
Study on real-time ultra sonic kick detection technique along riser during deep water drilling operations
Design and offshore tests of monitoring system on gas cut of riser based on ultrasonic Doppler
Dynamic gas kick regulation through control reconfiguration under MPD scenario: Two-phase flow validation
DOI:10.1016/j.petrol.2018.08.075 URL [Cited within: 1]
A simplified gas-liquid flow model for kick mitigation and control during drilling operations
Multiphase flow behavior for acid-gas mixture and drilling fluid flow in vertical wellbore
DOI:10.1016/j.petrol.2018.02.016 URL [Cited within: 2]
Velocity and attenuation of ultrasound in suspensions of particles in fluids
DOI:10.1088/0022-3727/21/11/006 URL [Cited within: 1]
