Supported by the National Natural Science Foundation of China. U1762216 China National Science and Technology Major Project. 2016ZX05028-001-03
Abstract
Considering the complicated interactions between temperature, pressure and hydration reaction of cement, a coupled model of temperature and pressure based on hydration kinetics during deep-water well cementing was established. The differential method was used to do the coupled numerical calculation, and the calculation results were compared with experimental and field data to verify the accuracy of the model. When the interactions between temperature, pressure and hydration reaction are considered, the calculation accuracy of the model proposed is within 5.6%, which can meet the engineering requirements. A series of numerical simulation was conducted to find out the variation pattern of temperature, pressure and hydration degree during the cement curing. The research results show that cement temperature increases dramatically as a result of the heat of cement hydration. With the development of cement gel strength, the pore pressure of cement slurry decreases gradually to even lower than the formation pressure, causing gas channeling; the transient temperature and pressure have an impact on the rate of cement hydration reaction, so cement slurry in the deeper part of wellbore has a higher rate of hydration rate as a result of the high temperature and pressure. For well cementing in deep water regions, the low temperature around seabed would slow the rate of cement hydration and thus prolong the cementing cycle.
Keywords:deep-water drilling
;
well cementing
;
hydration reaction kinetics
;
temperature field
;
pressure field
;
coupled prediction model
WANG Xuerui, SUN Baojiang, LIU Shujie, LI Zhong, LIU Zhengli, WANG Zhiyuan, LI Hao, GAO Yonghai. A coupled model of temperature and pressure based on hydration kinetics during well cementing in deep water. [J], 2020, 47(4): 867-876 doi:10.1016/S1876-3804(20)60102-1
Introduction
In recent years, offshore oil and gas exploration and development has gradually shifted from shallow waters to deep waters. Although deep water areas have a broad prospect, the complex deep water environment brings great challenges to oil and gas exploration and development[1], and well cementing is one of the typical challenges. The aim of well cementing is to isolate gas, oil and water layers and prevent gas channeling between different layers by making a complete cement sheath between the casing and formation. Accurate prediction of wellbore temperature and pressure fields is the basis of cementing slurry and cementing process design. Especially in the cement curing process, the interactions between cement hydration, temperature and pressure directly affect the quality of well cementing and safety. The reaction rate of cement hydration is affected by temperature and pressure significantly, as a result, the cement hydration properties, such as the degree of hydration and gel strength of cement slurry change with time and space[2,3]. The heat generated by cement hydration changes the cement temperature field and induces the thermal stress field, consequently, micro-fissures may be formed in the cement sheath, providing paths for gas channeling[4,5]. The cement slurry would lose “weight” during the hydration process, namely, the internal pressure of cement slurry would drop, which would provide driving force for gas channeling[6]. In addition, the special environment in deep water area leads to more complicated interactions between cement hydration, temperature and pressure. An accurate prediction model of wellbore temperature and pressure is the premise of safe and efficient cementing in deep water.
Currently, the most commonly used method to predict wellbore temperature in the oil industry is the semi-empirical method proposed by the American Petroleum Institute (API)[7]. However, Wedelich et al.[8] pointed out that the API method always overestimated wellbore temperature by comparing with field measurements. Therefore, researchers worldwide proposed various physical models of heat conduction in well cementing[9,10,11]. Liu et al.[12] and Wang et al.[13] put forward different temperature prediction models according to different cementing processes. In terms of wellbore pressure field during cementing, Carter et al.[14] found the pressure decrease phenomenon during cement curing first. On this basis, researchers at home and abroad published relevant theoretical explanations through experiments and proposed pressure prediction models[15,16,17].
So far, researchers all take the cement temperature and pressure changes as two separated processes, and don’t consider the effect of cement hydration fully in the research of wellbore temperature and pressure fields. In view of this, considering the interactions between cement hydration, temperature, pressure, and the special environment of deep water, a coupled model of cement temperature and pressure based on the kinetics of hydration reaction for deep water well cementing has been established in this study. The new model was used to analyze the variation patterns of wellbore temperature, pressure and hydration degree with time and space during cementing, which can provide safety guidance for well cementing in deep water areas.
1. Coupled model of temperature and pressure during cement curing in a deep-water well
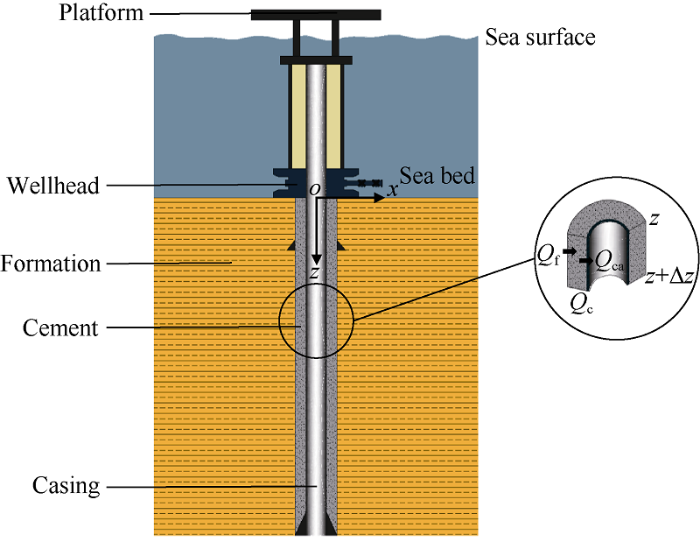
The cement slurry is injected into the annulus between casing and formation during well cementing process (Fig. 1), and undergoes severe hydration reaction during the cement curing. The complicated interactions between cement hydration, temperature and pressure include: (1) Large amount of heat is generated during cement hydration, which changes the cement slurry temperature constantly. (2) With the deepening of hydration reaction, the cement slurry produces certain gel strength, sharing part of the hydrostatic column pressure of the original cement slurry, which leads to the decrease of pore pressure within the cement slurry. (3) Under the effects of geothermal gradient and initial hydrostatic column pressure, the cement slurry in different positions of the wellbore is in different temperature and pressure environments. Therefore, the rate of cement hydration reaction varies with space, and the hydration reaction progresses at different rates in different depths. (4) The temperature and pressure of cement slurry at a certain position change with time due to the effect of hydration reaction. At the same time, the transient temperature and pressure also change the rate of cement hydration reaction, so the hydration properties of cement slurry, such as the hydration degree and gel strength, change with time.
Fig. 1.
Schematic diagram of deepwater cementing process.
1.1. Calculation model of transient temperature during cement curing in deep-water well
In the heat transfer process of cement slurry during cementing, the temperature during cement curing is mainly affected by the following three factors: the temperature increase caused by the cement hydration heat, the heat exchange between cement slurry and drilling fluid in casing, and the heat exchange between cement slurry and formation. According to the heat transfer process, heat transfer models of the cement slurry in annulus, the drilling fluid in casing and the formation around wellbore need to be established at the same time to obtain the temperature of cement slurry. The cementing system is symmetric with the wellbore as the central axis. Therefore, the column coordinate system shown in Fig. 1 is established.
1.1.1. Heat transfer model of drilling fluid in casing
As shown in Fig. 1, the cell with a length of Δz is taken as the research objective. According to the law of energy conservation, the change of heat in the cell is equal to the heat flowing in minus the heat flowing out.
The left side of equation (1) is the energy change of the fluid in cell. The first item on the right side is the heat exchange with the annulus, the second item is the heat exchange with the adjacent cell below, the third item is the heat exchange with the adjacent cell above. Then, the differential form of the heat transfer model of drilling fluid in casing can be written as:
The heat transfer process in the formation around the wellbore is an axial symmetric diffusion process. Based on the established cylindrical coordinate system, the heat transfer model of formation can be obtained from the heat diffusion equation in the axial coordinate system[18,19]:
1.1.3. Heat transfer model of cement slurry in annulus
The heat exchange of cement slurry with drilling fluid in casing and formation can be quantified by equations (2) and (3). The heat generated by cement hydration can be calculated with the kinetics model of cement hydration. The cell with a length of Δz is taken as the research objective. According to the law of energy conservation, the heat transfer model of cement slurry in annulus can be expressed as:
The left side of equation (4) is the energy change of the cell. The first item on the right side is the cement hydration heat, the second item is the heat exchange with the drilling fluid in casing, the third item is the heat exchange with the formation. The fourth and fifth items are the heat exchange with the cells below and above. Then, the differential form of the heat transfer model of cement slurry in annulus can be written as:
1.2. Calculation model of transient pressure field during cement curing in deep-water well
Previous experiments and field tests[6, 15] showed that the pore pressure inside the cement sheath decreased as cement hydration reaction went on, which is called the weight loss of cement slurry. For this phenomenon, the theory of gel strength[20-23] gives an explanation: during the circulation stage, the cement slurry is in liquid state and can transfer all the hydrostatic pressure. Once the cement hydration reaction starts, the cement slurry increases in gel strength and changes from liquid state to gelling state. Under such circumstance, part of the hydrostatic pressure is shared by gel strength of cement slurry. Therefore, the pore pressure in the cement sheath decreases with time. Based on this theory, the relationship of cement gel strength and cement sheath pressure is given.
1.2.1. Stress state of cement sheath
In light of the pressure decrease in cement sheath, Drecq et al.[20], Parcevaux[21], and Erik et al.[22] regarded cement hydration process as the consolidation process of soil. Through experiment, they found the stress state model of soil, Terzaghi’s law, could accurately describe the stress state inside the cement sheath:
$\sigma \text{=}{\sigma }'+p$
1.2.2. Total stress of cement slurry
The total stress of cement slurry is constant and equal to the overburden pressure of cement slurry[20,21,22]:
$\sigma \text{=}{{\rho }_{c}}gz$
1.2.3. Effective stress of cement slurry
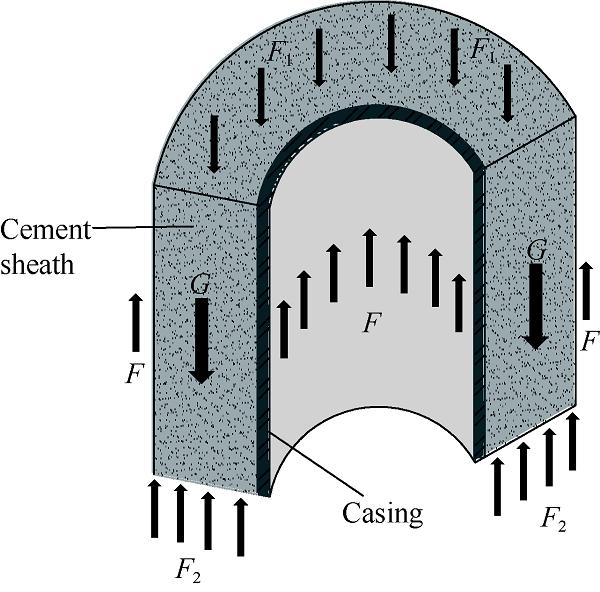
The effective stress of cement slurry is related to the static gel strength of cement slurry and changes with time. Moore[23] proposed the classic stress-strain equation to calculate the pressure required to move the cement sheath and suspension force of gel strength of cement slurry. According to the stress diagram of cement sheath (Fig. 2), the cement sheath is mainly affected by four forces.
(4) Suspension force of cement gel at well wall and outside surface of casing is:
$F=\tau \ \pi ({{d}_{w}}+{{d}_{i}})\Delta z$
According to Fig. 2, the mechanical equilibrium equation of the cement sheath can be expressed as:
$G+{{F}_{1}}={{F}_{2}}+F$
Based on equation (12), the effective stress within the cement sheath is equal to gravity of the cement sheath plus the pressure difference between the upper and lower cell. In other words, so the suspension force of cement gel on unit cross- sectional area is the effective stress. Based on equations (8) to (11), the effective stress of cement slurry can be expressed as:
The pore pressure of cement slurry decreases with the increase of cement gel strength, and the increase of cement gel strength is closely related to the cement hydration process. Therefore, when calculating pore pressure of cement slurry, the effect of cement hydration reaction should be considered. When the effective stress of cement slurry is high enough, the cement gel strength can support the self-weight, and the pore pressure of cement slurry deceases to hydrostatic pressure of pore water and remains constant[21]:
${{p}_{final}}={{p}_{0}}\text{+}{{\rho }_{w}}gz$
Based on the kinetics of cement hydration, the pore pressure of cement slurry can be expressed as:
1.3. Kinetics model of cement hydration under varying curing temperature and pressure
The aim of chemical reaction kinetics is to study the effects of internal factors (concentration and state of reactant etc.) and external factors (temperature and pressure etc.) on the rate of chemical reaction. By using the kinetics model of cement hydration, the relationship between temperature and pressure and rate of cement hydration can be described. The direct study object of hydration reaction kinetics is hydration degree, which is defined as the percent of hydrated cement to the original cement in mass. The hydration degree is usually described by the hydration heat, which is easier to measure. The hydration degree of cement can be expressed as:
$\alpha \left( t \right)\text{=}\frac{P\left( t \right)}{{{P}_{\infty }}}=\frac{Q\left( t \right)}{{{Q}_{\infty }}}$
The kinetics model proposed by Krstulovic and Dabic[24] is regarded as one of the classic models of cement hydration, which is widely used in industry. Based on the hydration heat curve of cement, Krstulovic-Dabic model (K-D model) describes the quantified relationship between hydration degree of cement and time. According to the model, the cement hydration includes three processes: nucleation and crystal growth (NG), interactions at the phase boundaries (I), and diffusion (D). All the three processes could take place at one time, and one or two of them could take place, but the slowest one determines the rate of the whole hydration process. According to the K-D model, the slowest process at the beginning is NG, which is later replaced by I or D. The mathematical models of the three processes are respectively[24]:
In addition, temperature and pressure change the cement hydration process by affecting the rate constant of cement hydration. Combined with Arrhenius equation, the relationship between temperature, pressure and rate of hydration reaction can be expressed as[2]:
According to equations (19)-(21), the key to solve the K-D model is to determine the reaction rate constants and orders of hydration reaction. The isothermal calorimeter can be used to obtain the heat released curve during cement hydration continuously. Based on the relationship between hydration degree and released heat of cement slurry given by equation (18), the change curve of hydration degree of cement slurry with time can be obtained. On this basis, the relationship between $-\ln (1-\alpha )$ and t can be acquired graphically from taking the logarithm of both sides in equation (19). The n and KNG can be worked out by the slope and intercept from the curve. Similarly, the KI, KD and Ea can also be acquired from the logarithm diagram according to equations (20)-(22).
2. Numerical solution of coupled temperature and pressure
The differential method was applied to solve the models of hydration kinetics, temperature field and pressure field. The optimized coupled iterative process of calculation is presented.
2.1. Initial and boundary conditions
2.1.1. Initial conditions
(1) The initial pressure is equal to the hydrostatic pressure of cement slurry:
${{\left. p\left( z \right) \right|}_{t=0}}={{\rho }_{c}}gz$
(2) The initial hydration degree of cement slurry is zero:
${{\left. \alpha \right|}_{t\text{=}0}}\text{=}0$
(3) The initial temperature of cement slurry in wellbore can be calculated with the model during circulation process proposed by Sun et al.[18,19]:
(4) The initial formation temperature can be calculated with the geothermal gradient:
${{T}_{e}}(z)=z{{g}_{G}}$
2.1.2. Boundary conditions
(1) At the wellbore and formation interface, the energy change of the cell equals the heat exchange from cement slurry in the annulus plus the heat exchange to the formation:
$\frac{{{T}_{e,0}}\left( t+\Delta t \right)-{{T}_{e,0}}\left( t \right)}{\Delta t}{{\rho }_{e}}{{c}_{e}}={{U}_{a}}\frac{{{T}_{c}}\left( t \right)-{{T}_{e,0}}\left( t \right)}{\Delta x}+ \\ \frac{{{T}_{e,1}}\left( t \right)-{{T}_{e,0}}\left( t \right)}{\Delta {{x}^{2}}}{{k}_{e}}$
(2) The formation at infinity is not disturbed and remains at the initial temperature:
${{\left. {{T}_{e}} \right|}_{x=\infty }}\left( t \right)={{T}_{e}}\left( 0 \right)$
(3) At the wellhead in the mudline, the pore pressure of cement slurry is equal to the environmental pressure:
${{p}_{0}}={{p}_{en}}$
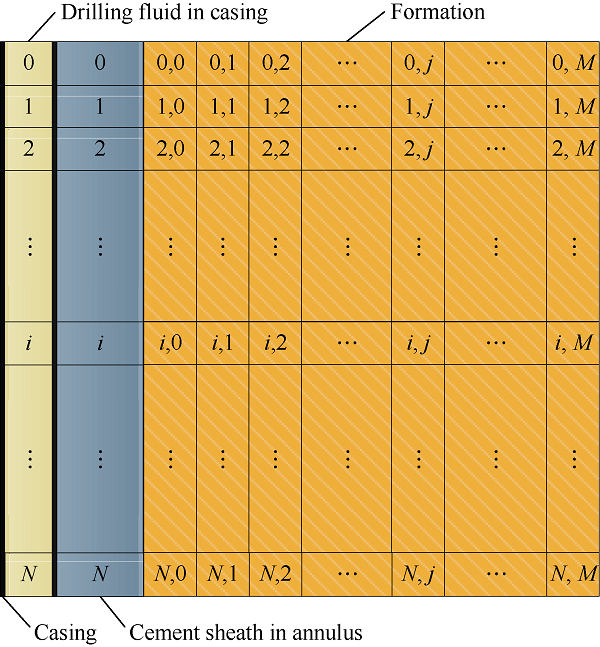
2.2. Mesh generation
The wellbore diameter is much smaller than the wellbore length. Therefore, the casing and cement sheath were regarded as one-dimensional. The formation is symmetric with the wellbore as the central axis. Therefore, the formation was simplified as two-dimensional. The mesh used in the calculation is shown in Fig. 3.
According to the calculation principle of finite difference method, equations (5), (17) and (19)-(21) can be written in finite difference iterative scheme:
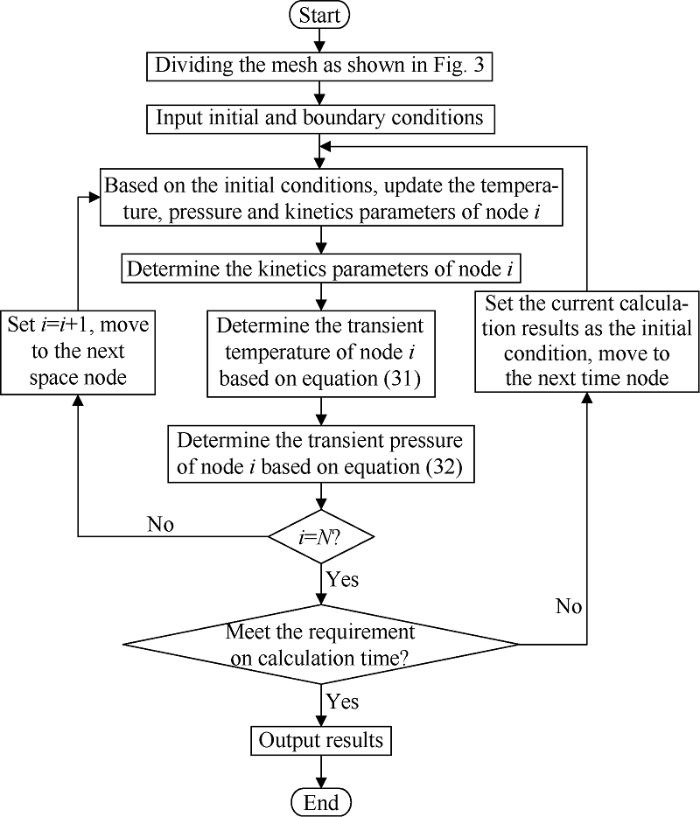
To illustrate the process of the coupled iteration method clearly, a flow chart of the calculation process is given in Fig. 4 on basis of the initial and boundary conditions, the mesh generation, and the finite difference scheme.
Fig. 4.
Flow chart of coupled iterative calculation process.
3. Model validation
3.1. Validation of cement hydration kinetics model
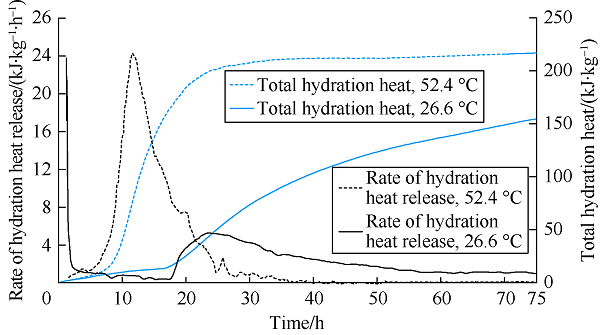
To validate the cement hydration kinetics model, the model was applied to the experiments conducted by Dillenbeck et al.[25]. In order to study the effect of cement hydration heat on temperature in wellbore, Dillenbeck et al. obtained the heat curves of cement hydration at 26.6 °C and 52.4 °C using the isothermal calorimeter (Fig. 5).
Fig. 5.
Hydration heat curves of cement slurry at different temperatures.
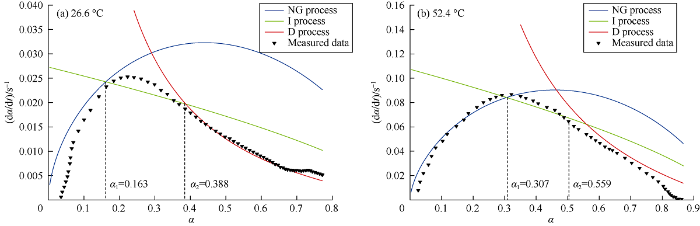
According to equation (18), the change curve of cement hydration degree with time can be acquired from heat curve of cement hydration. Then, the kinetics parameters of K-D model can be obtained as shown in Table 1.
Based on the kinetics parameters at different temperatures in Table 1, the activation energy in the NG, I and D processes was worked out at 20 787.4, 25 407.5, and 40 436.3 J/mol respectively. Combined with equation (22), the cement hydration processes under different temperatures can be described quantitatively. Fig. 6 shows the comparison between calculated results of this model and the measured results by Dillenbeck. It can be seen from the figure that they are in good agreement, indicating the model can describe the cement hydration processes at different temperatures accurately.
Fig. 6.
Comparison of calculated results with the model and the measured results.
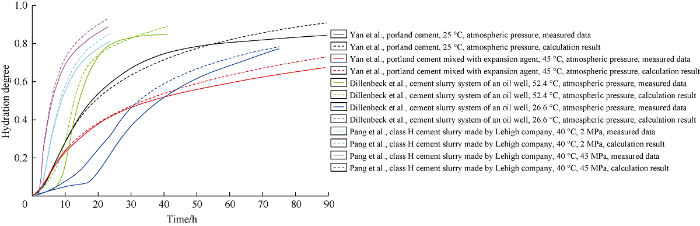
To further validate the kinetics model proposed in this paper, the model was used to simulate experiments conducted by Yan et al.[26] using Porland cement and Portland cement mixed with expansion agent under different temperatures, and kinetics experiments of Class H cement under different pressures conducted by Pang et al[2]. Fig. 7 shows the calculated hydration degrees with this model and measured hydration degrees in these experiments. It can be seen that this model can describe the cement hydration processes of different cement slurry systems under different temperatures and pressures accurately, satisfying the requirement of field engineering.
Fig. 7.
Comparison of calculated results with the model proposed in this paper and measured results under different conditions.
3.2. Validation of temperature and pressure model
3.2.1. Validation with Dillenbeck’s field test
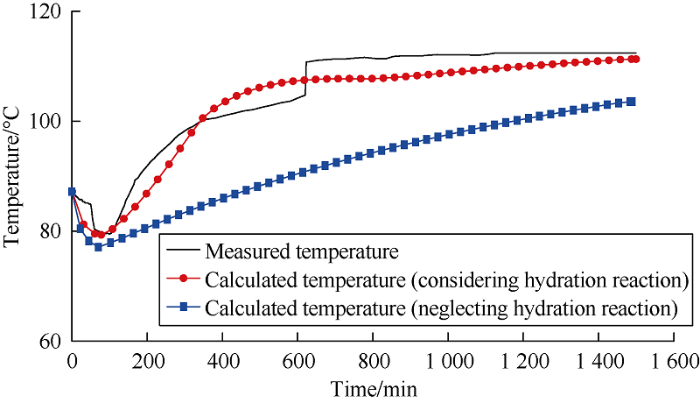
In Dillenbeck’s field test[25], temperature sensors were set in the wellbore to measure the temperature in real time. Fig. 8 shows the calculated temperature results with the model presented in this paper and temperatures measured by Dillenbeck. It can be seen that the maximum error of calculated temperature by the new model considering hydration reaction is 5.6%, while the temperature predicted without considering the effect of hydration reaction have a maximum error of 24.5%. This proves that the effect of hydration reaction of cement on wellbore temperature can’t be ignored.
Fig. 8.
Comparison of the calculated temperatures and measured temperatures during the cement curing stage.
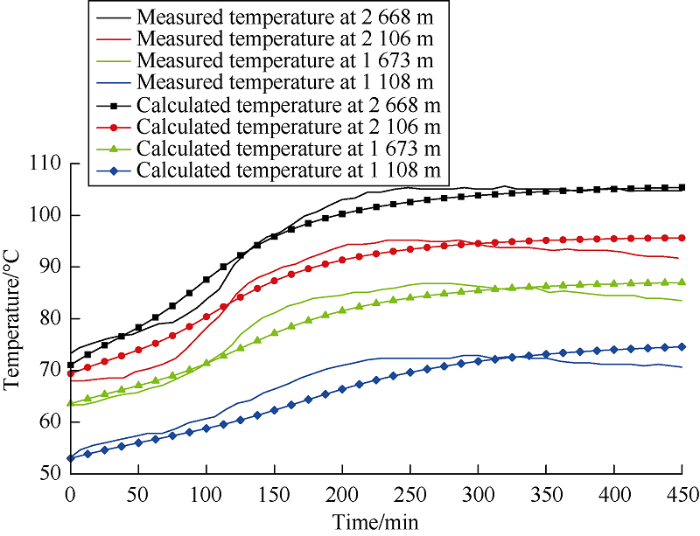
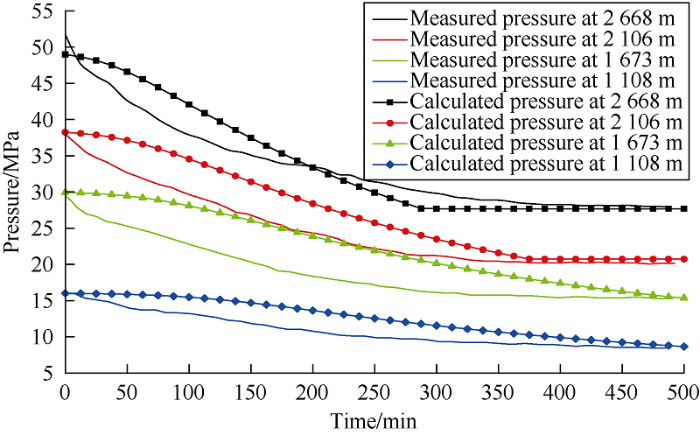
3.2.2. Validation of Cooke’s field test
To further validate the temperature and pressure model presented in this paper, the calculated temperatures with the model were compared with the measured temperatures in Cooke’s field test[6]. In the field test, four sensors were put on the outer surface of the casing at 1108, 1673, 2106, and 2668 m depths. A logging cable was used to collect the data from the sensors. The temperatures and pressures at different positions were measured in real time. The test well is 2712 m deep, with a 73 mm outer diameter casing, and 200 mm in wellbore diameter. The geothermal gradient of the formation is 2.12 °C/100 m.
Comparison of the calculated results and the measured results from Cooke’s field test shows a good agreement, indicating the model presented in this paper can fit the experiment accurately, satisfying the requirement of field engineering (Figs. 9 and 10).
According to the variation trend of temperatures, cement hydration at the early stage releases large amounts of heat, so the temperature of cement slurry increases obviously. With the decrease of cement hydration rate, the temperature of cement slurry gradually approaches to the formation temperature. In contrast, both the calculated and measured pressures decrease with time. According to the calculated pressures, the porepressure in cement slurry decreases to the hydrostatic pressure of pore water in the end with the rise of gel strength of cement slurry.
Fig. 10.
Comparison of calculated pressures and measured pressures.
4. Evolution laws of temperature, pressure and hydration degree during cement curing stage in deep-water well
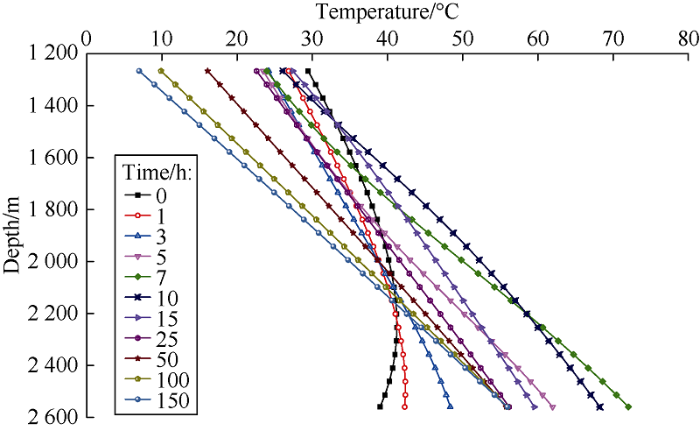
To reveal the evolution laws of temperature, pressure and hydration degree, the new model was used to simulate the temperature, pressure and hydration degree of a deep-water well. The cement slurry system in Dillenbeck’s test was taken in the numerical simulation. The well bore of the simulated well is shown in Fig. 1. The basic parameters of the simulated well are shown in Table 2.
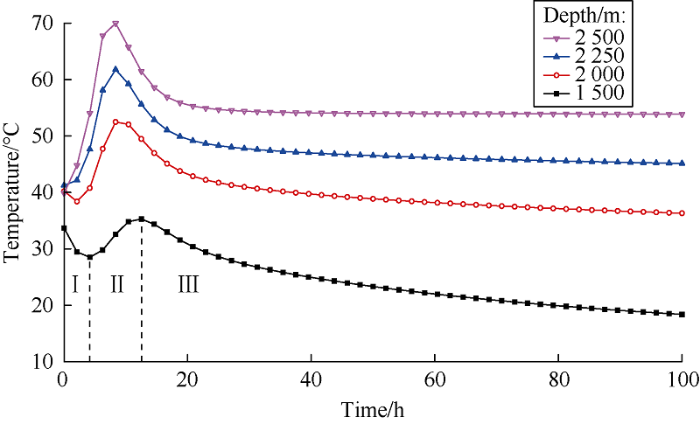
Fig. 11 shows the change curve of cement slurry temperature profile with time during cement curing stage in the deep-water well. The 0 h represents the end of the cement circulation and the beginning of cement curing stage. Cement slurry temperatures at different positions all change from the initial temperature to the formation temperature. During this process, the cement slurry temperature shows a complicated evolution law due to the large amount of heat released by cement hydration. Fig. 12 shows the transient temperature change of cement slurry at different depths. The evolution of cement slurry temperature can be divided into three stages. The first stage is short, during which heat transfer occurs mainly between the cement slurry in annulus and drilling fluid in casing, and the cement slurry temperature decreases slightly and temperature difference between cement slurry and drilling fluid narrows. At the depths of 2250 m and 2500 m, the temperatures of cement slurry and drilling fluid are very close, so the temperature decrease of cement slurry is not obvious. The second stage begins when the cement hydration reaction rate gets larger, and a large amount of hydration heat is released. Consequently, the cement slurry temperature increases obviously and reaches the peak. In the third stage, the cement hydration reaction slows down and the rate of heat generation greatly reduces too. During this stage, the heat transfer occurs mainly between the cement slurry in annulus and the formation, and the cement slurry temperature approaches to the formation temperature in the end.
Fig. 12.
Transient temperatures of cement slurry at different depths.
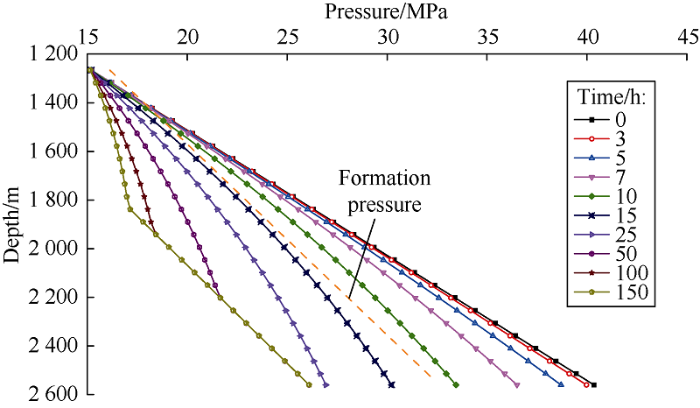
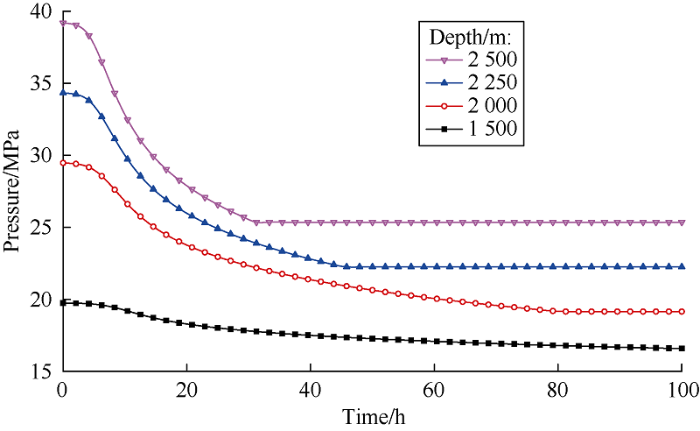
4.2. Evolution law of transient cement pressure
According to Fig. 13 and Fig. 14, the pore pressure of cement slurry decreases as cement hydration goes on. Based on the pressure profiles at different times, the pore pressure was lower than the formation pressure after 10.5 h, so the gas channeling risk came up at this moment. The gel strength of cement needs to be high enough to prevent the gas channeling before this moment. The model presented in this paper can provide theoretical basis for the design of anti-gas channeling cement system.
Fig. 14.
Variation of pressure of cement slurry in annulus at different depths.
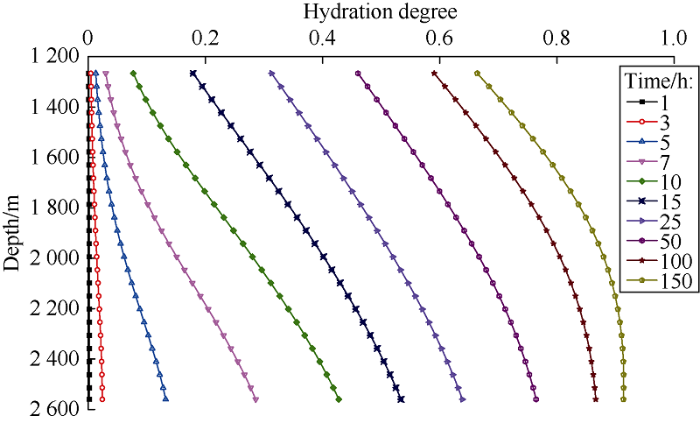
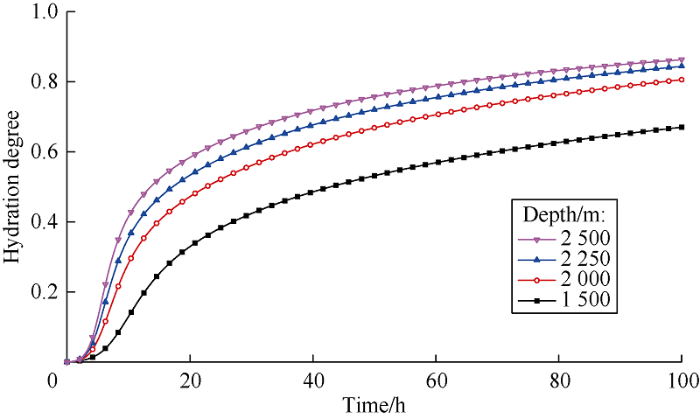
4.3. Evolution law of cement hydration degree
As shown in Fig. 15 and Fig. 16, the hydration degree of cement slurry increases with time and approaches to a constant in the end. The temperature and pressure of cement slurry increase with depth under the joint effect of geothermal gradient and hydrostatic pressure. High temperature and high pressure make cement hydration reaction accelerate. Therefore, the cement slurry in the deeper part of wellbore has a higher hydration degree. Simulation results show that the cement slurry at 2500 m reaches the hydration degree of 0.5 after 14.1 h, while the cement slurry at 1500 m reaches the hydration degree of 0.5 after 43.8 h. Therefore, the low temperature at mudline would prolong the curing time of cement slurry and cementing cycle.
Fig. 16.
Evolution of hydration degrees of cement slurry in annulus at different depths
5. Conclusions
Considering the complicated interactions between temperature, pressure and cement hydration, a coupled model between temperature and pressure during well cementing in deep-water regions has been established based on hydration kinetics in the study. The new model was used to simulate temperatures and pressures of a deep-water well. The simulation results demonstrate that neglecting the interactions between temperature, pressure and cement hydration would introduce big errors to the predicted wellbore temperature and pressure. By comparing the calculated results with the measured data, the new model has a maximum error of 5.6%, satisfying the requirement of engineering. The temperature of cement slurry goes up rapidly due to the heat generated by cement hydration. With the increase of cement slurry gel strength, the pore pressure of cement slurry decreases gradually and even drops below the formation pressure, leading to the risk of gas channeling. The transient temperature and pressure would impact the rate of cement hydration in turn. Cement slurry in the deeper part of wellbore has a faster rate of hydration reaction. In cementing of deep-water wells, it should be aware that the low temperature at mudline would slow down the cement hydration process and prolong the curing time and thus cementing cycle. The new model presented in this paper can help cementing engineers design cement slurry system and prevent safety hazards in advance.
Nomenclature
Aa—cross-sectional area of annulus, m2;
Ac—cross-sectional area of casing, m2;
cc—specific heat capacity of cement slurry in annulus, J/(kg•K);
ce—specific heat capacity of formation, J/(kg•K);
cf—specific heat capacity of drilling fluid in casing, J/(kg•K);
di—inner diameter of cement sheath, m;
dw—outer diameter of cement sheath, m;
Ea—activation energy of the chemical reaction, J/mol;
F—suspension force of cement gel at well wall and outer surface of casing, N;
F1—force applied by the upper cement sheath cell, N;
F2—force applied by the lower cement sheath cell, N;
g—gravity acceleration, m/s2;
G—gravity of the cement sheath cell, N;
gG—geothermal gradient, °C/m;
i—serial number of the cell along the wellbore;
j—serial number of the cell in the direction vertical to wellbore;
kc—heat conductivity of cement slurry in annulus, W/(m•K);
ke—heat conductivity of formation, W/(m•K);
kf—heat conductivity of drilling fluid in casing, W/(m•K);
K—reaction rate constant of a chemical reaction, s-1;
KD—reaction rate constant in the process of diffusion, s-1;
KI—reaction rate constant in the process of interactions at the phase boundaries, s-1;
KNG—reaction rate constant in the process of nucleation and crystal growth, s-1;
Kr—reaction rate constant at reference temperature, s-1;
m—time node;
M—number of formation cells perpendicular to the wellbore;
n—order of chemical reactions;
N—number of cells along the direction of wellbore;
p—pore pressure of cement slurry, Pa;
pen—environmental pressure, Pa;
pfinal—final pore pressure of cement slurry, Pa;
pr—reference pressure of chemical reaction, Pa;
p0—wellhead back pressure, Pa;
p1—pressure of the upper cement sheath cell, Pa;
p2—pressure of the lower cement sheath cell, Pa;
P—characteristic value of a property of cement slurry at any time, e.g. cement gel strength;
P∞—final characteristic value of a property of cement slurry;
Q—hydration heat of cement slurry at a certain moment, J/kg;
Qc—cement hydration heat, J;
Qca—energy exchange between cement slurry and casing, J;
Qf—energy exchange between cement slurry and formation, J;
Q∞—final hydration heat of cement slurry, J/kg;
rci—inner radius of casing, m;
rw—radius of wellbore, m;
R—gas constant, 8.13 J/(mol•K);
t—time of cement hydration, s;
T—temperature of chemical reaction, K;
Tc—temperature of cement slurry in annulus, K;
Te—temperature of formation, K;
Te,0—temperature at interface of wellbore and formation, K;
Te,1—temperature of the first cell next to the interface between wellbore and formation, K;
Tf —temperature of drilling fluid in casing, K;
Tr—reference temperature of chemical reaction, K;
Ua—total heat transfer coefficient from annulus to formation, W/(m2•K);
Uc—total heat transfer coefficient from casing to annulus, W/(m2•K);
vc—velocity of cement slurry in annulus, m/s;
vf —velocity of drilling fluid in casing, m/s;
wc—mass flow rate of cement slurry in annulus, kg/s;
wf—mass flow rate of drilling fluid in casing, kg/s;
x—horizontal distance from wellbore, m;
z—distance from wellhead along wellbore direction, m;
α—hydration degree of cement slurry;
α1—hydration degree of cement slurry when entering I stage after NG;
α2—hydration degree of cement slurry when entering D stage after I stage;
α500—hydration degree of cement slurry when gel strength reaches 239 Pa (500 lbf/100 ft2);
γ—bulk density of cement slurry, N/m3;
ρc—density of cement slurry in annulus, kg/m3;
ρe—formation density, kg/m3;
ρf—density of drilling fluid in casing, kg/m3;
ρw—density of pore water, kg/m3;
σ—total stress of cement slurry, Pa;
σ′—effective stress of cement slurry, Pa;
τ—gel strength of cement slurry, Pa;
τ500—the value corresponding to the gel strength of 500 lbf/100 ft2, which is 239 Pa;
Δt—time step, s;
ΔV—apparent activation volume, m3/mol;
Δx—mesh step size of formation cell in the direction of perpendicular to the wellbore, m;
Novel technology to reduce risk lost circulation and improve cementing quality using managed pressure cementing for narrow safety pressure window wells in Sichuan Basin
Journal of Petroleum Science and Engineering, 2019,180:707-715.
Prediction of wax precipitation region in wellbore during deep water oil well testing
1
2018
... In recent years, offshore oil and gas exploration and development has gradually shifted from shallow waters to deep waters. Although deep water areas have a broad prospect, the complex deep water environment brings great challenges to oil and gas exploration and development[1], and well cementing is one of the typical challenges. The aim of well cementing is to isolate gas, oil and water layers and prevent gas channeling between different layers by making a complete cement sheath between the casing and formation. Accurate prediction of wellbore temperature and pressure fields is the basis of cementing slurry and cementing process design. Especially in the cement curing process, the interactions between cement hydration, temperature and pressure directly affect the quality of well cementing and safety. The reaction rate of cement hydration is affected by temperature and pressure significantly, as a result, the cement hydration properties, such as the degree of hydration and gel strength of cement slurry change with time and space[2,3]. The heat generated by cement hydration changes the cement temperature field and induces the thermal stress field, consequently, micro-fissures may be formed in the cement sheath, providing paths for gas channeling[4,5]. The cement slurry would lose “weight” during the hydration process, namely, the internal pressure of cement slurry would drop, which would provide driving force for gas channeling[6]. In addition, the special environment in deep water area leads to more complicated interactions between cement hydration, temperature and pressure. An accurate prediction model of wellbore temperature and pressure is the premise of safe and efficient cementing in deep water. ...
Hydration kinetics modeling of the effect of curing temperature and pressure on the heat evolution of oil well cement
3
2013
... In recent years, offshore oil and gas exploration and development has gradually shifted from shallow waters to deep waters. Although deep water areas have a broad prospect, the complex deep water environment brings great challenges to oil and gas exploration and development[1], and well cementing is one of the typical challenges. The aim of well cementing is to isolate gas, oil and water layers and prevent gas channeling between different layers by making a complete cement sheath between the casing and formation. Accurate prediction of wellbore temperature and pressure fields is the basis of cementing slurry and cementing process design. Especially in the cement curing process, the interactions between cement hydration, temperature and pressure directly affect the quality of well cementing and safety. The reaction rate of cement hydration is affected by temperature and pressure significantly, as a result, the cement hydration properties, such as the degree of hydration and gel strength of cement slurry change with time and space[2,3]. The heat generated by cement hydration changes the cement temperature field and induces the thermal stress field, consequently, micro-fissures may be formed in the cement sheath, providing paths for gas channeling[4,5]. The cement slurry would lose “weight” during the hydration process, namely, the internal pressure of cement slurry would drop, which would provide driving force for gas channeling[6]. In addition, the special environment in deep water area leads to more complicated interactions between cement hydration, temperature and pressure. An accurate prediction model of wellbore temperature and pressure is the premise of safe and efficient cementing in deep water. ...
... In addition, temperature and pressure change the cement hydration process by affecting the rate constant of cement hydration. Combined with Arrhenius equation, the relationship between temperature, pressure and rate of hydration reaction can be expressed as[2]: ...
... To further validate the kinetics model proposed in this paper, the model was used to simulate experiments conducted by Yan et al.[26] using Porland cement and Portland cement mixed with expansion agent under different temperatures, and kinetics experiments of Class H cement under different pressures conducted by Pang et al[2]. Fig. 7 shows the calculated hydration degrees with this model and measured hydration degrees in these experiments. It can be seen that this model can describe the cement hydration processes of different cement slurry systems under different temperatures and pressures accurately, satisfying the requirement of field engineering. ...
Hydration kinetics modeling of Portland cement considering the effects of curing temperature and applied pressure
1
2009
... In recent years, offshore oil and gas exploration and development has gradually shifted from shallow waters to deep waters. Although deep water areas have a broad prospect, the complex deep water environment brings great challenges to oil and gas exploration and development[1], and well cementing is one of the typical challenges. The aim of well cementing is to isolate gas, oil and water layers and prevent gas channeling between different layers by making a complete cement sheath between the casing and formation. Accurate prediction of wellbore temperature and pressure fields is the basis of cementing slurry and cementing process design. Especially in the cement curing process, the interactions between cement hydration, temperature and pressure directly affect the quality of well cementing and safety. The reaction rate of cement hydration is affected by temperature and pressure significantly, as a result, the cement hydration properties, such as the degree of hydration and gel strength of cement slurry change with time and space[2,3]. The heat generated by cement hydration changes the cement temperature field and induces the thermal stress field, consequently, micro-fissures may be formed in the cement sheath, providing paths for gas channeling[4,5]. The cement slurry would lose “weight” during the hydration process, namely, the internal pressure of cement slurry would drop, which would provide driving force for gas channeling[6]. In addition, the special environment in deep water area leads to more complicated interactions between cement hydration, temperature and pressure. An accurate prediction model of wellbore temperature and pressure is the premise of safe and efficient cementing in deep water. ...
A new fractal approach for describing induced-fracture porosity/permeability/compressibility in stimulated unconventional reservoirs
1
2019
... In recent years, offshore oil and gas exploration and development has gradually shifted from shallow waters to deep waters. Although deep water areas have a broad prospect, the complex deep water environment brings great challenges to oil and gas exploration and development[1], and well cementing is one of the typical challenges. The aim of well cementing is to isolate gas, oil and water layers and prevent gas channeling between different layers by making a complete cement sheath between the casing and formation. Accurate prediction of wellbore temperature and pressure fields is the basis of cementing slurry and cementing process design. Especially in the cement curing process, the interactions between cement hydration, temperature and pressure directly affect the quality of well cementing and safety. The reaction rate of cement hydration is affected by temperature and pressure significantly, as a result, the cement hydration properties, such as the degree of hydration and gel strength of cement slurry change with time and space[2,3]. The heat generated by cement hydration changes the cement temperature field and induces the thermal stress field, consequently, micro-fissures may be formed in the cement sheath, providing paths for gas channeling[4,5]. The cement slurry would lose “weight” during the hydration process, namely, the internal pressure of cement slurry would drop, which would provide driving force for gas channeling[6]. In addition, the special environment in deep water area leads to more complicated interactions between cement hydration, temperature and pressure. An accurate prediction model of wellbore temperature and pressure is the premise of safe and efficient cementing in deep water. ...
Colloidal gas aphron (CGA) based foam cement system
1
2019
... In recent years, offshore oil and gas exploration and development has gradually shifted from shallow waters to deep waters. Although deep water areas have a broad prospect, the complex deep water environment brings great challenges to oil and gas exploration and development[1], and well cementing is one of the typical challenges. The aim of well cementing is to isolate gas, oil and water layers and prevent gas channeling between different layers by making a complete cement sheath between the casing and formation. Accurate prediction of wellbore temperature and pressure fields is the basis of cementing slurry and cementing process design. Especially in the cement curing process, the interactions between cement hydration, temperature and pressure directly affect the quality of well cementing and safety. The reaction rate of cement hydration is affected by temperature and pressure significantly, as a result, the cement hydration properties, such as the degree of hydration and gel strength of cement slurry change with time and space[2,3]. The heat generated by cement hydration changes the cement temperature field and induces the thermal stress field, consequently, micro-fissures may be formed in the cement sheath, providing paths for gas channeling[4,5]. The cement slurry would lose “weight” during the hydration process, namely, the internal pressure of cement slurry would drop, which would provide driving force for gas channeling[6]. In addition, the special environment in deep water area leads to more complicated interactions between cement hydration, temperature and pressure. An accurate prediction model of wellbore temperature and pressure is the premise of safe and efficient cementing in deep water. ...
Field measurements of annular pressure and temperature during primary cementing
3
1983
... In recent years, offshore oil and gas exploration and development has gradually shifted from shallow waters to deep waters. Although deep water areas have a broad prospect, the complex deep water environment brings great challenges to oil and gas exploration and development[1], and well cementing is one of the typical challenges. The aim of well cementing is to isolate gas, oil and water layers and prevent gas channeling between different layers by making a complete cement sheath between the casing and formation. Accurate prediction of wellbore temperature and pressure fields is the basis of cementing slurry and cementing process design. Especially in the cement curing process, the interactions between cement hydration, temperature and pressure directly affect the quality of well cementing and safety. The reaction rate of cement hydration is affected by temperature and pressure significantly, as a result, the cement hydration properties, such as the degree of hydration and gel strength of cement slurry change with time and space[2,3]. The heat generated by cement hydration changes the cement temperature field and induces the thermal stress field, consequently, micro-fissures may be formed in the cement sheath, providing paths for gas channeling[4,5]. The cement slurry would lose “weight” during the hydration process, namely, the internal pressure of cement slurry would drop, which would provide driving force for gas channeling[6]. In addition, the special environment in deep water area leads to more complicated interactions between cement hydration, temperature and pressure. An accurate prediction model of wellbore temperature and pressure is the premise of safe and efficient cementing in deep water. ...
... Previous experiments and field tests[6, 15] showed that the pore pressure inside the cement sheath decreased as cement hydration reaction went on, which is called the weight loss of cement slurry. For this phenomenon, the theory of gel strength[20-23] gives an explanation: during the circulation stage, the cement slurry is in liquid state and can transfer all the hydrostatic pressure. Once the cement hydration reaction starts, the cement slurry increases in gel strength and changes from liquid state to gelling state. Under such circumstance, part of the hydrostatic pressure is shared by gel strength of cement slurry. Therefore, the pore pressure in the cement sheath decreases with time. Based on this theory, the relationship of cement gel strength and cement sheath pressure is given. ...
... To further validate the temperature and pressure model presented in this paper, the calculated temperatures with the model were compared with the measured temperatures in Cooke’s field test[6]. In the field test, four sensors were put on the outer surface of the casing at 1108, 1673, 2106, and 2668 m depths. A logging cable was used to collect the data from the sensors. The temperatures and pressures at different positions were measured in real time. The test well is 2712 m deep, with a 73 mm outer diameter casing, and 200 mm in wellbore diameter. The geothermal gradient of the formation is 2.12 °C/100 m. ...
Evaluation of conventional prediction method of temperature field during well cementing
1
1999
... Currently, the most commonly used method to predict wellbore temperature in the oil industry is the semi-empirical method proposed by the American Petroleum Institute (API)[7]. However, Wedelich et al.[8] pointed out that the API method always overestimated wellbore temperature by comparing with field measurements. Therefore, researchers worldwide proposed various physical models of heat conduction in well cementing[9,10,11]. Liu et al.[12] and Wang et al.[13] put forward different temperature prediction models according to different cementing processes. In terms of wellbore pressure field during cementing, Carter et al.[14] found the pressure decrease phenomenon during cement curing first. On this basis, researchers at home and abroad published relevant theoretical explanations through experiments and proposed pressure prediction models[15,16,17]. ...
Key factors that affect cementing temperatures
1
1987
... Currently, the most commonly used method to predict wellbore temperature in the oil industry is the semi-empirical method proposed by the American Petroleum Institute (API)[7]. However, Wedelich et al.[8] pointed out that the API method always overestimated wellbore temperature by comparing with field measurements. Therefore, researchers worldwide proposed various physical models of heat conduction in well cementing[9,10,11]. Liu et al.[12] and Wang et al.[13] put forward different temperature prediction models according to different cementing processes. In terms of wellbore pressure field during cementing, Carter et al.[14] found the pressure decrease phenomenon during cement curing first. On this basis, researchers at home and abroad published relevant theoretical explanations through experiments and proposed pressure prediction models[15,16,17]. ...
Field studies of circulating temperatures under cementing conditions
1
1994
... Currently, the most commonly used method to predict wellbore temperature in the oil industry is the semi-empirical method proposed by the American Petroleum Institute (API)[7]. However, Wedelich et al.[8] pointed out that the API method always overestimated wellbore temperature by comparing with field measurements. Therefore, researchers worldwide proposed various physical models of heat conduction in well cementing[9,10,11]. Liu et al.[12] and Wang et al.[13] put forward different temperature prediction models according to different cementing processes. In terms of wellbore pressure field during cementing, Carter et al.[14] found the pressure decrease phenomenon during cement curing first. On this basis, researchers at home and abroad published relevant theoretical explanations through experiments and proposed pressure prediction models[15,16,17]. ...
A two-dimensional simulator to predict circulating temperatures during cementing operations
1
1990
... Currently, the most commonly used method to predict wellbore temperature in the oil industry is the semi-empirical method proposed by the American Petroleum Institute (API)[7]. However, Wedelich et al.[8] pointed out that the API method always overestimated wellbore temperature by comparing with field measurements. Therefore, researchers worldwide proposed various physical models of heat conduction in well cementing[9,10,11]. Liu et al.[12] and Wang et al.[13] put forward different temperature prediction models according to different cementing processes. In terms of wellbore pressure field during cementing, Carter et al.[14] found the pressure decrease phenomenon during cement curing first. On this basis, researchers at home and abroad published relevant theoretical explanations through experiments and proposed pressure prediction models[15,16,17]. ...
A cementing temperature simulator to improve field practice
1
1993
... Currently, the most commonly used method to predict wellbore temperature in the oil industry is the semi-empirical method proposed by the American Petroleum Institute (API)[7]. However, Wedelich et al.[8] pointed out that the API method always overestimated wellbore temperature by comparing with field measurements. Therefore, researchers worldwide proposed various physical models of heat conduction in well cementing[9,10,11]. Liu et al.[12] and Wang et al.[13] put forward different temperature prediction models according to different cementing processes. In terms of wellbore pressure field during cementing, Carter et al.[14] found the pressure decrease phenomenon during cement curing first. On this basis, researchers at home and abroad published relevant theoretical explanations through experiments and proposed pressure prediction models[15,16,17]. ...
Discussion on influencing factors of cementing circulation temperature.
1
2012
... Currently, the most commonly used method to predict wellbore temperature in the oil industry is the semi-empirical method proposed by the American Petroleum Institute (API)[7]. However, Wedelich et al.[8] pointed out that the API method always overestimated wellbore temperature by comparing with field measurements. Therefore, researchers worldwide proposed various physical models of heat conduction in well cementing[9,10,11]. Liu et al.[12] and Wang et al.[13] put forward different temperature prediction models according to different cementing processes. In terms of wellbore pressure field during cementing, Carter et al.[14] found the pressure decrease phenomenon during cement curing first. On this basis, researchers at home and abroad published relevant theoretical explanations through experiments and proposed pressure prediction models[15,16,17]. ...
Temperature prediction technique for deep-water cementing operations
1
2006
... Currently, the most commonly used method to predict wellbore temperature in the oil industry is the semi-empirical method proposed by the American Petroleum Institute (API)[7]. However, Wedelich et al.[8] pointed out that the API method always overestimated wellbore temperature by comparing with field measurements. Therefore, researchers worldwide proposed various physical models of heat conduction in well cementing[9,10,11]. Liu et al.[12] and Wang et al.[13] put forward different temperature prediction models according to different cementing processes. In terms of wellbore pressure field during cementing, Carter et al.[14] found the pressure decrease phenomenon during cement curing first. On this basis, researchers at home and abroad published relevant theoretical explanations through experiments and proposed pressure prediction models[15,16,17]. ...
A study of completion practices to minimize gas communication
1
1972
... Currently, the most commonly used method to predict wellbore temperature in the oil industry is the semi-empirical method proposed by the American Petroleum Institute (API)[7]. However, Wedelich et al.[8] pointed out that the API method always overestimated wellbore temperature by comparing with field measurements. Therefore, researchers worldwide proposed various physical models of heat conduction in well cementing[9,10,11]. Liu et al.[12] and Wang et al.[13] put forward different temperature prediction models according to different cementing processes. In terms of wellbore pressure field during cementing, Carter et al.[14] found the pressure decrease phenomenon during cement curing first. On this basis, researchers at home and abroad published relevant theoretical explanations through experiments and proposed pressure prediction models[15,16,17]. ...
Transition time of cement slurries between the fluid and set state
2
1982
... Currently, the most commonly used method to predict wellbore temperature in the oil industry is the semi-empirical method proposed by the American Petroleum Institute (API)[7]. However, Wedelich et al.[8] pointed out that the API method always overestimated wellbore temperature by comparing with field measurements. Therefore, researchers worldwide proposed various physical models of heat conduction in well cementing[9,10,11]. Liu et al.[12] and Wang et al.[13] put forward different temperature prediction models according to different cementing processes. In terms of wellbore pressure field during cementing, Carter et al.[14] found the pressure decrease phenomenon during cement curing first. On this basis, researchers at home and abroad published relevant theoretical explanations through experiments and proposed pressure prediction models[15,16,17]. ...
... Previous experiments and field tests[6, 15] showed that the pore pressure inside the cement sheath decreased as cement hydration reaction went on, which is called the weight loss of cement slurry. For this phenomenon, the theory of gel strength[20-23] gives an explanation: during the circulation stage, the cement slurry is in liquid state and can transfer all the hydrostatic pressure. Once the cement hydration reaction starts, the cement slurry increases in gel strength and changes from liquid state to gelling state. Under such circumstance, part of the hydrostatic pressure is shared by gel strength of cement slurry. Therefore, the pore pressure in the cement sheath decreases with time. Based on this theory, the relationship of cement gel strength and cement sheath pressure is given. ...
A new approach to the prediction of gas flow after cementing
1
1989
... Currently, the most commonly used method to predict wellbore temperature in the oil industry is the semi-empirical method proposed by the American Petroleum Institute (API)[7]. However, Wedelich et al.[8] pointed out that the API method always overestimated wellbore temperature by comparing with field measurements. Therefore, researchers worldwide proposed various physical models of heat conduction in well cementing[9,10,11]. Liu et al.[12] and Wang et al.[13] put forward different temperature prediction models according to different cementing processes. In terms of wellbore pressure field during cementing, Carter et al.[14] found the pressure decrease phenomenon during cement curing first. On this basis, researchers at home and abroad published relevant theoretical explanations through experiments and proposed pressure prediction models[15,16,17]. ...
Novel technology to reduce risk lost circulation and improve cementing quality using managed pressure cementing for narrow safety pressure window wells in Sichuan Basin
1
2019
... Currently, the most commonly used method to predict wellbore temperature in the oil industry is the semi-empirical method proposed by the American Petroleum Institute (API)[7]. However, Wedelich et al.[8] pointed out that the API method always overestimated wellbore temperature by comparing with field measurements. Therefore, researchers worldwide proposed various physical models of heat conduction in well cementing[9,10,11]. Liu et al.[12] and Wang et al.[13] put forward different temperature prediction models according to different cementing processes. In terms of wellbore pressure field during cementing, Carter et al.[14] found the pressure decrease phenomenon during cement curing first. On this basis, researchers at home and abroad published relevant theoretical explanations through experiments and proposed pressure prediction models[15,16,17]. ...
Transient temperature calculation method for deep-water cementing based on hydration kinetics model
2
2017
... The heat transfer process in the formation around the wellbore is an axial symmetric diffusion process. Based on the established cylindrical coordinate system, the heat transfer model of formation can be obtained from the heat diffusion equation in the axial coordinate system[18,19]: ...
... (3) The initial temperature of cement slurry in wellbore can be calculated with the model during circulation process proposed by Sun et al.[18,19]: ...
Coupled thermal model of wellbore and permafrost in Arctic regions
2
2017
... The heat transfer process in the formation around the wellbore is an axial symmetric diffusion process. Based on the established cylindrical coordinate system, the heat transfer model of formation can be obtained from the heat diffusion equation in the axial coordinate system[18,19]: ...
... (3) The initial temperature of cement slurry in wellbore can be calculated with the model during circulation process proposed by Sun et al.[18,19]: ...
A single technique solves gas migration problems across a wide range of conditions
3
... Previous experiments and field tests[6, 15] showed that the pore pressure inside the cement sheath decreased as cement hydration reaction went on, which is called the weight loss of cement slurry. For this phenomenon, the theory of gel strength[20-23] gives an explanation: during the circulation stage, the cement slurry is in liquid state and can transfer all the hydrostatic pressure. Once the cement hydration reaction starts, the cement slurry increases in gel strength and changes from liquid state to gelling state. Under such circumstance, part of the hydrostatic pressure is shared by gel strength of cement slurry. Therefore, the pore pressure in the cement sheath decreases with time. Based on this theory, the relationship of cement gel strength and cement sheath pressure is given. ...
... In light of the pressure decrease in cement sheath, Drecq et al.[20], Parcevaux[21], and Erik et al.[22] regarded cement hydration process as the consolidation process of soil. Through experiment, they found the stress state model of soil, Terzaghi’s law, could accurately describe the stress state inside the cement sheath: ...
... The total stress of cement slurry is constant and equal to the overburden pressure of cement slurry[20,21,22]: ...
Pore size distribution of portland cement slurries at very early stage of hydration (influence of curing temperature and pressure)
3
1984
... In light of the pressure decrease in cement sheath, Drecq et al.[20], Parcevaux[21], and Erik et al.[22] regarded cement hydration process as the consolidation process of soil. Through experiment, they found the stress state model of soil, Terzaghi’s law, could accurately describe the stress state inside the cement sheath: ...
... The total stress of cement slurry is constant and equal to the overburden pressure of cement slurry[20,21,22]: ...
... The pore pressure of cement slurry decreases with the increase of cement gel strength, and the increase of cement gel strength is closely related to the cement hydration process. Therefore, when calculating pore pressure of cement slurry, the effect of cement hydration reaction should be considered. When the effective stress of cement slurry is high enough, the cement gel strength can support the self-weight, and the pore pressure of cement slurry deceases to hydrostatic pressure of pore water and remains constant[21]: ...
Well cementing.
2
2006
... In light of the pressure decrease in cement sheath, Drecq et al.[20], Parcevaux[21], and Erik et al.[22] regarded cement hydration process as the consolidation process of soil. Through experiment, they found the stress state model of soil, Terzaghi’s law, could accurately describe the stress state inside the cement sheath: ...
... The total stress of cement slurry is constant and equal to the overburden pressure of cement slurry[20,21,22]: ...
2
1974
... Previous experiments and field tests[6, 15] showed that the pore pressure inside the cement sheath decreased as cement hydration reaction went on, which is called the weight loss of cement slurry. For this phenomenon, the theory of gel strength[20-23] gives an explanation: during the circulation stage, the cement slurry is in liquid state and can transfer all the hydrostatic pressure. Once the cement hydration reaction starts, the cement slurry increases in gel strength and changes from liquid state to gelling state. Under such circumstance, part of the hydrostatic pressure is shared by gel strength of cement slurry. Therefore, the pore pressure in the cement sheath decreases with time. Based on this theory, the relationship of cement gel strength and cement sheath pressure is given. ...
... The effective stress of cement slurry is related to the static gel strength of cement slurry and changes with time. Moore[23] proposed the classic stress-strain equation to calculate the pressure required to move the cement sheath and suspension force of gel strength of cement slurry. According to the stress diagram of cement sheath (Fig. 2), the cement sheath is mainly affected by four forces. ...
A conceptual model of the cement hydration process
2
2000
... The kinetics model proposed by Krstulovic and Dabic[24] is regarded as one of the classic models of cement hydration, which is widely used in industry. Based on the hydration heat curve of cement, Krstulovic-Dabic model (K-D model) describes the quantified relationship between hydration degree of cement and time. According to the model, the cement hydration includes three processes: nucleation and crystal growth (NG), interactions at the phase boundaries (I), and diffusion (D). All the three processes could take place at one time, and one or two of them could take place, but the slowest one determines the rate of the whole hydration process. According to the K-D model, the slowest process at the beginning is NG, which is later replaced by I or D. The mathematical models of the three processes are respectively[24]: ...
... [24]: ...
The effect of cement heat of hydration on the maximum annular temperature of oil and gas wells
2
2003
... To validate the cement hydration kinetics model, the model was applied to the experiments conducted by Dillenbeck et al.[25]. In order to study the effect of cement hydration heat on temperature in wellbore, Dillenbeck et al. obtained the heat curves of cement hydration at 26.6 °C and 52.4 °C using the isothermal calorimeter (Fig. 5). ...
... In Dillenbeck’s field test[25], temperature sensors were set in the wellbore to measure the temperature in real time. Fig. 8 shows the calculated temperature results with the model presented in this paper and temperatures measured by Dillenbeck. It can be seen that the maximum error of calculated temperature by the new model considering hydration reaction is 5.6%, while the temperature predicted without considering the effect of hydration reaction have a maximum error of 24.5%. This proves that the effect of hydration reaction of cement on wellbore temperature can’t be ignored. ...
Kinetics model for the hydration mechanism of cementitious materials
1
2006
... To further validate the kinetics model proposed in this paper, the model was used to simulate experiments conducted by Yan et al.[26] using Porland cement and Portland cement mixed with expansion agent under different temperatures, and kinetics experiments of Class H cement under different pressures conducted by Pang et al[2]. Fig. 7 shows the calculated hydration degrees with this model and measured hydration degrees in these experiments. It can be seen that this model can describe the cement hydration processes of different cement slurry systems under different temperatures and pressures accurately, satisfying the requirement of field engineering. ...


