

Introduction
Mass production of marine shale oil in the latest years has boosted rapid oil production increase in the US, and annual shale oil yield has accounted for over half of its oil production [1-2]. Shale oil enabled the US to become self-sufficient in petroleum and also reshaped the global energy pattern [3-4]. The exploration and production of lacustrine shale oil in China is in its infancy, but deepened basic geologic theories and technical advance led to the great progress in the exploration of shale beds in the Paleogene Kongdian [5⇓⇓⇓-9] and Shahejie [10⇓⇓-13] formations, the Bohai Bay Basin, the Permian Lucaogou Formation in the Jimsar sag [14] and Permian Fengcheng Formation in the Mahu sag [15], the Junggar Basin, the Cretaceous Qingshankou Formation in the Songliao Basin [16], and the Triassic Yanchang Formation in the Ordos Basin [17]. Shale oil in several basins has been put into economic production. Complicated tectonic conditions, strong heterogeneity, and greatly different maturities and oil properties in continental petroliferous basins, China, resulted in heterogeneous per-horizontal well yield and challenges of keeping stable high production, which are restricting mass production of lacustrine shale oil in China with good economic benefit. As stated in the "Research on China’s Shale Oil Development Strategy", more efforts on the exploration and production of lacustrine shale oil and gas in China have become an important way to ensure the country's energy security, and shale oil with medium to high maturity is a key field of strategic breakthrough at present [18].
The Cangdong sag is a Cenozoic faulted lake basin in the Bohai Bay Basin, East China. The second member of the Paleogene Kongdian Formation (Kong 2 Member for short) rich in shale oil was formed in a semi-deep to deep sedimentary province in the lake basin. It is a typical deep-basin lacustrine laminated shale system of 400 m thick. Despite its large size of potential shale oil resources, there are also challenges of figuring out major controls over stable high production and how shale oil production goes. With the Kong 2 Member in the Cangdong sag as an example, we used 700 m systematic cores, over 100 000 analysis data, oil testing and production testing data of 37 horizontal wells that were put into production, and well logging data to investigate key theories and technologies related to stable high production of deep-basin lacustrine shale oil. The study results provide a support to continental shale oil exploration deployment and production planning in China.
1. Regional geologic setting and overview of exploration and production
1.1. Regional geologic setting
The Cangdong sag lies among the Cangxian uplift, Xuhei salient, and Kongdian salient in central Bohai Bay Basin, and it is a faulted lake basin formed in a regional extensional environment in the Paleogene. The Cangdong sag is horizontally divided into 5 tectonic units, i.e. the Nanpi slope, Kongdong slope, Kongxi slope, Kongdian structural zone, and Shenüsi faulted nose structure [19-20]. Major sedimentary formations are the Kongdian Formation, including the Kong 3, Kong 2, and Kong 1 members from bottom up. The Kong 2 Member was deposited with thick mud shales intercalated with sandstones in the lake flooding period. Braided-river deltaic coarse-grained sediments, which are mainly medium sandstones and finestones, occur in the marginal basin, and mud shales mainly occur in the central basin (Fig. 1 a). The Kong 2 Member is divided into 4 fourth-order sequences (SQEk24- SQEk21) and 10 fifth-order sequences (Ek21SQ①-Ek24SQ⑩) from the bottom up[21] (Fig. 1 b). The sequences of SQEk23- SQEk21 are the shale interval of 300-500 m thick and 1187 km2 in area with high organic matter abundance, in which there are 21 single layers that can be tracked and correlated in the whole region.
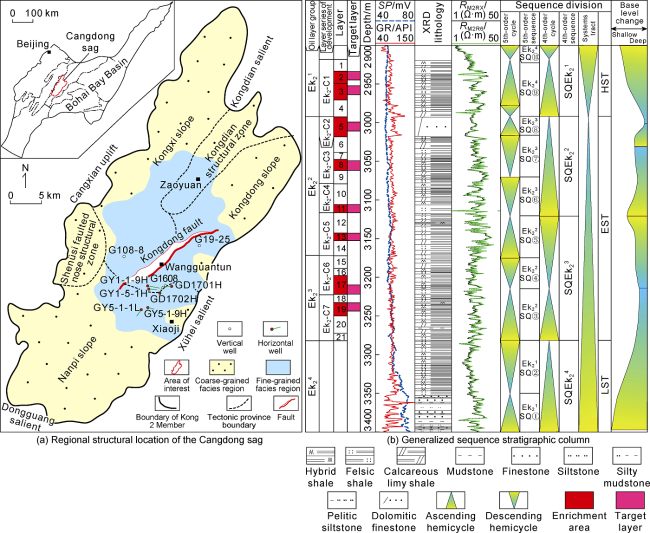
Fig. 1. (a) Regional structural location of the Cangdong sag and (b) generalized sequence stratigraphic column. LST—lowstand systems tract; EST—expansion systems tract; HST—high systems tract. |
1.2. Overview of exploration and production in lacustrine shale oil
We proposed a hierarchical scheme of shale oil classification [10,22]. Shale oil was classified into two types, i.e. migrated shale oil by sandstones and in-situ shale oil, which were subdivided into 5 subtypes, i.e. laminated, hybrid, sandwiched, interbedded, and thick layered. Jiao et al. proposed the classification of shale oil with 3 types, that is, “laminated, hybrid and shale”[23]. The Kong 2 shale oil was enriched in-situ shale-type shale oil.
To make a breakthrough in the exploration of in-situ laminated shale oil in Cangdong sag, the PetroChina Dagang Oilfield Company performed detailed sag-wide structure interpretation and sedimentary microfacies study of fifth-order sequences from 2008 to 2013 to establish a circle-like sedimentary texture in the lake basin [24]. Shale oil was predicted to occur in the inner circle. Well G108-8 was drilled and cored in the years from 2014 to 2016. Based on Kong 2 cores of 500 m long across the whole member, 7 properties of Kong 2 shale oil were established. Vertical well G1608 yielded daily oil flow of 47.1 t, which demonstrated the potential of Kong 2 shale oil exploration. Two wells, GD1701H and GD1702H, deployed in 2017 for pilot test yielded daily oil of 68.3 t at a maximum. This breakthrough marked the accomplishment of economic oil flow from lacustrine shale-type shales using horizontal well. Stable production had been maintained for more than 700 d till January 2022, and cumulative oil production reached 2.0×10⁴ t. Since 2019, there have been 44 horizontal wells finished on 8 pads, 40 wells fractured, and 37 wells started up for shale oil production in the Cangdong sag. Four wells yielded oil flow over a hundred tons, and cumulative oil production has reached 17.8×10⁴ t. A demonstration area has been established for in-situ shale- type shale oil production with annual yield of 10×104 t.
Shale oil exploration expanded to the Sha 3 Member in the Qikou sag. Well B56-1H deployed in 2020 yielded daily oil of 38.4 t at a maximum with cumulative oil production of 6 183 t and flowback rate of 18.56% after blow off for 397 d. Another breakthrough was made in the risk-taking exploration of shale oil in the lower part of Sha 1 Member (Lower Sha 1 for short), the Qikou sag, in 2021. Well QY1H yielded daily oil of 80 m3 at a maximum with cumulative oil production of 3 919 t and flowback rate of 13.85% after blow off for 170 d.
2. Theories and technologies of lacustrine shale oil enrichment and high production
With efforts over 10 years, some theories and technologies involving accumulation and enrichment, target optimization, drilling site deployment, fracturing, and development strategy have been innovated to support stable high production of lacustrine shale oil.
2.1. Shale oil enrichment theories
2.1.1. High-graded shales with “three highs and one low” as the material basis of shale oil enrichment
According to the 700 m systematic cores acquired from Wells G108-8 and G19-25 and over 100 000 analysis data, the Kong 2 shales geologically feature “three highs and one low”, i.e. high-frequency laminated texture, high organic matter abundance, high content of brittle minerals (e.g. felsic minerals), and low clay content, which are the material basis of shale oil generation and enrichment [5,22]. Organic matter is mainly of type-I and type-II1; the TOC content ranges 2%-6% with the average of 4.87% and the maximum up to 12.92%. Good source properties are the basis of shale oil generation. Reservoir space is mainly composed of matrix pores, e.g. nano- to micron-scale organic matter-hosted pores, intergranular pores, intercrystalline pores, and dissolved pores, and microfractures (e.g. interlaminar fractures, structural fractures, abnormal pressure-induced fractures, and diagenetic shrinkage fractures), which function as the pathways and supporters of shale oil migration and accumulation (Fig. 2 ). Microscopically superimposed source-reservoir rhythmic units composed of various mineral associations are favorable for shale oil accumulation and enrichment, and lamina density may reach 11 000/m (Fig. 3 ). The S1 value ranges 0.3-12.4 mg/g with the average of 3.21 mg/g. Oil content exceeds 18 mg/g in some felsic laminae. The OSI value ranges 23.6-735.6 mg/g with the average of 168.6 mg/g. Shale particle diameter is generally smaller than 0.062 5 mm, and 75% of minerals show particle diameter below 0.003 9 mm. Such minerals include terrigenous clasts (quartz and feldspar), carbonates (calcite and dolomite), and clay and other minerals (analcime, pyrite, etc.). Terrigenous clast content over 50% and clay mineral content of 16% on the average are the engineering basis of high-efficiency fracturing stimulation.
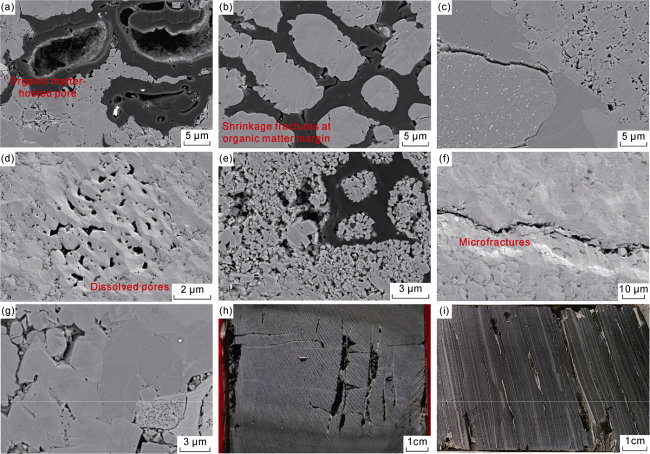
Fig. 2. Reservoir space types in Kong 2 shales, the Cangdong sag. (a) Well GX12X1, 2 568.86 m, SEM, felsic shales, organic matter-hosted pores; (b) Well GX12X1, 2 571.21 m, SEM, felsic shales, shrinkage fractures at organic matter margin; (c) Well G19-25, 3 380.07 m, SEM, hybrid shales, grain marginal fractures and intercrystalline pores; (d) Well G108-8, 2 977.18 m, SEM,calcareous limy shales, dissolved pores; (e) Well G19-25, 3 361.26 m, SEM, calcareous limy shales, intercrystalline pores; (f) Well G108-8, 2 978.83 m, SEM, hybrid shales, microfractures; (g) Well GX12X1, 2 567.96 m, SEM, calcareous limy shales, intergranular pores; (h) Well G108-8, 2 980.32-2 980.40 m, core, calcareous limy shales, abnormal pressure-induced fractures; (i) Well G108-8, 3 170.23-3 170.32 m, core, felsic shales, bedding fissures. |
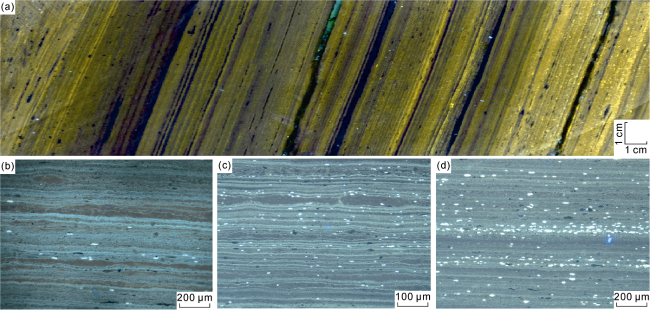
Fig. 3. Laminae and oil-bearing properties of Kong 2 shales, the Cangdong sag. (a) Well G19-25, 3 367.63-3 367.93 m, felsic laminae with yellowish white moderately bright light, core fluorescence scanning image; (b) Well G19-25, 3 355.95 m, felsic shales, felsic laminae with bluish white moderately bright light, fluorescence; (c) Well G108-8, 3 109.86 m, felsic shales, white moderately bright fluorescence, mainly oily bitumen gathering in laminae, fluorescence; (d) Well G108-8, 3 210.03 m, white bright fluorescence, gathering in laminae, fluorescence. |
2.1.2. Moderate to high thermal evolution favorable for shale oil enrichment
Our studies [5,8,22] showed that for various kerogen types, oil rate per unit organic matter first increases and then decreases with increasing Ro. At the thermal evolution of 0.7%-1.2%, corresponding to the buried depth of 3300-4300 m, movable hydrocarbons in shales may be as large as 20%-60% of total hydrocarbons. As per the relation between average daily oil production, converted into oil output from a horizontal section of 1000 m long after stable production for 180 d, and Ro for 20 horizontal wells drilled in the Cangdong sag (Fig. 4 ), the production is commonly above 5 t/d at Ro of 0.7%-1.1% and shale oil production increases with increasing Ro. Moderate to high thermal evolution with large size of occluded hydrocarbons in shales, high gas-oil ratio, and low oil viscosity are the prerequisites to high shale oil production.
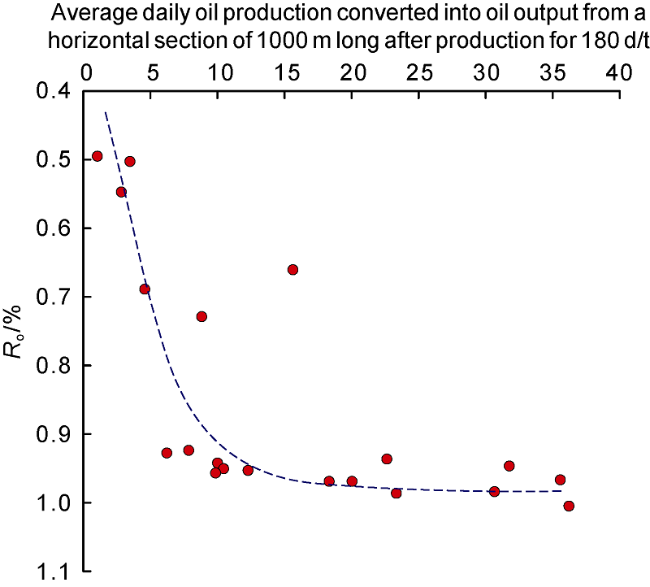
Fig. 4. Relation between Ro and average daily oil production converted into oil output from a horizontal section of 1000 m long after production for 180 d. |
2.1.3. Laminated felsic shales as the best enriched intervals of lacustrine shale-type shale oil
We classified Kong 2 shales in the Cangdong sag into 4 fabric facies, i.e. laminated felsic shale, laminated hybrid shale, thin layered calcareous limy shale, and thick layered calcareous limy shale [5]. Laminated felsic shales feature high felsic content, high-frequency laminae, high TOC content, and skip effect. Nano-CT and nuclear magnetic resonance (NMR) tests showed laminated porosity with good connectivity and high movable fluid saturation of 46.7% [24]. The best enriched intervals are those with oil content of 20 mg/g obtained from felsic laminae samples using the Soxhlet extraction. The production profile of Well GD1702H showed that laminated felsic shales are the dominant contributor to shale oil production, with the length accounting for 38.5% of total horizontal section, oil yield accounting for 74.8% of whole-well production, and daily oil production per hundred meters exceeding 3 t. Laminated felsic shales mainly occur in prodelta and semi-deep lake areas where the content of imported felsic minerals is high. In deep lake areas with small content of felsic minerals, there are mainly carbonate laminae and clay laminae with organic matter; laminated carbonate rocks are the enriched intervals of shale oil in these areas.
2.2. Sweet spotting technologies
Based on the above discussion of shale oil generation and enrichment, 7 parameters, i.e. TOC content, Ro, shale thickness, S1, OSI, brittleness index, and porosity, were established from the perspectives of oil-bearing properties, hydrocarbon generation, reservoir properties, and fracturability of shale layers. Sweet spotting is based on these 7 parameters and seismic attributes inversion of felsic shale fabric facies.
2.2.1. Evaluation of shale oil enrichment layers
Property, storage capacity, oil content and fracability of source rock are the main factors affecting shale oil enrichment [8,10,22,25,26]. Based on the test results of over 12000 core samples from Well G108-8 etc, TOC, Ro, S1, OSI and brittleness index and porosity [10, 22, 25] for shale oil enrichment layers have been figured out. In the burial depth interval of medium-high thermal evolution degree (Ro 0.7%-1.2%), the shale layers with TOC>2%, S1>2 mg•g-1, OSI>100 mg•g-1, brittleness index >50%, porosity >3%, and continuous thickness >10 m are taken as shale oil enrichment layers (Table 1 ). It is found from the evaluation results of drilled wells in the study area the shale oil enrichment layers are generally 10-40 m thick. Drilling targets with higher oil contents and better fracability are further defined in the shale oil enrichment layers as the landing window for horizontal wells. Specifically, shale oil enrichment layers with TOC >2%-4% (studies show it is not the higher the TOC, the better, for pure shale type shale oil, shale layers with a medium TOC range would have higher oil content and good oil mobility [8,10]), S1>3 mg•g-1, OSI> 150 mg•g-1, brittleness index >75%, porosity>5%, and continuous thickness >10 m are taken as drilling targets (Table 1 ). Drilling targets in the study area are 10-15 m thick each.
Table 1. Evaluation parameters and criteria of shale-type shale oil enriched intervals and drilling targets (modified from reference [26]) |
| Evaluated object | Source property | Oil-bearing property | Fracturability | Reservoir property | |||
|---|---|---|---|---|---|---|---|
| TOC/% | Ro/% | Continuous shale thickness/m | S1/(mg·g-1) | OSI/(mg·g-1) | Brittleness index/% | Porosity/% | |
| Enrichment layer | >2 | 0.7-1.2 | >10 | >2 | >100 | >50 | >3 |
| Drilling target | 2-4 | 0.7-1.2 | >10 | >3 | >150 | >75 | >5 |
Through evaluation, 8 shale oil enrichment layers have been sorted out in the 363.6 m thick shale suite of Kong 2 Member in Cangdong Sag, and 8 drilling targets suitable for horizontal well drilling and fracturing have been picked out from the 8 shale oil enrichment layers (Fig 1 b).
Log-constrained seismic inversion was performed to improve the success rate of well drilling. According to the lithologic and electric responses at Well G108-8, shales show low density, high acoustic time, and high resistivity; felsic shales show high acoustic time, medium density, and medium to high resistivity; calcareous limy shales show low acoustic time, high density, and high resistivity; hybrid shales show low acoustic time, high to medium density, and medium to high resistivity. Shales differ greatly from sandstones and mudstones in log responses. Thus, two log parameters, i.e. acoustic time and resistivity that are sensitive to laminated felsic shales, were inverted through resistivity pseudo-sonic inversion and velocity inversion using amplitude-preserved seismic data after frequency enhancement (with dominant frequency improved from 18 Hz to 25 Hz). Based on inversion results, low-impedance mudstones and sandstones were filtered out. Inverted resistivity and velocity were jointly used to predict lithologic sweet spots and drilling targetes.
The above-mentioned technologies have helped improve the success rate of enriched interval drilling and well production (Fig. 5 ). The targetes layer at Wells GY5-1-1L and GY5-1-9H were drilled to be 9 m thick, and the success rate of enriched interval drilling was improved from early 55% to above 90%. With respect to Well GY5-1-1L, for example, the average daily oil production after production for 180 d reached 28.3 t, 22.4 t more than of Well GY1-1-5H finished earlier with the same shale series at a neighboring platform. Converted average daily oil production per 100 m after production for 180 d was increased from 1.4 t to 4 t.
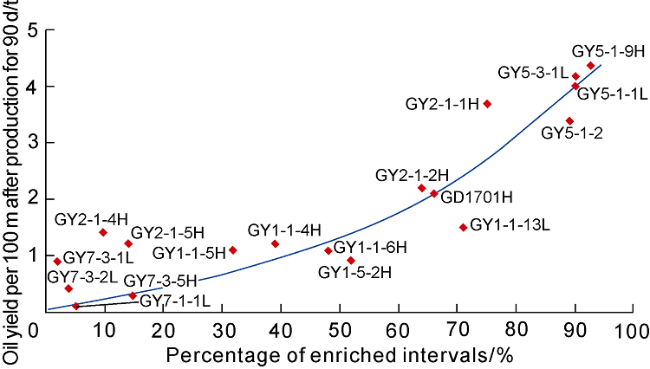
Fig. 5. Correlation between oil yield per 100 m after production for 90 d and the success rate of enriched interval drilling, the Kong 2 Member, the Cangdong sag. |
2.2.2. Shale oil enriched zone evaluation
Enriched zone evaluation was based on seismic attributes and multi-well geologic evaluation. Free hydrocarbon, organic carbon content, and brittle mineral content were interpreted using log data [10,25] and superposed upon thermal maturity and structure maps for geologic evaluation. Log-constrained fusion inversion was performed using reconstructed acoustic time and resistivity. In the first sub-member of the Kong 2 Member (Fig. 6 ), for example, Class-I to Class-III sweet spots were predicted to be 417 km2 using comprehensive geologic evaluation and fusion inversion in accordance with structural buried depth and oil testing data (Fig. 6 b). The Class-I and class-II sweet spots show high impedance (Fig. 6 a), with brittle mineral content of 75%, Ro >0.6%, average TOC >2%, buried depth of 3000-4200 m, and high-graded sweet-spot interval of above 10 m thick. The Class-III sweet spots generally show medium to low impedance and extend in the low-gradient Guanxi slope in the Cangdong sag.
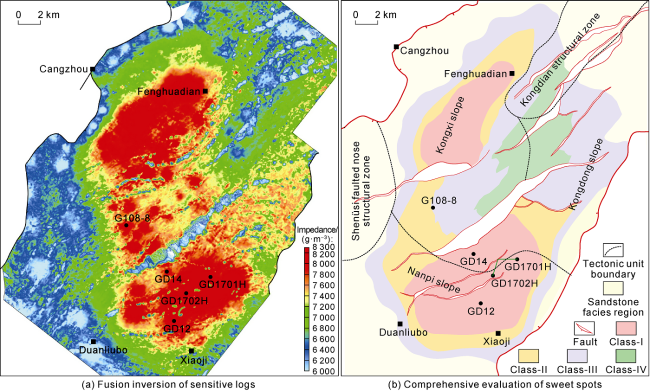
Fig. 6. (a) Fusion seismic inversion of sensitive logs and (b) comprehensive evaluation of sweet spots in the first sub-member of the Kong 2 Member, the Cangdong sag. |
2.3. Shale oil horizontal well pattern deployment technologies
2.3.1. Horizontal well spacing optimization
Well spacing interval of 130-400 m was tested for optimization. Wells GD1702H and GY1-1-6H were spaced 130 m apart at No.1 pad. Daily oil production of Well GD1702H declining from 12.00 t to 1.85 t caused by fracturing operation at Well GY1-1-6H, which was not recovered after flowing back for nearly 11 months, demonstrates that fracturing interference tended to occur at the small spacing of 130 m. Five wells, including GY5-1-1L, GY5-1-9H, and GY5-3-1L, were spaced 260-300 m apart at No.5 pad. No detected interference occurred during fracturing, and daily well production was stably maintained above 30 t after these wells were put into production. This means that well interference of fracturing and recovery can be avoided at the horizontal well spacing of 260-300 m. In accordance with fracture monitoring of 37 horizontal wells using the potential method and acoustic emission, the half-length of hydraulic fractures is about 100 m on the average and the largest half-length ranges 140-150 m given the proppant injection of 2.5-2.8 m3/m and fluid injection of 25-32 m3/m [22]. According to the comprehensive analysis, the spacing of 300 m is taken as an ideal choice for present scale of fracturing.
2.3.2. Horizontal well azimuth and length optimization
The Cangdong sag is a faulted sag, and casing deformation may occur when the horizontal wellbore passes through a fault. This means that the horizontal well should be deployed within a fault block as much as possible to avoid faults, which restricts the length of the horizontal section. According to numerical simulations, cumulative oil production will reach a maximum when the included angle between the horizontal wellbore track and the major principal stress is equal to 90°. At the same angle, the increment of cumulative oil production increases with the length of horizontal section. Thus, horizontal well azimuth should be perpendicular to the major principal stress as far as possible to generate large stimulated reservoir volume (SRV) by fracturing; meanwhile, the length of horizontal section should be increased as much as possible. Orthogonal multipole array sonic logging (XMAC) and horizontal well fracturing monitoring showed that regional principal stress is mainly at NE 30°-45°, and the included angle between horizontal well azimuth and the major principal stress generally ranges 60°-90° during field drilling operation. Production increase may be realized by properly adjusting horizontal well azimuth and increasing the length of horizontal section. For example, the wellbore track of GY5-1-9H drilled at No.5 pad intersects the major principal stress at 73°. Acoustic emission monitoring showed a complicated fracture network with large SRV. The maximum daily oil production was 192 m3, and cumulative oil production reached 10 348 t after stable production for 420 d. The wellbore track of GY7-1-1L drilled at No.7 pad intersects the major principal stress at 20°. Fracturing monitoring using the potential method showed hydraulic fractures extending along the wellbore at small angles and small SRV. Cumulative oil production only reaches 470 t by far after production for 503 d.
2.4. Fracturing technologies
2.4.1. Stage and cluster
We proposed an integrated geologic-engineering scheme, including lithologic association dominated fracturing stage, four-high dominated cluster, and differentiated design, for stage and cluster optimization [27]. In detail, fracturing is preferentially conducted in laminated felsic shale association. The sites with high gas logging responses, high resistivity, high TOC content or S1 value, and high fracturability are set as the cluster points for perforation and fracturing. Differentiated design refers to customized fracturing technology for different lithologies and casing deformation risks. Multi-stage multi-cluster (7-9 clusters per stage) fracturing with long single stage of 70-120 m was employed for laminated felsic shales with good fracturability. A fracturing scheme with 5-7 clusters per stage and single stage of 50-80 m long was employed for calcareous limy shales with poor fracturability to improve fracture aperture and SRV [22]. Stage or cluster interval was increased where there were risks of casing deformation, for example, caused by a sudden change in dogleg, to control the scale of fracturing and avoid casing deformation.
2.4.2. Materials
To satisfy the double requirements for the fracturing fluids to carry enough sands and produce a fracture network in shale oil reservoirs, a low-viscosity slick water system was optimized with 0.1% drag reducer B + 0.5% clay stabilizer + 0.3% cleanup additive + 0.05% gel breaker, the drag reduction rate and anti-swelling rate were tested to be over 70% and 85%, respectively. A high-viscosity slick water system was developed with 0.5%-0.7% drag reducer B + 0.5% clay stabilizer + 0.3% cleanup additive + 0.05% gel breaker. After high-speed shearing for 75 min, the variable-viscosity slick water system still maintained the viscosity above 40 mPa·s and gel cracking fluid viscosity of 1.80 mPa·s. Numerical simulations of multi-grade fractures showed flow conductivity of 1.55 μm2·cm for first-grade fractures with haydite proppant of 0.212-0.425 mm (40/70 meshes) and 0.13 μm2·cm for second-grade fractures with quartz-sand proppant of 0.100-0.212 mm (70/140 meshes). The ratio of quartz sands to haydite was prepared to be 7:3 and the ratio of low-viscosity slick water to high-viscosity slick water was prepared to be 8:2, which greatly reduced the cost of raw material.
2.4.3. Volume fracturing process
To address the issues of high fracturability, low sensitivity of fractures to proppant ratio, small fluctuation of operating pressure, and easy sands injection for laminated felsic shales, a method of high-starting continuous sands injection was employed. The displacement was directly raised to 12 m3/min. The sand ratio was set to be 10% at the beginning and gradually elevated to 22%. The sand-fluid ratio was set to be 10% to improve sands injection per unit fluid volume and stimulated volume by effective fractures (Fig. 7 ). To address the issues of high initial pressure of fracturing, difficulty in raising displacement, insufficient net pressure in fractures, and small fracture width for calcareous limy shales, the assembled techniques were designed to be reverse hybrid pumping + multi-stage slug + continuous sand fracturing. High-viscosity slick water was injected first to generate fractures, which were enlarged by slug-type sands injection to provide pathways for proppant entrance. The operating pressure was lowered, and continuous sands injection was performed to ensure the intensity of sands injection (Fig. 7 ).
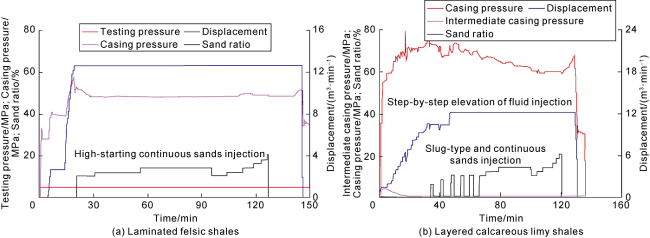
Fig. 7. Typical operation curves for (a) laminated felsic shales and (b) layered calcareous limy shales. |
2.5. Drainage-production system optimization
2.5.1. Numerical simulation to determine minimum well soaking time
Oil-water imbibition and replacement can be fully realized through well soaking. According to numerical simulations, oil saturation in fractures increased with increasing soaking time from 18% at the beginning to 50% after soaking for 15 d and then became sable after 15 d. Wellhead pressure monitoring for 35 horizontal wells showed that wellhead pressure all remarkably declined at the initial stage of well soaking and became stable after soaking for 15 d. This means that post-frac soaking should be maintained for at least 15 d for shale oil reservoirs, and the well could be started up when continuous wellhead pressure drop is smaller than 0.1 MPa/d for 3 d (Fig. 8 ).
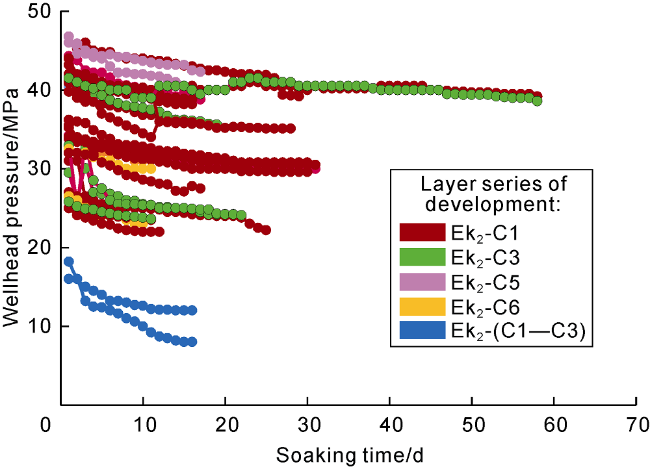
Fig. 8. Wellhead pressure variation with well soaking time at different horizontal wells. |
2.5.2. Venting adjustment based on pressure drop
Wellbore temperature field simulations at different fluid productions showed when daily fluid production exceeds 35 m3, wellhead temperature will be higher than wax crystal temperature, which can effectively prevent wax precipitation in the horizontal wellbore. In accordance with the backflow model of frac sands and the calculation of critical sand-carrying flow rate, daily fluid production of 23-80 m3 may mitigate frac sands back flow, prevent wellbore blockage, and prolong the production cycle. Thus, daily fluid production of shale oil wells is determined to be 35-80 m3 to prevent wax precipitation and sand plug.
To maximize horizontal-well shale oil production in the flow period, the choke is usually adjusted in accordance with the production change rate per unit pressure drop and the slope of choke coefficient curve to guarantee effective matching between boosting output and wellhead pressure change. When the wellhead pressure is higher than 15 MPa, the slope of choke coefficient curve is larger than 0, and the pressure drops too fast, so the choke should be turned down. When the pressure is 5-15 MPa, the slope of choke coefficient curve is smaller than 0, and the fluid production drops too fast, so the choke should be turned up. When the pressure is 2-5 MPa, the slope of choke coefficient curve is equal to 0, and the pressure drops in reconcilement with fluid production, so the stable production can be maintained for a period of time. When the pressure is below 2 MPa, the pump can be run in duly.
2.5.3. Lifting optimization
As per the Pearson correlation between cumulative fluid production and daily fluid production of 15 horizontal wells after pumping production for 360 d, cumulative fluid production is dependent on depth of plunger, pump diameter, and working system. To satisfy the requirements for low-mobility shale oil production with large pressure difference and controlled fluid recovery rate, a package of small-pump deep-pumping techniques were established with optimized pump diameter of 38-44 mm and depth of plunger of 2200-2500 m. First, large depth and large pressure difference could promote oil flow, and oil recovery with high pumping efficiency at the late stage could be maintained at the submergence depth over 200 m. Second, small displacement may guarantee sufficient oil-water replacement, preserve producing energy, and effectively reduce water cut. Third, frequent small pump replacement or pump inspection could be evaded after fluid production decline at the late stage, improving production time efficiency by 5%.
In view of varied fluid production, deep liquid level, and high wax content in shale oil wells, the methods of eccentric wear prevention, sand control, and corrosion prevention successfully applied to conventional oil recovery were used for reference to establish a system of derrick long strike pumping unit for failed well controlling. The parameters were optimized to be 7-10 m for the largest stroke, 3 strokes per minute at maximum, and 5-66 m3/d for fluid production, which is 32% larger than that of a conventional pumping unit. Comprehensive energy consumption is 38% lower than of a conventional beam-pumping unit. Such an intelligent controlled pumping system, with pump diameter of 38 mm and pump landing depth of 2500 m, was applied to oil recovery at Wells GY2-1-4H and GY2-1-5H in 2021, and oil production capacity was increased by 22 t/d.
3. Practices of lacustrine shale-type shale oil production
3.1. Production results
With respect to the production performance data of 37 wells in 7 pads, the Cangdong sag, 28 wells were defined to be normal production wells with stable production for more than 90 d and water cut lower than 50% (Fig. 9 ); the average fractured horizontal section was 797 m long and average daily oil production was 17.6 t. The quadrant method was used to establish the template of production at the initial stage of production and the stage of stable production. All the wells were divided into three classes, i.e. class-I, class-II, and class-III, in a descending order of production. According to the statistics, there were 2 class-I wells, 10 class-II wells, and 16 class-III wells. By April, 2022, the daily oil production of 28 producers was stabilized at 300-350 t, and cumulative oil production reached 17.8×10⁴ t.
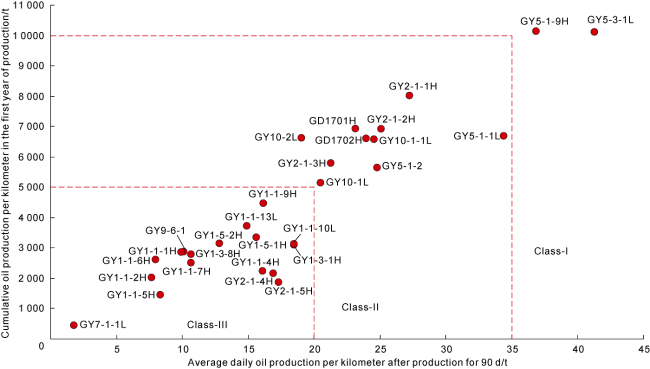
Fig. 9. Hierarchical evaluation of normal production wells in the Cangdong sag. |
Four wells, i.e. GY5-1-1L, GY5-1-9H, GY1-1-9H, and GY1-5-1H that were put into production in 2021, obtained oil production over one hundred tons. Well GY5-1-1L, with 16-stage fracturing of 945 m long using fracturing fluids of 30 133 m3 and sands of 2522.6 m3, obtained converted daily oil production of 208 m3 after venting for 4 h using the choke of 6 mm. Daily oil production was 24.6 t on the average during production testing of 226 d (Fig. 10 ). By April 1, 2022, cumulative oil production reached 7361 t, and flowback rate was 9.62%. The EUR of this well was anticipated to be 3.14×10⁴ t.
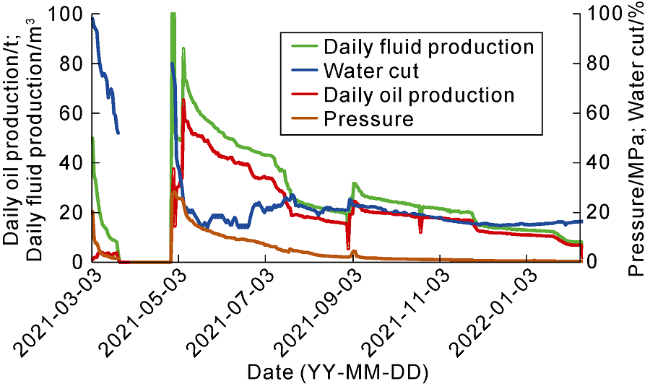
Fig. 10. Production testing curve of Well GY5-1-1L. |
3.2. Trends of production
3.2.1. Staged production decline
In accordance with horizontal-well production data, shale oil production is accomplished after soaking, flowing, plug drilling, de-plugging, and pump landing. Shale oil may be produced through natural flow and mechanical recovery. Oil production declines exponentially in the natural flow period. The flush stage is expected to be 4-6 months for the horizontal section of 400-600 m long and 10-18 months for the horizontal section above 1 000 m long, and thus the decline rate is calculated to be 60%-85% (Fig. 11 ). Mechanical recovery is divided into two stages, i.e. step-like decline and stable production. At the former stage, the production reached a peak and then began to decline (10 months) with average decline rate of 53.7% and monthly decline rate of 7.8%. When monthly decline rate was smaller than 3%, stable production began. Monthly decline rate consistently remained at 1.5-3.0% in a long period of time (Fig. 12 ).
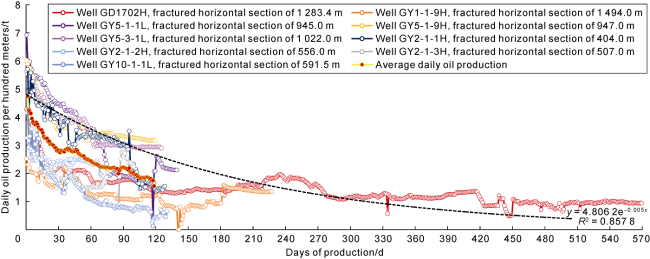
Fig. 11. Average daily oil production variation during natural flow production of stabilized shale oil wells. |
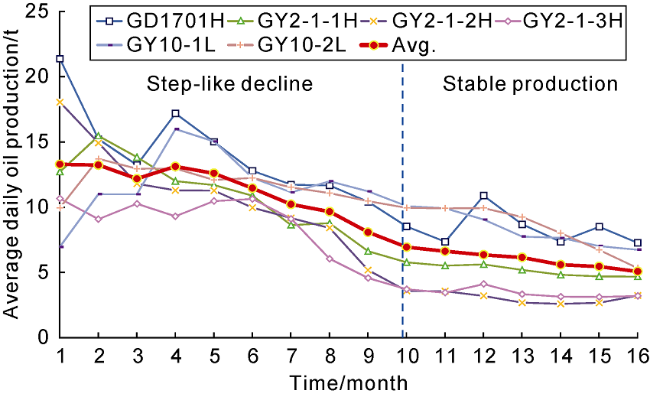
Fig. 12. Average daily oil production variation during mechanical recovery of stabilized shale oil wells. |
3.2.2. Time lapse of hydrocarbon components in recovered shale oil
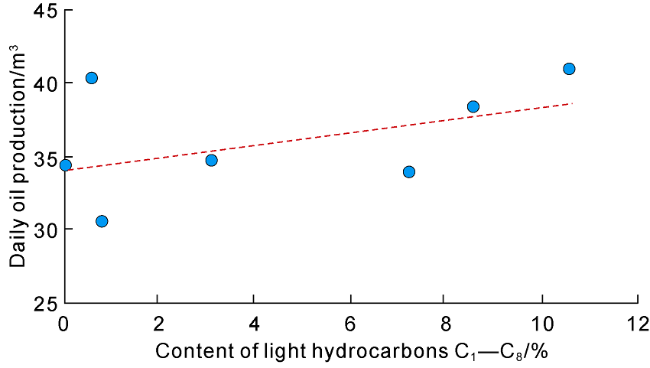
During horizontal-well production testing, hydrocarbon components in recovered shale oil, especially heavy hydrocarbon composition, varied greatly with time. Oil chromatogram was tested 8 times for Well GY5-1-9H. A pattern of dual peaks, with high percentage of light hydrocarbons, dominated over the initial period of recovery. The relative content of heavy hydrocarbons increased after 5-month production, and the dual-peak pattern changed into the single-peak pattern. In view of the influence of engineering operation, crude oil components changed regularly in the time interval between two operations. The content of light components C1-C13 decreased gradually, and the relative content of components C14+ increased with time (Fig. 13 ). The content of light components C1-C8 was directly correlated with daily oil production. In other words, the higher the content of light components, the higher the oil production will be (Fig. 14 ).
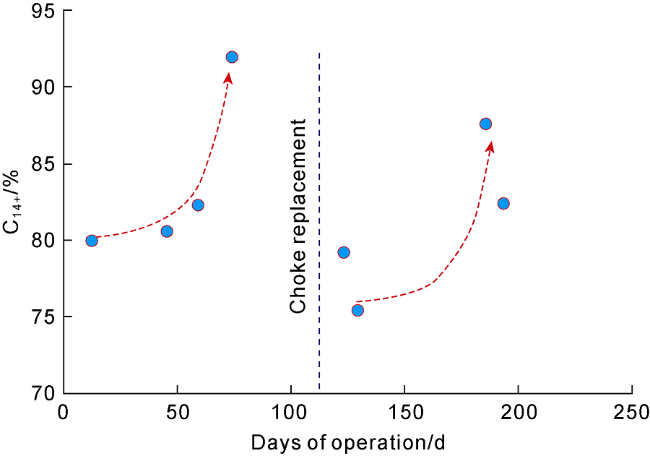
Fig. 13. Variations of components C14+ at Well GY5-1-9H in different periods. |
Fig. 14. Correlation between light component content and daily oil production at Well GY5-1-9H in different periods. |
4. Conclusions
Shale oil in the Kongdian Formation, the Cangdong sag, is typical lacustrine shale-type shale oil in Kong 2 Member geologically characterized by high-frequency laminae, high organic matter abundance, high content of brittle minerals, low clay content, and swarmed micron- to nano- scale pores and fractures with high abundance of in-situ hydrocarbon resources and large exploration potential. Single-well daily oil production reached 208 m3 at a maximum, setting a record of shale-type shale oil production by far. The shale-type shale oil accumulation and enrichment theories and the technologies, such as target layer evaluation and prediction, horizontal well pattern deployment, customized fracturing technology, and drainage-production system optimization, guided target layer optimization, drilling site deployment, and high- efficiency fracturing and appropriate drainage and production in the Huanghua Depression to address the theoretical and technical issues of shale oil enrichment, development planning, and engineering. We also investigated shale-type shale oil production decline in natural flow period (exponential decrease) and mechanical recovery (stepwise decrease) as well as the positive correlation between hydrocarbon components proportion and daily oil production in recovered shale oil, which are significant to development plan adjustment, drainage-production system optimization, and single-well EUR enhancement. The theories and technologies of shale oil enrichment and high production are useful guideline and can be applied to shale oil exploration and production in those prospects with similar geologic conditions.
Nomenclature
EUR—expected ultimate recovery, t;
GR—gamma ray, API;
OSI—movable oil index, mg/g;
RM2R6—array induction log curve with vertical resolution of 0.61 m (2 ft) and radial investigation depth of 1.52 m (60 in), Ω·m;
RM2RX—array induction log curve with vertical resolution of 0.61 m (2 ft) and radial investigation depth of 3.04 m (120 in), Ω·m;
SP—natural potential, mV;
S1—pyrolytic free hydrocarbon content, mg/g.