

Introduction
The external oil and gas dependence of China continues to climb year after year. The lack of oil and gas self-sufficiency has a great impact on national economic development and national energy security [1-2]. Strengthening international cooperation to share global oil and gas resources has become a realistic choice to ensure national energy security. Since 2020, the global oil and gas industry has suffered the worst pandemic in a century, faced a global recession unprecedented in nearly a century and experienced the most severe price drop in the oil market in 160 years [3]. Despite these three major challenges, Chinese oil companies have implemented the development strategy of “going out,” used “two markets” and “two resources,” expanded foreign oil and gas cooperation and supported the national “One Belt, One Road” initiatives. This is both a rare opportunity and a serious challenge. On the one hand, global oil and gas resources are still very abundant, with huge development potential, and the position of oil and gas in the energy structure is still difficult to be rapidly replaced in the short term. Despite the far-reaching impact of the U.S. shale oil revolution on the global oil market, energy development, and geopolitics, onshore conventional oil and gas still dominate the composition of global oil and gas production, and Chinese oil companies still have bright prospects in these advantageous areas. However, with the global wave of decarbonization and accelerated energy transition, the efficient development of natural gas resources is highly favored and has shifted from upstream development to full industry chain development. Over the past decade, oil and gas discoveries have been constantly made in the offshore, with new reserves accounting for more than 80% of the total. Technology and equipment advances and cost decreases have jointly driven offshore oil and gas development from shallow water to deep water and ultra-deepwater [4⇓⇓⇓-8], but Chinese oil companies face the constraints of a low proportion of overseas gas assets and insufficient technology reserves for offshore development. With a globalized and internationalized research perspective, this paper analyzes the current situation and characteristics of global oil and gas development in 2021, summarizes the global oil and gas development situation and development trend, and puts forward insights and suggestions. This endeavor was undertaken for conducting overseas oil and gas cooperation, to provide references for Chinese oil companies and private enterprises to conduct international oil and gas cooperation.
1. Global oil and gas development status and characteristics
Since 2021, with the effective control of the global COVID-19 pandemic and the rebound and continuous rise of international oil prices, the imbalance between global oil and gas supply and demand has been reversed, and the global oil and gas development situation has shown recovery. Meanwhile, global resource-host countries have become more cautious about oil and gas fiscal-tax policy adjustment, and many countries have become investment hotspots in the oil and gas industry. The investment in oil and gas development as well as the number of new oil and gas fields in production has seen growth [9⇓-11]. According to Wood Mackenzie data[12], four aspects of status and characteristics for global oil and gas development have been statistically analyzed and summarized as follows.
1.1. Oil and gas fields are widely distributed, with a large number of non-producing oil and gas fields
By the end of 2021, there were 16 328 oil and gas fields worldwide, including 9395 oil fields and 6933 gas fields; 3911 oil and gas fields in production, including 2725 oil fields and 1186 gas fields; and 12 417 oil and gas fields not in production, including 6670 oil fields and 5747 gas fields. The fields are mainly located in 133 resource-host countries across six regions, namely, Central Asia-Russia, the Middle East, Africa, the Americas, the Asia-Pacific, and Europe. The reasons for oil and gas fields to stop production are divided into six categories: (1) with low economic value for development, totaling 7203; (2) under construction, totaling 2148; (3) production has been stopped and production facilities have not been dismantled, totaling 1871; (4) production facilities have been abandoned and dismantled, totaling 696; (5) undeveloped for technical reasons, totaling 418; (6) in the preparation stage for production, totaling 81. In terms of regional distribution, most of the abandoned and dismantled oil and gas fields are in the Americas, accounting for 65.09%; most of the discontinued and not dismantled oil and gas fields are in Europe and the Americas, accounting for 64.54%; most fields with low economic value for development are in the Asia-Pacific region, accounting for 25.68%; the majority of fields undeveloped for technical reasons are in the Europe region, accounting for 29.9%; most fields under construction are located in the Americas, accounting for 47.72%; and the number of oil and gas fields in the preparation stage for production is insignificant in all six regions (Table 1 ).
Table 1. Number of global oil and gas fields in 2021 |
| Region | Oil and gas fields in production | Oil and gas fields not in production | Total | ||||||
|---|---|---|---|---|---|---|---|---|---|
| Oil field | Gas field | Oil and gas field | Oil field | Gas field | Oil and gas field | Oil field | Gas field | Oil and gas field | |
| Africa | 349 | 69 | 418 | 1025 | 489 | 1514 | 1374 | 558 | 1932 |
| Asia Pacific | 255 | 207 | 462 | 1028 | 1576 | 2604 | 1283 | 1783 | 3066 |
| Europe | 376 | 253 | 629 | 1151 | 1138 | 2289 | 1527 | 1391 | 2918 |
| Central Asia-Russia | 403 | 132 | 535 | 1547 | 623 | 2170 | 1950 | 755 | 2705 |
| Americas | 1187 | 465 | 1652 | 1523 | 1756 | 3279 | 2710 | 2221 | 4931 |
| Middle East | 155 | 60 | 215 | 396 | 165 | 561 | 551 | 225 | 776 |
| Total | 2725 | 1186 | 3911 | 6670 | 5747 | 12 417 | 9 395 | 6933 | 16 328 |
1.2. Slight decline in oil and gas reserves, with unconventional oil and gas reserves declining sharply
By the end of 2021, the global remaining economically recoverable reserves in terms of hydrocarbon equivalent are 2074.27×108 t and the remaining technically recoverable reserves are 4352.38×108 t. Among them, the remaining economically recoverable reserves of crude oil are 1215.14× 108 t and the remaining technically recoverable reserves are 2389.17×108 t; the remaining economically recoverable reserves of natural gas are 101.74×10¹² m3, and the remaining technically recoverable reserves are 232.49×10¹² m3. The remaining technically recoverable reserves of oil and gas present the distribution characteristics of “two large, one medium, and three small”: the “two large” regions refer to the Middle East and the Americas, both of which account for more than 25% of the world's remaining technically recoverable reserves; the “one medium” region refers to the Central Asia-Russia region, and the share of remaining technically recoverable reserves in the world is 18.11%; the “three small” regions refer to Africa, the Asia-Pacific, and Europe, and the share of remaining technically recoverable reserves in the world is less than 10% in all three regions (Table 2 ).
Table 2. Distribution of the world's remaining recoverable reserves in six regions in 2021 |
| Region | Crude oil/108 t | Natural gas/1012 m3 | Oil and gas equivalent/108 t | |||
|---|---|---|---|---|---|---|
| Economically | Technically | Economically | Technically | Economically | Technically | |
| Middle East | 536.89 | 982.00 | 23.93 | 91.64 | 738.99 | 1 755.81 |
| Americas | 380.63 | 904.78 | 28.99 | 36.82 | 625.47 | 1 215.69 |
| Central Asia-Russia | 186.08 | 295.82 | 29.06 | 58.33 | 431.43 | 788.35 |
| Africa | 57.24 | 116.37 | 5.48 | 18.72 | 103.49 | 274.45 |
| Asia Pacific | 33.05 | 53.63 | 11.58 | 21.41 | 130.87 | 234.47 |
| Europe | 21.25 | 36.57 | 2.70 | 5.57 | 44.02 | 83.61 |
| Total | 1 215.14 | 2 389.17 | 101.74 | 232.49 | 2 074.27 | 4 352.38 |
By the end of 2021, the top 10 hydrocarbon-bearing basins in the world accounted for 69.10% of the world's remaining technically recoverable reserves. The top three basins in terms of remaining technically recoverable reserves of oil and gas are the Rubkhaali Basin, the Vidin- North Arabian Gulf Basin, and the Maturin Sub-Basin; the top three basins in terms of remaining technically recoverable reserves of crude oil are the Vidin-North Arabian Gulf Basin, the Rubkhaali Basin, and the Maturin Sub-Basin; and the top three basins in terms of remaining technically recoverable reserves of natural gas are the Rubkhaali Basin, the Western Siberia (South Kara Sea/Yamal) Basin, and the Zagros Basin (Table 3 ).
Table 3. Statistics of the remaining recoverable reserves in the top ten oil and gas bearing basins |
| Basin | Crude oil/108 t | Natural gas/1012 m3 | Oil and gas equivalent/108 t | |||
|---|---|---|---|---|---|---|
| Economically | Technically | Economically | Technically | Economically | Technically | |
| Rub' Al-Khali Basin | 143.77 | 313.23 | 15.45 | 65.35 | 274.21 | 865.03 |
| Widyan-North Arabian Gulf Basin | 347.91 | 535.88 | 5.91 | 12.59 | 397.80 | 642.22 |
| Maturin Sub-Basin | 15.63 | 301.08 | 0.04 | 1.68 | 15.96 | 315.25 |
| Western Canada-Alberta Basin | 64.14 | 221.16 | 4.62 | 5.44 | 103.13 | 267.11 |
| Zagros Basin | 81.53 | 124.76 | 8.70 | 13.28 | 155.03 | 236.90 |
| Western Siberian (Central) Basin | 41.37 | 122.92 | 1.22 | 10.62 | 51.68 | 212.62 |
| Western Siberia (South Kara Sea/Yamal) Basin | 10.43 | 20.10 | 11.38 | 19.92 | 106.53 | 188.32 |
| Appalachian Basin | 84.65 | 84.65 | 4.03 | 4.03 | 118.70 | 118.70 |
| Delaware Basin | 11.24 | 11.24 | 8.46 | 8.46 | 82.65 | 82.65 |
| Niger Delta Basin | 11.38 | 34.80 | 0.83 | 5.20 | 18.36 | 78.70 |
The top ten resource-host countries account for 78.35% of the world's remaining technically recoverable reserves of oil and gas. There are two resource-host countries whose remaining technically recoverable reserves of oil and gas account for more than 10% of the global total, five for 5%-10%, and three for less than 5%. There are six resource-host countries whose remaining technically recoverable reserves exceed 300×108 t, three between (100-300)×108 t, and one with less than 100×108 t. There are six resource-host countries in the Middle East region, with 50.14% reserves, among which the main reservoirs in Qatar and Iran are marine gas, and the main reservoirs in Saudi Arabia, UAE, Iraq, and Kuwait are onshore conventional crude oil. There are three resource- host states located in the Americas, with reserves accounting for 31.18%. The main oil and gas reservoir types in Venezuela and Canada are unconventional crude oil. There is one resource-host state located in the Central Asia-Russia region, and the main reservoir types in Russia are onshore conventional natural gas (Table 4 ).
Table 4. Statistics of the remaining technically recoverable reserves of oil and gas in the top ten resource countries |
| Country | Region | Number of oil and gas fields | Technically remaining recoverable reserves/108 t | Major oil and gas types | ||
|---|---|---|---|---|---|---|
| Oil field | Gas field | Oil and gas field | ||||
| Russia | Central Asia-Russia | 1537 | 445 | 1982 | 636.96 | Onshore conventional natural gas accounted for 48.56% and onshore conventional crude oil accounted for 36.50% |
| Qatar | Middle East | 19 | 20 | 39 | 526.75 | Marine natural gas accounted for 75.74% and marine crude oil accounted for 23.68% |
| United States | Americas | 1364 | 1750 | 3114 | 414.47 | Unconventional crude oil accounted for 47.0% and unconventional natural gas accounted for 42.79% |
| Saudi Arabia | Middle East | 90 | 35 | 125 | 393.72 | Onshore conventional crude oil accounted for 44.72% and offshore crude oil accounted for 30.40% |
| Venezuela | Americas | 212 | 23 | 235 | 358.04 | 79.72% of unconventional crude oil and 11.38% of onshore conventional crude oil |
| Iran | Middle East | 103 | 77 | 180 | 310.07 | Offshore natural gas accounted for 32.84% and onshore conventional crude oil accounted for 31.96% |
| Canada | Americas | 377 | 125 | 502 | 290.85 | 74.31% of unconventional crude oil |
| UAE | Middle East | 45 | 23 | 68 | 198.29 | Onshore conventional crude oil accounted for 27.99% and offshore crude oil accounted for 22.97% |
| Iraq | Middle East | 144 | 15 | 159 | 193.32 | Onshore conventional crude oil accounted for 86.27% |
| Kuwait | Middle East | 22 | 1 | 23 | 87.79 | Onshore conventional crude oil accounted for 88.51% |
By the end of 2021, the remaining technically recoverable reserves of the world's top 10 oil and gas fields accounted for 12.01% of the world's total reserves. By regional location, nine of the world's top 10 oil and gas fields are located in the Middle East and one in the Central Asia-Russia region. The remaining technically recoverable reserves of crude oil in the top ten fields account for 14.37% of the global reserves, and there are five fields with remaining technically recoverable reserves of crude oil greater than 30×108 t, four fields with (25-30) × 108 t, and one field with less than 25 × 108 t. Nine of the top ten fields are located in the Middle East and one in the Central Asia-Russia region. The top 10 global gas fields with remaining technically recoverable reserves of natural gas account for 17.28% of the global technical remaining reserves of natural gas, and there are five fields with the remaining technically recoverable reserves of natural gas greater than 3×10¹² m3, three fields with (2-3) × 1012 m3, and two fields with less than 2×10¹² m3; among the top 10 gas fields, 5 are located in the Middle East region, accounting for 10.51%, and 5 are located in the Central Asia-Russia region, accounting for 6.77% of global gas reserves (Tables 5 , 6 and 7 ).
Table 5. Statistics of remaining technically recoverable reserves of oil and gas in the top ten oil and gas fields |
| Oil and gas field | Region | Crude oil/108 t | Natural gas/1012 m3 | Oil and gas equivalent/108 t | |||
|---|---|---|---|---|---|---|---|
| Economically | Technically | Economically | Technically | Economically | Technically | ||
| South Pars Gas Field | Middle East | 10.68 | 17.90 | 4.19 | 8.00 | 46.10 | 85.42 |
| Northern Gas Field | Middle East | 12.74 | 12.74 | 8.50 | 8.50 | 84.52 | 84.52 |
| Ghawar Oil Field | Middle East | 54.33 | 54.33 | 0.28 | 0.28 | 56.69 | 56.69 |
| South Iolotan Gas Field | Central Asia-Russia | 0.18 | 0.67 | 1.55 | 5.60 | 13.26 | 47.99 |
| Jafurah Basin Gas Field | Middle East | 3.54 | 30.22 | 0.23 | 2.01 | 5.45 | 47.22 |
| Safaniya Oil Field | Middle East | 23.89 | 44.25 | 0.08 | 0.11 | 24.57 | 45.16 |
| Greater Burgan Oil Field | Middle East | 24.64 | 40.92 | 0.23 | 0.23 | 26.60 | 42.88 |
| Zuluf Oil Field | Middle East | 19.97 | 40.33 | 0.07 | 0.13 | 20.54 | 41.46 |
| Abu Dhabi Uncon Gas Field | Middle East | 0 | 0 | 0 | 4.53 | 0 | 38.21 |
| ADNOC Onshore Oil Field | Middle East | 30.03 | 33.02 | 0 | 0.01 | 30.03 | 33.12 |
Table 6. Statistics of the remaining technically recoverable reserves in the top ten oil fields |
| Oil field | Region | Crude oil/108 t | Natural gas/1012 m3 | Oil and gas equivalent/108 t | |||
|---|---|---|---|---|---|---|---|
| Economically | Technically | Economically | Technically | Economically | Technically | ||
| Ghawar Oil Field | Middle East | 54.33 | 54.33 | 0.28 | 0.28 | 56.69 | 56.69 |
| Safaniya Oil Field | Middle East | 23.89 | 44.25 | 0.08 | 0.11 | 24.57 | 45.16 |
| Greater Burgan Oil Field | Middle East | 24.64 | 40.92 | 0.23 | 0.23 | 26.60 | 42.88 |
| Zuluf Oil Field | Middle East | 19.97 | 40.33 | 0.07 | 0.13 | 20.54 | 41.46 |
| ADNOC Onshore Oil Field | Middle East | 30.03 | 33.02 | 0 | 0.01 | 30.03 | 33.12 |
| Shaybah Oil Field | Middle East | 19.82 | 25.12 | 0 | 0.57 | 19.82 | 29.89 |
| Abu Dhabi Uncon Oil Field | Middle East | 0 | 29.85 | 0 | 0 | 0 | 29.85 |
| Northern Fields | Middle East | 17.99 | 23.13 | 0.36 | 0.54 | 21.06 | 27.65 |
| Khurais Oil Field | Middle East | 26.64 | 26.64 | 0.08 | 0.08 | 27.30 | 27.30 |
| Yuganskneftegaz | Central Asia-Russia | 19.38 | 25.79 | 0.14 | 0.14 | 20.54 | 26.97 |
Table 7. Statistics of the remaining technically recoverable reserves in the top ten gas fields |
| Gas field | Region | Crude oil/108 t | Natural gas/1012 m3 | Oil and gas equivalent/108 t | |||
|---|---|---|---|---|---|---|---|
| Economically | Technically | Economically | Technically | Economically | Technically | ||
| South Pars Gas Field | Middle East | 10.68 | 17.90 | 4.19 | 8.00 | 46.10 | 85.42 |
| Northern Gas Field | Middle East | 12.74 | 12.74 | 8.50 | 8.50 | 84.52 | 84.52 |
| South Iolotan Gas Field | Central Asia-Russia | 0.18 | 0.67 | 1.55 | 5.60 | 13.26 | 47.99 |
| Jafurah Basin Gas Field | Middle East | 3.54 | 30.22 | 0.23 | 2.01 | 5.45 | 47.22 |
| Abu Dhabi Uncon Gas Field | Middle East | 0 | 0 | 0 | 4.53 | 0 | 38.21 |
| Tambeiskoye | Central Asia-Russia | 0 | 0.83 | 2.11 | 3.43 | 17.86 | 29.84 |
| Shtokmanovskoye | Central Asia-Russia | 0 | 0.49 | 0 | 2.75 | 0 | 23.75 |
| ADNOC Gas Project | Middle East | 11.21 | 11.21 | 0.77 | 1.39 | 17.68 | 22.93 |
| Bovanenkovskoye | Central Asia-Russia | 0.43 | 0.43 | 2.15 | 2.15 | 18.56 | 18.56 |
| Yamburgskoye | Central Asia-Russia | 0.28 | 0.63 | 1.71 | 1.81 | 14.70 | 15.93 |
Global remaining technically recoverable reserves of oil and gas in 2021 decreased slightly year-on-year by 66.21 × 10⁸ t hydrocarbon equivalent by 1.50%. In terms of changes in different types of reserves, the remaining technically recoverable reserves of unconventional oil and gas in 2021 are 1136.26×108 t oil and gas equivalent, accounting for 26.11% of the world total. Compared with 2020, the remaining technically recoverable reserves of unconventional oil and gas are reduced by 78.16×10⁸ t oil and gas equivalent, by 6.44% year-on-year, with unconventional natural gas decreasing the most, by 10.1×10¹² m3, a decrease of 20.65% (Table 8 ). Heavy oil is the largest unconventional oil and gas reserve type in the world, followed by oil sands, whereas coalbed methane has the least amount of oil and gas reserves. The Americas is the region with the largest unconventional oil and gas reserves. The remaining technically recoverable reserves of unconventional oil and gas in the Americas are 928.01×10⁸ t oil and gas equivalent, accounting for 82.12% of the global unconventional oil and gas reserves, and the main unconventional oil and gas types are heavy oil, oil sands, shale gas, tight oil, and shale oil, etc. The Middle East, with 150.86×10⁸ t unconventional oil and gas equivalent reserves, accounting for 13.35% of the world unconventional total, the main types are tight gas and shale gas, comes in second (Fig. 1 ).
Table 8. Characteristics of year-on-year changes in different types of oil and gas reserves |
| Type | Reserves in 2020 | Reserves in 2021 | Amount of change | Rate of change/% | ||||||||
|---|---|---|---|---|---|---|---|---|---|---|---|---|
| Crude oil/108 t | Natural gas/ 1012 m3 | Oil and gas equivalent/ 108 t | Crude oil/ 108 t | Natural gas/ 1012 m3 | Oil and gas equivalent/ 108 t | Crude oil/ 108 t | Natural gas/ 1012 m3 | Oil and gas equivalent/ 108 t | Crude oil | Natural gas | Oil and gas equivalent | |
| Onshore conventional oil and gas | 1027.18 | 82.63 | 1724.90 | 1011.70 | 85.23 | 1731.36 | -15.48 | 2.60 | 6.46 | -1.51 | 3.15 | 0.37 |
| Offshore oil and gas | 572.64 | 107.37 | 1479.27 | 568.91 | 108.45 | 1484.76 | -3.73 | 1.08 | 5.49 | -0.65 | 1.01 | 0.37 |
| Unconventional oil and gas | 801.43 | 48.91 | 1214.42 | 808.56 | 38.81 | 1136.26 | 7.13 | -10.10 | -78.16 | 0.89 | -20.65 | -6.44 |
| Total | 2401.25 | 238.91 | 4418.59 | 2389.17 | 232.49 | 4352.38 | -12.08 | -6.42 | -66.21 | -0.50 | -2.69 | -1.50 |
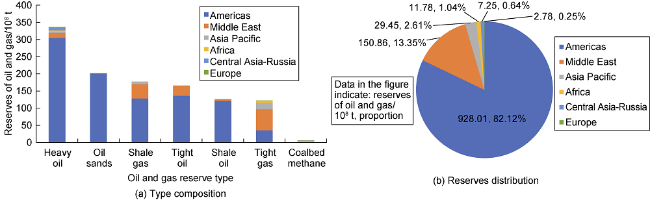
Fig. 1. Composition of unconventional oil and gas reserves types and reserves distribution. |
The remaining technically recoverable reserves of oil and gas in global marine waters in 2021 are 1484.76×108 t hydrocarbon equivalent, accounting for 34.11% of the world, an increase of 5.49×10⁸ t hydrocarbon equivalent by 0.37% compared with 2020, including an increase of 1.08×10¹² m3 by 1.01% in marine gas year-on-year (Table 8 ). The increase of the remaining technically recoverable reserves of oil and gas in the sea area comes from mainly: 3.8×10⁸ t oil and gas equivalent in the Middle East, 3.54×10⁸ t oil and gas equivalent in the Americas, and 3.36×10⁸ t oil and gas equivalent in Central Asia-Russia, while the technical remaining reserves of oil and gas in the sea area of Europe, Africa, and the Asia-Pacific have all decreased to different degrees. The reserves of shallow water oil and gas in the sea area are mainly located in the Middle East, the that of deep water oil and gas are mainly located in Africa, the Asia-Pacific, and the Americas, and the that of ultra-deepwater oil and gas are mainly located in the Americas and Africa (Fig. 2 ).
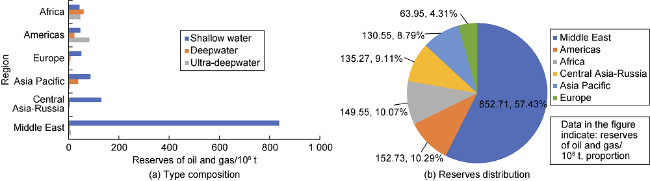
Fig. 2. Composition of offshore oil and gas reserves types and reserves distribution. |
The global remaining technically recoverable reserves of onshore conventional oil and gas in 2021 of 1731.36× 108 t oil and gas equivalent, accounting for 39.78% of the world, increased by 6.46×10⁸ t oil and gas equivalent by 0.37% compared with 2020, of which onshore conventional crude oil decreased by 15.48×10⁸ t oil and gas equivalent by 1.51% year-on-year (Table 8 ). The remaining technically recoverable reserves of onshore conventional oil and gas in the Middle East are 752.25×10⁸ t oil and gas equivalent, accounting for 43.45% of the type; 645.74×10⁸ t oil and gas equivalent in Central Asia-Russia, accounting for 37.3%; and 133.97×10⁸ t oil and gas equivalent in the Americas, accounting for 7.74%. In terms of national reserves distribution, Russia ranks first in the world with 541.79×10⁸ t of oil and gas equivalent, followed by Saudi Arabia with 208.36×10⁸ t of oil and gas equivalent (Fig. 3 ).
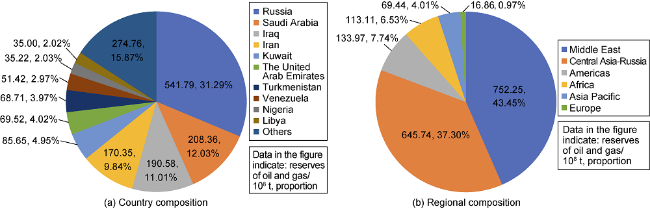
Fig. 3. Country composition and region composition of remaining recoverable reserves from onshore conventional oil and gas technologies. |
In terms of changes of reserves in different regions, the Americas is the main region where oil and gas remaining technically recoverable reserves decreased year-on-year, decreasing 126.6×10⁸ t oil and gas equivalent, a decrease of 9.43%; the Central Asia-Russia region is the main region where oil and gas remaining technically recoverable reserves increased year-on-year, increasing 76.22×10⁸ t oil and gas equivalent, an increase of 10.7%. In terms of changes in oil and gas reserves, the Central Asia-Russia region is the main region where crude oil reserves increased year- on-year, using 31.78×108 t by 12.04%; and the Americas region is the main region of natural gas reserves decrease year-on-year, by 11.63×10¹² m3 by 24.00% (Table 9 ).
Table 9. Characteristics of year-on-year changes in oil and gas reserves in different regions |
| Time Region | Reserves in 2020 | Reserves in 2021 | Amount of change | Rate of change/% | ||||||||
|---|---|---|---|---|---|---|---|---|---|---|---|---|
| Crude oil/ 108 t | Natural gas/ 1012 m3 | Oil and gas equivalent/ 108 t | Crude oil/ 108 t | Natural gas/ 1012 m3 | Oil and gas equivalent/ 108 t | Crude oil/ 108 t | Natural gas/ 1012 m3 | Oil and gas equivalent/ 108 t | Crude oil | Natural gas | Oil and gas equivalent | |
| Africa | 117.31 | 18.73 | 275.45 | 116.37 | 18.72 | 274.45 | -0.94 | -0.01 | -1.00 | -0.80 | -0.05 | -0.36 |
| Asia Pacific | 57.14 | 21.96 | 242.54 | 53.63 | 21.41 | 234.47 | -3.51 | -0.55 | -8.07 | -6.14 | -2.50 | -3.33 |
| Europe | 37.51 | 5.55 | 84.41 | 36.57 | 5.57 | 83.61 | -0.94 | 0.02 | -0.80 | -2.51 | 0.36 | -0.95 |
| Americas | 933.16 | 48.45 | 1342.29 | 904.78 | 36.82 | 1215.69 | -28.38 | -11.63 | -126.60 | -3.04 | -24.00 | -9.43 |
| Middle East | 992.09 | 91.15 | 1761.77 | 982.00 | 91.64 | 1755.81 | -10.09 | 0.49 | -5.96 | -1.02 | 0.54 | -0.34 |
| Central Asia- Russia | 264.04 | 53.07 | 712.13 | 295.82 | 58.33 | 788.35 | 31.78 | 5.26 | 76.22 | 12.04 | 9.91 | 10.70 |
| Total | 2401.25 | 238.91 | 4418.59 | 2389.17 | 232.49 | 4352.38 | -12.08 | -6.42 | -66.21 | -0.50 | -2.69 | -1.50 |
1.3. Oil and gas production continues to grow, with large year-on-year production increases in key resource-host countries
The global oil and gas production in 2021 is 77.92×10⁸ t hydrocarbon equivalent, including 44.07×10⁸ t crude oil and 40 084.11×10⁸ m3 natural gas. Oil and gas production also shows the distribution characteristics of “two large, one medium and three small”: the “two large” regions refer to the Americas and the Middle East, both with oil and gas production greater than 20×108 t oil and gas equivalent in 2021, the “one medium” region refers to the Central Asia-Russia region, with 2021 oil and gas production of 14.28×10⁸ t oil and gas equivalent, and the “three small” regions refer to Africa, the Asia-Pacific, and Europe, with 2021 oil and gas production of less than 10×108 t oil and gas equivalent (Table 10 ).
Table 10. Global oil & gas production distribution in six regions in 2021 |
| Region | Crude oil/108 t | Natural gas/108 m3 | Oil and gas equivalent/108 t |
|---|---|---|---|
| Americas | 14.73 | 12 558.98 | 25.33 |
| Middle East | 14.01 | 7429.78 | 20.29 |
| Central Asia-Russia | 6.65 | 9032.47 | 14.28 |
| Asia Pacific | 3.34 | 6284.54 | 8.65 |
| Africa | 3.65 | 2611.24 | 5.85 |
| Europe | 1.69 | 2167.10 | 3.52 |
| Total | 44.07 | 40 084.11 | 77.92 |
Influenced by the bottoming out of international oil prices, global oil and gas production in 2021 will increase by 2.32×10⁸ t oil and gas equivalent year-on-year by 3.07%, with significant changes in oil and gas production characteristics in key resource-host countries. Compared with 2020, there are 10 resource-host countries with crude oil production changes greater than 400×104 t in 2021, among which Libya is the resource-host country with the largest increase in crude oil production, mainly onshore conventional crude oil, with an increase of 4116.47×104 t year-on-year; Nigeria is the resource-host country with the largest decrease in crude oil production, mainly onshore conventional crude oil, with a year-on- year decrease of 236.16×10⁴ t. Compared to 2020, the top ten resource-host countries with a change in global gas production greater than 50×108 m3 in 2021 all achieve year-on-year growth in gas production, with Russia being the resource-host country with the largest increase in gas production, dominated by onshore conventional natural gas, with a year-on-year increase of 590.40×10⁸ m3 of onshore conventional natural gas (Tables 11 and 12 ).
Table 11. Changes in crude oil production in major resource countries |
| Resource countries | Oil production/104 t | Total change/104 t | Main types of changes | Amount of changes/104 t | |
|---|---|---|---|---|---|
| 2020 | 2021 | ||||
| United States | 81 690.650 | 81 180.38 | -510.27 | Tight oil | -2640.04 |
| Onshore conventional crude oil | -511.36 | ||||
| Shale gas condensate | -862.86 | ||||
| Shale oil | 3098.49 | ||||
| Deepwater crude oil | 506.25 | ||||
| Saudi Arabia | 52 817.690 | 54 186.080 | 1368.38 | Onshore conventional crude oil | 926.00 |
| Shallow water crude oil | 402.59 | ||||
| Russia | 50 709.450 | 52 376.040 | 1666.59 | Onshore conventional crude oil | 1556.73 |
| Canada | 25 999.680 | 28 351.010 | 2351.33 | Oil sands | 1386.27 |
| Shale gas condensate | 743.14 | ||||
| Onshore conventional crude oil | 296.01 | ||||
| Iraq | 21 067.070 | 21 559.830 | 492.76 | Onshore conventional crude oil | 485.09 |
| Iran | 15 866.930 | 16 275.720 | 408.79 | Onshore conventional crude oil | 404.05 |
| Nigeria | 9052.730 | 8472.020 | -580.71 | Onshore conventional crude oil | -236.16 |
| Deepwater crude oil | -178.12 | ||||
| Heavy oil | 63.51 | ||||
| Shallow water crude oil | -118.99 | ||||
| Libya | 1652.355 | 6114.115 | 4461.76 | Onshore conventional crude oil | 4116.47 |
| Angola | 6104.625 | 5699.840 | -404.79 | Deepwater crude oil | -376.68 |
| Shallow water crude oil | -21.54 | ||||
| United Kingdom | 4759.965 | 4281.815 | -478.15 | Shallow water crude oil | -414.27 |
| Deepwater crude oil | -48.18 | ||||
| Heavy oil | -15.70 | ||||
Table 12. Changes in natural gas production in major resource countries |
| Resource countries | Natural gas production/108 m3 | Total change/108 m3 | Main types of changes | Volume of change/108 m3 | |
|---|---|---|---|---|---|
| 2020 | 2021 | ||||
| United States | 9249.21 | 9401.01 | 151.80 | Onshore conventional natural gas | -40.99 |
| Shale gas | 250.65 | ||||
| Shale oil-associated gas | 148.45 | ||||
| Tight oil-associated gas | -228.43 | ||||
| Russia | 6601.43 | 7213.17 | 611.74 | Onshore conventional natural gas | 590.40 |
| Shallow water natural gas | 20.53 | ||||
| Qatar | 1891.07 | 1955.32 | 64.25 | Shallow water natural gas | 65.28 |
| China | 1626.23 | 1711.02 | 84.78 | Shale gas | 19.38 |
| Tight gas | 31.93 | ||||
| Onshore conventional natural gas | 17.28 | ||||
| Shallow water natural gas | 11.12 | ||||
| Canada | 1482.04 | 1596.21 | 114.17 | Tight gas | 166.10 |
| Onshore conventional natural gas | -59.54 | ||||
| Saudi Arabia | 940.15 | 1072.26 | 132.11 | Shallow water natural gas | 97.39 |
| Onshore conventional natural gas | 31.63 | ||||
| Algeria | 875.76 | 980.90 | 105.14 | Onshore conventional natural gas | 91.40 |
| Tight gas | 13.74 | ||||
| Turkmenistan | 637.70 | 689.92 | 52.22 | Onshore conventional natural gas | 52.14 |
| Egypt | 602.12 | 685.97 | 83.85 | Deepwater gas | 91.46 |
| Onshore conventional natural gas | -13.61 | ||||
| Uzbekistan | 464.39 | 553.37 | 88.98 | Onshore conventional natural gas | 88.98 |
By the end of 2021, the top 10 countries in oil and gas production account for 69.67% of global production. The top ten countries account for 68.51% of the global crude oil production; the top ten countries account for 70.59% of the global natural gas production. The U.S. leads the world in crude oil and natural gas production, with 26.10% of crude oil production and 34.23% of natural gas production in the top 10 countries. The U.S. has the largest number of oil and gas fields in production at 2019, accounting for 39.63% of the top 10 countries (Table 13 ). Among the top 10 fields in terms of production in 2021, there are eight in the Middle East, accounting for 15.40% of total global crude oil production; one in the Americas, accounting for 1.21% of total global crude oil production; and one in the Central Asia-Russia region, accounting for 1.81% of total global crude oil production. Among the top ten gas fields in terms of production in 2021, the Middle East has four, accounting for 10.82% of total global gas production, and the Central Asia-Russia region has four, accounting for 7.52% of total global gas production (Tables 14 and 15 ).
Table 13. Characteristics of oil and gas production in the top ten countries |
| Country | Region | Oil and gas fields in production Quantity | Crude oil/ 108 t | Natural gas/ 108 m3 | Total equivalent/ 108 t |
|---|---|---|---|---|---|
| United States | Americas | 2019 | 8.12 | 9401.01 | 16.06 |
| Russia | Central Asia-Russia | 1702 | 5.24 | 7213.17 | 11.33 |
| Saudi Arabia | Middle East | 100 | 5.42 | 1072.26 | 6.32 |
| Canada | Americas | 315 | 2.84 | 1596.21 | 4.18 |
| Iran | Middle East | 135 | 1.63 | 2721.00 | 3.93 |
| China | Asia Pacific | 346 | 1.86 | 1711.02 | 3.30 |
| UAE | Middle East | 49 | 2.06 | 459.52 | 2.45 |
| Qatar | Middle East | 17 | 0.77 | 1955.32 | 2.43 |
| Iraq | Middle East | 105 | 2.16 | 218.36 | 2.34 |
| Norway | Europe | 307 | 1.01 | 1114.53 | 1.95 |
Table 14. Production characteristics of the top ten oil fields |
| Oil field | Region | Country | Operating companies | Year of first production | Production in 2021/ 104 t | Remaining technically recoverable reserves | ||
|---|---|---|---|---|---|---|---|---|
| Crude oil/108 t | Natural gas/108 m3 | Oil and gas equivalent/108 t | ||||||
| Ghawar | Middle East | Saudi Arabia | Saudi Aramco | 1951 | 18 426.30 | 54.33 | 2788 | 56.69 |
| ADNOC Onshore Area | Middle East | UAE | Abu Dhabi Onshore Oil Company | 1963 | 7738.00 | 33.02 | 127 | 33.12 |
| Yuganskneftegaz | Central Asia-Russia | Russia | Yukos Oil Company | 1977 | 6953.98 | 25.79 | 1398 | 26.97 |
| Rumaila | Middle East | Iraq | Basra Energy Corporation | 1954 | 6834.63 | 18.17 | 0 | 18.17 |
| Greater Burgan | Middle East | Kuwait | Kuwait Oil Company | 1946 | 6613.07 | 40.92 | 2317 | 42.88 |
| Khurais Area | Middle East | Saudi Arabia | Saudi Aramco | 1963 | 6394.07 | 26.64 | 777 | 27.30 |
| Shaybah | Middle East | Saudi Arabia | Saudi Aramco | 1998 | 5596.55 | 25.12 | 5656 | 29.89 |
| Tupi | Americas | Brazil | Petrobras | 2009 | 4652.66 | 4.31 | 581 | 4.80 |
| Northern Fields | Middle East | Kuwait | Kuwait Oil Company | 1960 | 4057.71 | 23.13 | 5361 | 27.65 |
| Upper Zakum | Middle East | UAE | Abu Dhabi Onshore Oil Company | 1982 | 3590.87 | 14.63 | 0 | 14.63 |
Table 15. Production characteristics of the top ten gas fields |
| Gas field | Region | Country | Year of first production | Production in 2021/108 m3 | Remaining technically recoverable reserves | ||
|---|---|---|---|---|---|---|---|
| Crude oil/104 t | Natural gas/1012 m3 | Oil and gas equivalent/108 t | |||||
| South Pars Gas Field | Middle East | Iran | 2002 | 1981.83 | 179 013 | 8.00 | 85.42 |
| Northern Gas Field | Middle East | Qatar | 1996 | 1724.13 | 127 388 | 8.50 | 84.52 |
| Bovanenkovskoye | Central Asia-Russia | Russia | 2012 | 1114.09 | 4316 | 2.15 | 18.56 |
| Zapolyarnoye | Central Asia-Russia | Russia | 2001 | 970.47 | 4325 | 1.11 | 9.81 |
| Yamburgskoye | Central Asia-Russia | Russia | 1983 | 637.14 | 6312 | 1.81 | 15.93 |
| Hassi R'Mel | Africa | Algeria | 1961 | 500.84 | 5675 | 0.77 | 7.08 |
| Troll gas field | Europe | Norway | 1995 | 371.62 | 5219 | 0.68 | 6.26 |
| Ghawar gas field | Middle East | Saudi Arabia | 1951 | 346.65 | 18 965 | 1.40 | 13.69 |
| South Tambeiskoye | Central Asia-Russia | Russia | 2017 | 291.20 | 3711 | 0.91 | 8.01 |
| ADNOC Gas Project | Middle East | UAE | 1981 | 284.32 | 112 084 | 1.39 | 22.93 |
In terms of changes in different types of oil and gas production, onshore conventional oil and gas production in 2021 will be 36.26×10⁸ t oil and gas equivalent, accounting for 46.54% of global oil and gas production, an increase of 1.26×10⁸ t oil and gas equivalent by 3.6% compared with 2020 (Table 16 ). Central Asia-Russia is the main area of increase with 0.77×10⁸ t of additional hydrocarbon equivalent, followed by Africa with 0.5×10⁸ t of additional hydrocarbon equivalent (Fig. 4 a). Onshore conventional oil and gas production has generally remained stable over the past decade, and after a brief decline in 2020 due to the COVID-19 pandemic, onshore conventional oil and gas production began to grow in 2021, with the Middle East and Central Asia-Russia regions dominating onshore conventional oil and gas production, maintaining a global share of 60%-75% (Fig. 4 b). In 2021, unconventional oil and gas production of 19.50×10⁸ t hydrocarbon equivalent, accounting for 25.02% of global oil and gas production, compared with 2020, an increase of 0.57×10⁸ t hydrocarbon equivalent by 3.01% (Table 16 ). America was the main area of increase, and shale oil was the main type of increase, adding 0.43× 10⁸ t (Fig. 5 ). In 2021, marine oil and gas production is 22.17×10⁸ t oil and gas equivalent, accounting for 28.45% of global oil and gas production (Table 16 ), of which shallow water oil and gas production is in the first place, 17.23×10⁸ t oil and gas equivalent. Compared with 2020, marine oil and gas increased by 0.49×10⁸ t oil and gas equivalent, an increase of 2.26%, shallow water oil and gas being the main increase type, with an increase of oil and gas equivalent of 0.28×10⁸ t (Fig. 6 ).
Table 16. Characteristics of year-on-year changes in oil and gas production by type |
| Type | Production in 2020 | Production in 2021 | Amount of change | Rate of change/% | ||||||||
|---|---|---|---|---|---|---|---|---|---|---|---|---|
| Crude oil/ 108 t | Natural gas/ 108 m3 | Oil and gas/ 108 t | Crude oil/ 108 t | Natural gas/ 108 m3 | Oil and gas/ 108 t | Crude oil/ 108 t | Natural gas/ 108 m3 | Oil and gas/ 108 t | Crude oil | Natural gas | Oil and gas equivalent | |
| Onshore conventional oil and gas | 21.12 | 16 438.27 | 35.00 | 21.74 | 17 178.45 | 36.26 | 0.62 | 740.18 | 1.26 | 2.94 | 4.50 | 3.60 |
| Offshore oil and gas | 11.80 | 11 701.61 | 21.68 | 11.96 | 12 088.18 | 22.17 | 0.16 | 386.57 | 0.49 | 1.36 | 3.30 | 2.26 |
| Unconventional oil and gas | 10.19 | 10 342.26 | 18.92 | 10.37 | 10 817.48 | 19.49 | 0.18 | 475.22 | 0.57 | 1.77 | 4.59 | 3.01 |
| Total | 43.11 | 38 482.14 | 75.60 | 44.07 | 40 084.11 | 77.92 | 0.96 | 1601.97 | 2.32 | 2.23 | 4.16 | 3.07 |
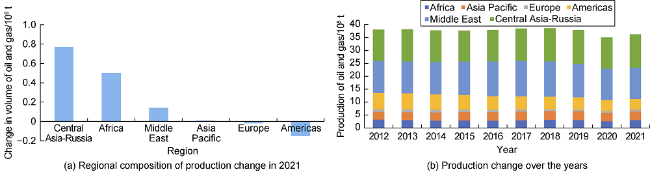
Fig. 4. Onshore conventional oil and gas production region composition and the change in oil and gas production over the years. |
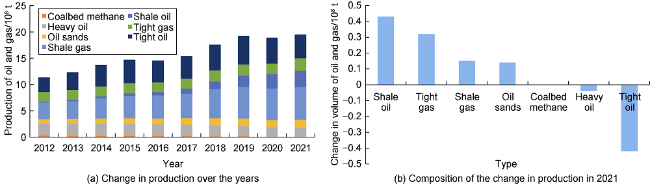
Fig. 5. Composition of unconventional oil and gas production change over the years and production change in 2021. |
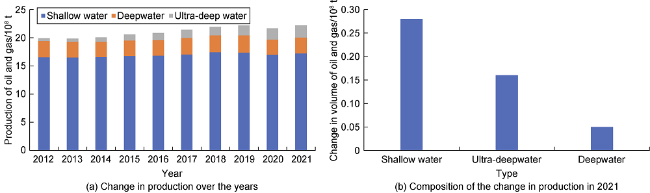
Fig. 6. Offshore oil and gas production changes over the years and 2021 production change composition. |
In terms of changes of oil and gas production in different regions, the Central Asia-Russia region saw the largest increase amount in oil and gas production, with an increase of 0.82×10⁸ t oil and gas equivalent by 6.09%; the Africa region saw the largest increase percentage in oil and gas production, with an increase of 0.52×10⁸ t oil and gas equivalent by 9.76%; the Americas, the Middle East, and the Asia-Pacific region saw increases of 0.43× 10⁸, 0.51×10⁸, and 0.15×10⁸ t oil and gas equivalent, an increase of 1.73%, 2.58%, and 1.76%, respectively; the oil and gas production in Europe decreased by 0.11×10⁸ t oil and gas equivalent, a decrease of 3.03% (Table 17 ).
Table 17. Characteristics of year-on-year changes in oil and gas production in different regions |
| Region | Production in 2020 | Production in 2021 | Amount of change | Rate of change/% | ||||||||
|---|---|---|---|---|---|---|---|---|---|---|---|---|
| Crude oil/ 108 t | Natural gas/ 108 m3 | Oil and gas/ 108 t | Crude oil/ 108 t | Natural gas/ 108 m3 | Oil and gas/ 108 t | Crude oil/ 108 t | Natural gas/ 108 m3 | Oil and gas equivalent/ 108 t | Crude oil | Natural gas | Oil and gas equivalent | |
| Americas | 14.47 | 12 371.96 | 24.90 | 14.73 | 12 558.98 | 25.33 | 0.26 | 187.02 | 0.43 | 1.80 | 1.51 | 1.73 |
| Middle East | 13.73 | 7157.18 | 19.78 | 14.01 | 7429.78 | 20.29 | 0.28 | 272.6 | 0.51 | 2.04 | 3.81 | 2.58 |
| Central Asia-Russia | 6.49 | 8258.96 | 13.46 | 6.65 | 9032.47 | 14.28 | 0.16 | 773.51 | 0.82 | 2.47 | 9.37 | 6.09 |
| Asia Pacific | 3.37 | 6069.53 | 8.50 | 3.34 | 6284.54 | 8.65 | -0.03 | 215.01 | 0.15 | -0.89 | 3.54 | 1.76 |
| Africa | 3.32 | 2377.32 | 5.33 | 3.65 | 2611.24 | 5.85 | 0.33 | 233.92 | 0.52 | 9.94 | 9.84 | 9.76 |
| Europe | 1.73 | 2247.18 | 3.63 | 1.69 | 2167.10 | 3.52 | -0.04 | -80.08 | -0.11 | -2.31 | -3.56 | -3.03 |
| Total | 43.11 | 38 482.14 | 75.60 | 44.07 | 40 084.11 | 77.92 | 0.96 | 1 601.97 | 2.32 | 2.23 | 4.16 | 3.07 |
1.4. Abundant reserves of unbuilt/to-be-built production and future development potential should not be underestimated
At present, 111 of the world's discovered large oil fields (recoverable reserves greater than 7000×104 t) have not been built for production, with recoverable reserves of more than 456.20×10⁸ t. The unbuilt large oil fields in the Americas and the Middle East have combined recoverable reserves of 439.83×10⁸ t, accounting for 96% of the world, occupying a dominant position (Fig. 7 a); the world's discovered natural gas fields (recoverable reserves greater than 1000×108 m3), there are 97 unproduced fields with recoverable reserves of 43.67×10¹² m3, and the unproduced fields in the Middle East and Central Asia-Russia have recoverable reserves of 32.12×10¹² m3, accounting for 74% of the world, with an obvious dominant position (Fig. 8 a).
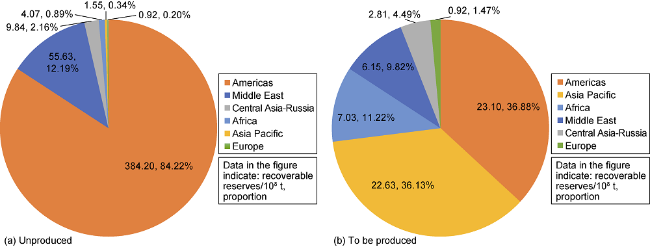
Fig. 7. Percentage of recoverable reserves in unproduced and to-be-produced oil fields. |
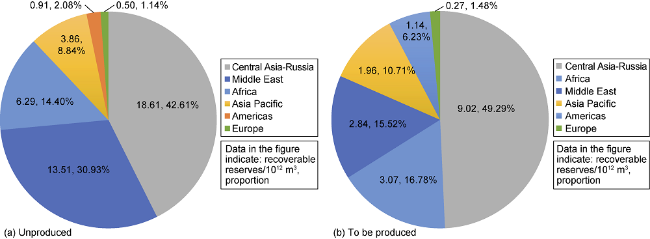
Fig. 8. Percentage of recoverable reserves in unproduced and to-be-produced gas fields. |
There are 31 large oil fields to be built for production worldwide, with recoverable reserves of 62.63×10⁸ t, mainly in the Americas, the Asia Pacific, and Africa, and the recoverable reserves of large oil fields to be built for production in the three regions are 52.76×10⁸ t, accounting for 84.23% of the world production (Fig. 7 b). There are 36 gas fields to be built for production, with recoverable reserves exceeding 18.29×10¹² m3, mainly concentrated in Central Asia-Russia, Africa, and the Middle East, with 14.93×10¹² m3 of recoverable reserves in the three regions to be built for production, accounting for 82% of the world production (Fig. 8 b).
2. Global oil and gas development situation and development trend
The carbon emission reduction has become the keyword for global oil and gas development in 2021, countries have legislated for a carbon tax, resource-host countries are more cautious in policy adjustment, and with the slow recovery of the world economy, global oil and gas demand is gradually recovering. However, the supply capacity and willingness to increase production cannot keep up with market demand. Therefore, international oil prices continue to rise, while decarbonized energy transition and extreme weather have pushed gas prices to historical highs. However, the OPEC+ (OPEC and partner countries) limit production to protect prices and agreement to cut production is gradually relaxing, driving an increase in oil production. Overall, the global oil and gas development situation in 2021 is summarized in eight aspects.
2.1. Macroenvironment is becoming more unstable, and crisis and opportunity are dialectical development
In the context of globalization, China, as a major oil and gas importer, is becoming more and more dependent on global oil and gas resources. The global geopolitical situation has profoundly affected the oil and gas market, and geopolitical uncertainty has become the biggest variable in the oil and gas market. The unpredictability of global black swan events becomes apparent, with sudden regime changes occurring frequently in Africa, sudden riots erupting in Kazakhstan, and the Russia-Ukraine conflict profoundly affecting the world. The intensification of the game between the U.S., the EU and Russia may boost progress in the nuclear talks of Iran, and the U.S. sanctions against Venezuela are expected to be loosened. 2021 saw the first signs of a return to global terrorism, with an increase in global terrorist attacks and several key resource-host countries on the Global Terrorism Index list[13] (Table 18 ).
Table 18. Top ten countries in the global terrorism index, 2021 |
| Country | Terrorism index | Number of attacks | Number of casualties |
|---|---|---|---|
| Afghanistan | 9.109 | 837 | 3 635 |
| Iraq | 8.511 | 833 | 1 360 |
| Somalia | 8.398 | 308 | 1 077 |
| Burkina Faso | 8.270 | 216 | 963 |
| Syria | 8.250 | 338 | 990 |
| Nigeria | 8.233 | 204 | 609 |
| Mali | 8.152 | 333 | 1 125 |
| Niger | 7.856 | 74 | 707 |
| Myanmar | 7.830 | 750 | 872 |
| Pakistan | 7.852 | 186 | 744 |
Note: Data from the IEP Global Terrorism Index. |
2.2. More cautious adjustment of fiscal and tax policies, carbon emission reduction becomes the main motivation
The biggest theme for the oil and gas industry in 2021 is carbon reduction, with government carbon charges for upstream operations in the form of both a carbon tax and an emissions trading scheme (ETS) [14⇓-16]. The Norwegian government has adopted a climate plan for 2021–2030, with the carbon tax rising from the current NOK 590/t to NOK 2000/t (about US $232/t) in 2030 [17]. The Canadian government passed legislation to raise the federal carbon price, announcing an increase from the current C$50/t to C $170/t (about US$136/t) by 2035 [17]. The EU announced the first carbon border adjustment mechanism scheme [17], and the hidden danger of carbon tax outflow prompted many countries to accelerate the construction of their carbon price system, increasing the possibility of carbon pricing in other countries.
Policy adjustments in resource-host countries are influenced by both positive and negative pull forces. The recovery of oil prices, rebalancing of supply and demand, slow recovery of the industry, and new exploration discoveries in some hotspots will continue to put resource-host countries under financial pressure. Additionally, the energy transition will impose a long-term impact on the development of the industry, with oil companies accelerating their strategic transformation and taking a more cautious approach to upstream investments [18]. Overall, resource- host countries are more cautious on fiscal and tax adjustments, and the rebound in oil prices failed to pull up the frequency of adjustments, with 21 adjustments in 2021, down 13% year-on-year. The direction of adjustment shifted from positive to negative, with 11 negative adjustments, accounting for 52%; low-carbon environmental protection became the main motivation for adjustment, accounting for 43% (Fig. 9 ), including E&P bans, air combustion, emissions, disposal regulation, carbon tax, etc.; carbon prices showed a domino effect, constantly passing from developed to developing countries, for example, Norway, Canada, the EU proposed new initiatives, and Indonesia is considering new measures[19,22,23].
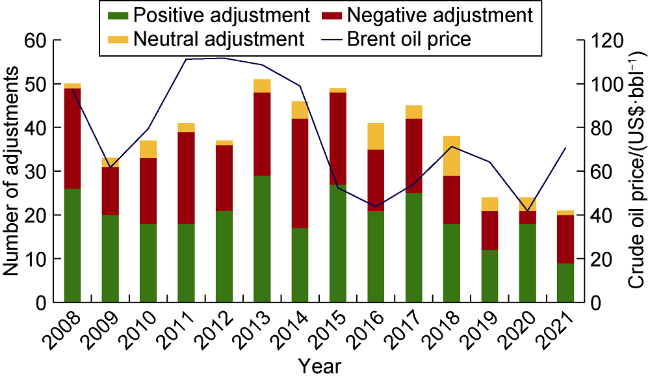
Fig. 9. Annual statistics on the number of global oil and gas fiscal and legal adjustments (1 bbl=0.159 m3). |
2.3. OPEC+ insists on production limits to protect prices, willingness to increase production greatly reduced
Since OPEC+ reached its largest-scale production cut agreement in April 2020, OPEC members have generally had a high implementation rate of production cuts. The average implementation rate of production cuts in 2021 is 120% for OPEC countries, mainly Saudi Arabia, and 91% for Russia, a non-OPEC oil-production country. Limiting production to protect prices for higher returns is still the preferred option for OPEC+, which has led to little willingness from oil producers to increase production. As the COVID-19 pandemic situation gradually abates, the demand of the global oil market continues to recover, and OPEC member countries maintain a monthly upward quota increase of 40×104 bbl/d since August 2021. However, the remaining OPEC production capacity has dropped by half compared with the beginning of 2021 (Fig. 10 ), the oil resource-host countries have insufficient capacity to increase production, such as Angola and Nigeria due to insufficient investment to increase production, Russia There is large uncertainty in the potential for production increase due to the Russian-Ukrainian war sanctions, etc. [24,25]
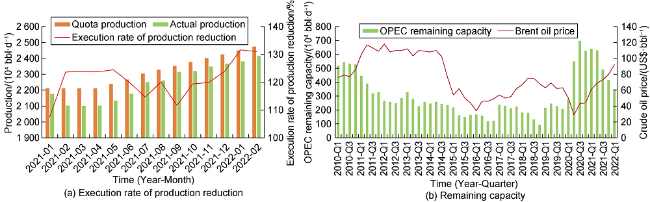
Fig. 10. OPEC production cut implementation rate and change in remaining capacity. |
2.4. Supply shortage and monetary easing push up oil prices to continue recovery
The average price of Brent crude oil for the whole year of 2021 is US $71/bbl, an increase of 69% year-on-year, and the crude oil price at the beginning of 2021 is below US$50/bbl, while in the second half of 2021, the crude oil price is always above US$70/bbl (Fig. 11 ). The reasons for the high international oil price oscillation are mainly the following three points: (1) The low investment inhibits the supply growth, the global new drilling in 2021 number of 47 500, equivalent to recovery up to 77% of the pre-pandemic levels (2019). (2) The overall slowdown of the global pandemic, the gradual increase in the rate of vaccination against COVID-19, the acceleration of global economic recovery, continued recovery in demand, global oil demand growth of 5.60×10⁶ bbl/d year-on-year (Fig. 12 ). (3) Monetary easing to stimulate oil prices, in response to the impact of the pandemic on economic growth, major central banks of economies and countries have implemented extremely loose monetary policies, global liquidity surplus, and released copious amounts into the financial asset markets, including commodities, stimulating the rise of crude oil and other commodity prices[26⇓-28].
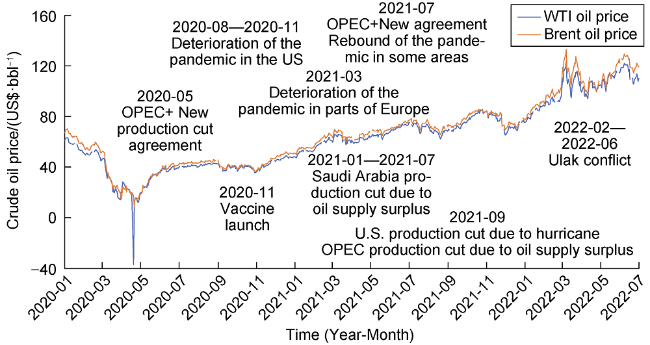
Fig. 11. International crude oil price trend (WTI—U.S. West Texas Light Crude Oil). |
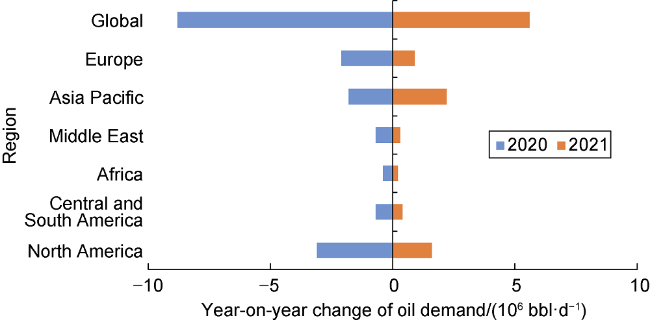
Fig. 12. Year-on-year change in global oil demand in 2020-2021. |
2.5. Natural gas supply and demand continue to be tight, with prices rising to record highs
Tight gas supply and demand pushed gas prices high in 2021, with LNG prices continuing to rise, with NBP gas prices in the UK up 384% year-over-year, TTF gas prices in the Netherlands up 396% year-over-year, and Henry Hub gas prices in the US up 93% year-over-year. Imports from major natural gas-consuming countries continued to grow year-over-year due to the “double carbon target” and global economic stimulus, cumulative annual gas demand increasing by 1390×108 m3 year-on-year and China's LNG spot import price increasing by 282% year-on-year (Fig. 13 )[29,30].
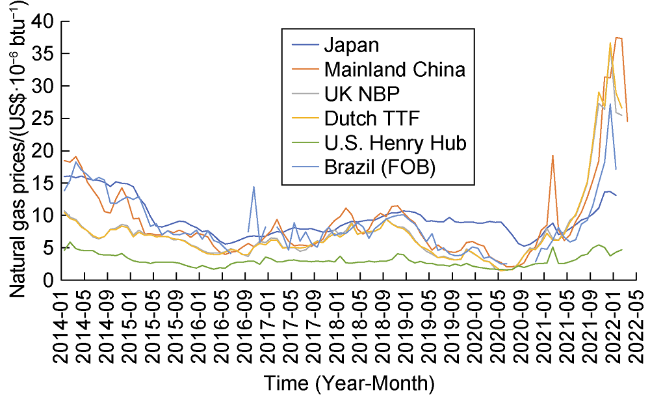
Fig. 13. Natural gas and LNG prices by calendar year (1 btu=1.055 kJ; NBP—National Balancing Point (gas price of BG Group); TTF—gas price of the Title Transfer Facility (Dutch gas trading hub); FOB—FOB gas price in Brazil). |
Underinvestment and unplanned shutdowns have led to a supply crunch, with upstream oil and gas investment recovering to only 85% of pre-pandemic (2019) levels; global unplanned shutdowns amounted to 530×108 m3, equivalent to 9% of global designed capacity. Economic recovery and extreme weather contributed to high demand. In 2021, the demand for natural gas is 40 622× 108 m3, with a year-on-year increase of 1393×108 m3, and Asia's demand rose solidly, up 6.5% year-on-year; Europe's demand grew significantly in the first half of the year, with a year-on- year growth rate of 4.0%; North America's demand was generally flat with the previous year, down slightly by 0.4% year-on-year (Fig. 14 )[27].
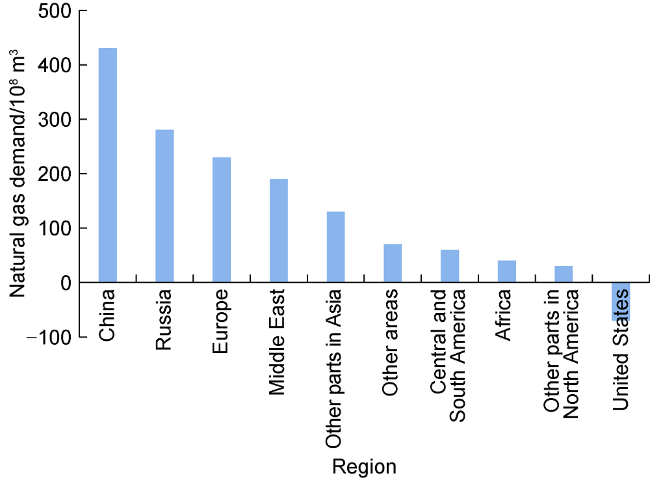
Fig. 14. Changes in global natural gas demand in 2021 relative to 2020. |
2.6. Development expenditures only slightly rebounded, and the scale is still at a low level
In 2021, with the gradual recovery of oil prices, upstream development investment showed recovery, with development capital expenditure of US $3182×108, up 9% year-on-year, still not recovering to the pre-pandemic level. Global oil and gas development capital expenditures fell sharply in 2014 and 2020, hit by twice oil prices crash, with a 47% decline in 2021 from the 2014 high (Fig. 15 ). Global unit development costs have generally trended downward since 2015, with an average year-over-year decrease of 11% from 2015–2021 to US$5/bbl in 2021[12,31].
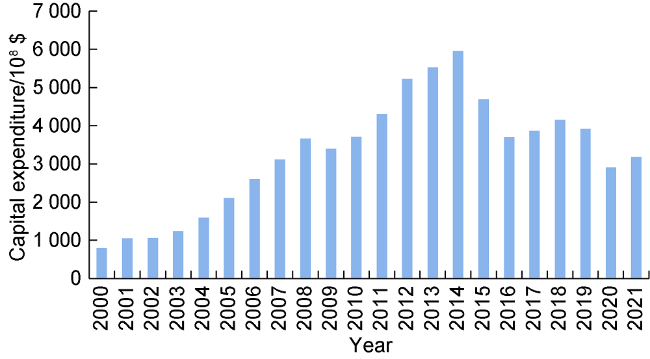
Fig. 15. Global oil and gas development capital expenditures by calendar year. |
2.7. Small changes in reserve and production anisotropy as oil prices drive production increases
Global oil and gas reserves decline by 66.21×10⁸ t or 1.5% in 2021, with unconventional gas reserves declining by 10.1×10¹² m3, the main type of oil and gas reserves decline in 2021 (Fig. 16 ). U.S. unconventional natural gas reserves declined by 10.04×10¹² m3 and shale gas reserves declined by 8.33×10¹² m3, of which the shale gas reserves in the APPKY block in the Appalachian Basin and the ALTAR block in the Aklatex Basin declined by 4.27×10¹² m3 and 3.81×10¹² m3, respectively; tight oil reserves declined by 47.79×10⁸ t, of which the GFCLA block in the Gulf of Mexico Basin declined by 19.56×10⁸ t, taking first place. The reasons for the decline are mainly: (1) The U.S. natural gas pipeline project has suffered setbacks, and natural gas transportation capacity has declined, limiting the pace of upstream reserve and production growth. (2) With rising oil prices, the giant companies have shifted capital allocation from growth to maintenance spending, reducing investment in exploration and development, and the number of rigs and new wells in North America remains low.
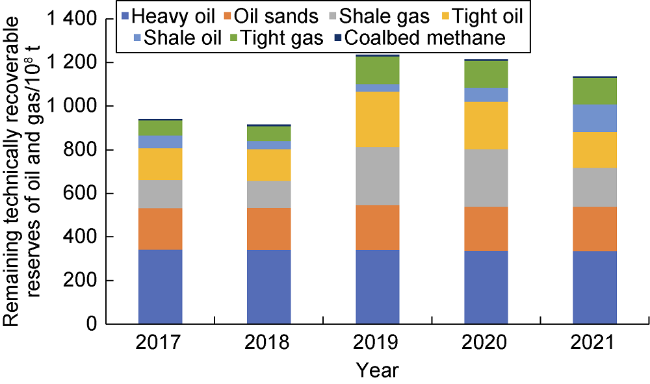
Fig. 16. Remaining recoverable reserves from unconventional oil and gas technologies in 2017-2021. |
In 2021, global oil and gas production increased by 2.32×10⁸ t oil and gas equivalent, or 3.07%, including 0.96×10⁸ t crude oil and 1601.97×108 m3 natural gas; unconventional oil and gas production increased by 0.57×10⁸ t, including 0.43×10⁸ t shale oil and 0.32×10⁸ t tight gas (Fig. 17 ).
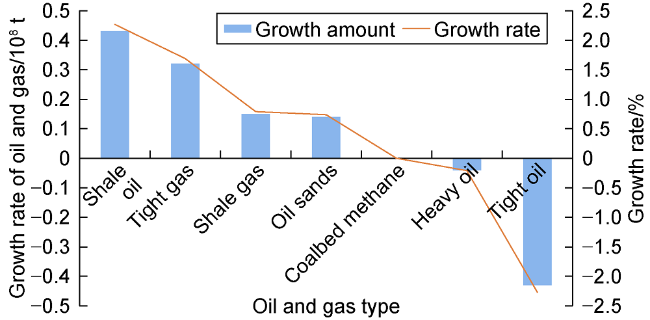
Fig. 17. Year-on-year change in unconventional oil and gas production in 2020-2021. |
2.8. Oil and gas reserve-production ratio remains high, extraction rate runs low
In 2021, the remaining technically recoverable reserves and reserve-production ratio of oil and gas decreased slightly year-over-year, but the reserve-production ratio has been maintained above 55, with crude oil reserve-production ratio of 55.2 and natural gas reserve-production ratio of 59.0. In 2021, remaining technically recoverable reserves of oil and gas showed a recovery rate of 1.79%, up 0.08 percentage points year-on-year, this included the recovery rate of oil remaining recoverable reserves at 1.84% and gas remaining recoverable reserves at 1.72%. Recoverable reserves recovery rate was at 1.08%, increasing 0.03 percentage points year- on-year, this included the recovery rate of oil recoverable reserves at 1.03% and gas recoverable reserves at 1.16% (Fig. 18 ).
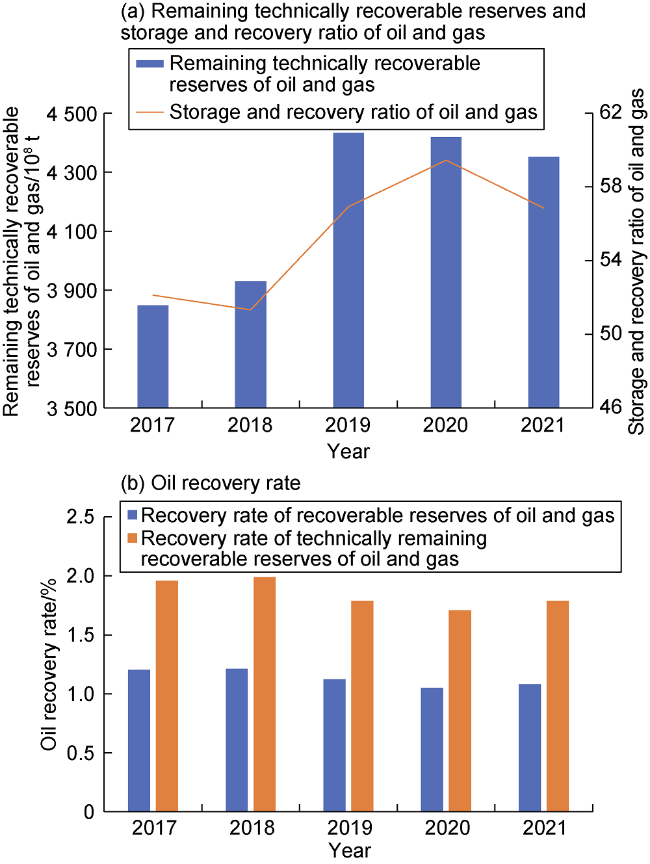
Fig. 18. Change in remaining recoverable oil and gas reserves, reserve-to-recovery ratio, and oil recovery rate in 2017-2021. |
3. Awareness and insights
The potential for global oil and gas resources development is huge, and the position of oil and gas in the energy structure is still difficult to be replaced rapidly in the short term, the prospect of Chinese oil companies “going out, going in, going up” is still broad. We will study the complex and volatile macro-political and economic situation in advance, make objective evaluations by applying the dialectical relationship between crisis and opportunity, so as to avoid the potential risks of project operations effectively by not going to critical areas and chaotic areas; adhere to the main position and technical advantages of onshore conventional oil and gas development, attach great importance to offshore abandonment obligations, and move steadily from shallow water to deep water and ultra-deepwater; comply with the trend of low-carbon energy transformation and realize the transformation of natural gas assets from integrated collaboration to full oil and gas industry chain development; the study of the holding strategies and decision- making basis of international oil companies in the process of asset structure optimization, learning from experience and lessons to ensure optimal asset investment and sale decisions, building and consolidating its own core production areas and stable supply assurance bases.
3.1. Paying attention to marine abandonment obligations to ensure that marine oil and gas achieves high-quality long-term benefits of development
Onshore conventional and shallow water oil and gas are the main contributors to global oil and gas production. At the end of the last century, onshore conventional and shallow water crude oil accounted for 93.8% of global crude oil production; onshore conventional and shallow water natural gas accounted for 96.0% of global natural gas production, maintaining stable oil production and ever-increasing gas production for a long time. After 2000, as the U.S. shale oil revolution achieved energy independence, the development field became diversified worldwide, and technologies and equipment such as ultra-long horizontal section horizontal wells, large-scale volumetric fracturing, factory operation, and marine engineering were widely used, and shale oil and gas, tight oil and gas, deepwater and ultra-deepwater oil and gas were developed rapidly. Over the past 20 years, the compound growth rates of tight oil, ultra-deepwater crude oil, and shale oil were 27.52%, 23.90%, and 22.88%, respectively; and the compound growth rates of shale gas, ultra-deepwater conventional natural gas, and tight gas were 27.50%, 14.62%, and 11.99%, respectively. By 2021, the proportion of global crude oil production is 50.48% for onshore conventional crude oil, 29.22% for offshore crude oil, and 20.30% for unconventional crude oil; and the proportion of global natural gas production is 43.05% for onshore conventional gas, 30.16% for offshore conventional natural gas and 26.79% for unconventional gas.
It is predicted that onshore conventional and shallow water oil and gas will continue to be the main contributor to global oil and gas production from 2022-2050. The share of onshore conventional and shallow water crude oil in global crude oil production decreases briefly from 71.29% in 2022 to 66.20% in 2031 before continuing to increase slowly to reach 75.95% in 2050. The share of onshore conventional and shallow water gas in global gas production slowly decreases from 72.66% in 2022 to 68.39% in 2036 and then continues to slowly increase, reaching 75.12% in 2050. The share of global oil and gas production of ultra-deepwater oil and gas both increase and then decrease, with the share of ultra-deepwater crude oil in global crude oil production peaking at 7.87% in 2031 and then slowly decreasing to 0.80% in 2050, and the share of ultra-deepwater natural gas in global natural gas production peaking at 5.01% in 2043 and then slowly decreasing to 3.78% in 2050 (Figs. 19 and 20 ).
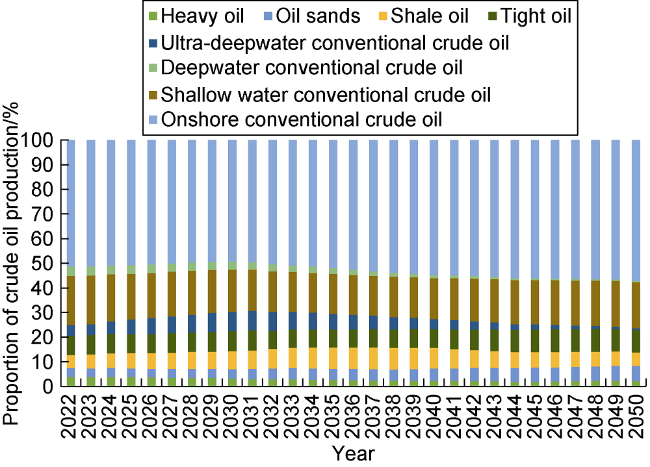
Fig. 19. Forecast of global production share of different types of crude oil. |
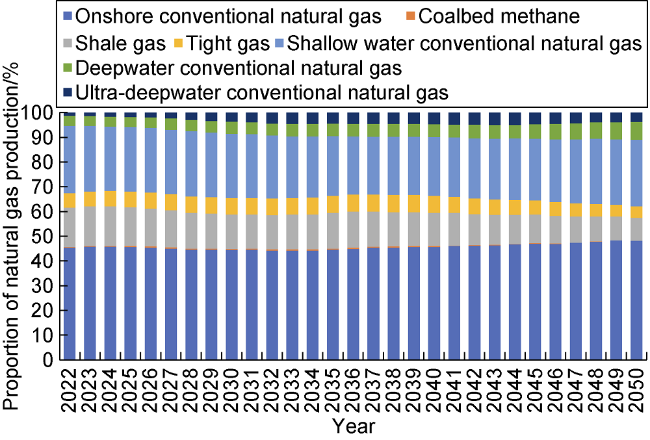
Fig. 20. Forecast of the share of global production of different types of natural gas. |
Offshore oil and gas disposal costs are expected to show rapid growth [20]. The early production of oil and gas fields in the sea has entered the end of development, after 2025, the abandonment cost of oil and gas fields in the sea of key resource-host countries will enter a phase of rapid growth, from 65 ×108 US dollars in 2022 to 173 × 108 US dollars in 2035. Oil companies should pay high attention to marine abandonment obligations. Oil companies have high asset-abandonment costs and risks, and should fully consider abandonment obligations and abandonment costs in the process of new project evaluation, project feasibility study, operation and management, and joint venture cooperation [13] (Fig. 21 ).
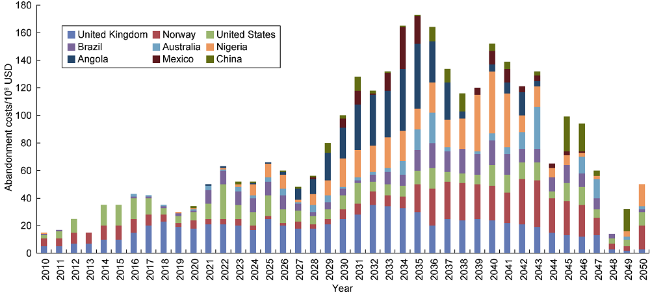
Fig. 21. Projected abandonment costs forecast of oil and gas fields in the waters of key resource countries. |
3.2. Insisting on not going to dangerous and chaotic places, and strengthening the concentration of oil and gas assets to establish a stable supply assurance base
Drawing on the risk evaluation research results of IHS Markit and Fitch Ratings, the Chinese Academy of Social Sciences, the World Bank, International SOS, and Risk Management Consulting, we will fully consider the risk factors in global geopolitics, society and economic security, oil and gas tax regulations, oil and gas contract terms, E&P technology adaptability, energy transition, low-carbon emissions, emissions reduction, etc. We will look at the relationship between “risks” and “opportunities,” study the business strategies of international oil companies in risky areas, implement the benefit-bundling mechanism, and jointly cope with the uncertainty of overseas oil and gas cooperation. Through multi-dimensional risk quantification characterization, country-specific security risk rating, and screening, a guiding and operable security early warning mechanism is established, and a list of preferred countries for overseas oil and gas cooperative investment is preferentially selected. We will strive to realize a dynamic regional layout of thinking of danger, seek opportunities in danger and turn danger into opportunities, thereby avoiding high risks of oil and gas investment to the greatest extent.
The oil and gas assets of international oil companies are relatively concentrated, and the development of the oil and gas business continues to show “nuclearization” characteristics. International oil companies continue to optimize their assets and are net sellers in asset transactions, seeking more cash flow and higher investment returns, focusing on their core assets, and divesting assets less relevant to the company's most growth-advantaged businesses and those with high carbon emissions, insufficient short-term cash contribution capacity, and low investment returns. The global seven major international oil companies (bp, Chevron, Eni, Statoil, ExxonMobil, Shell, Total) in the top five oil and gas resource countries in the oil and gas equity production share are close to or more than 45%, and the core resource-host countries production share shows a growing trend (Fig. 22 ). All international oil companies have 2 to 6 core production areas, and the net oil and gas production of core production areas are all over or close to 1000×104 t, and there is a trend of further aggregation, and the trend of nucleation is becoming more and more obvious.
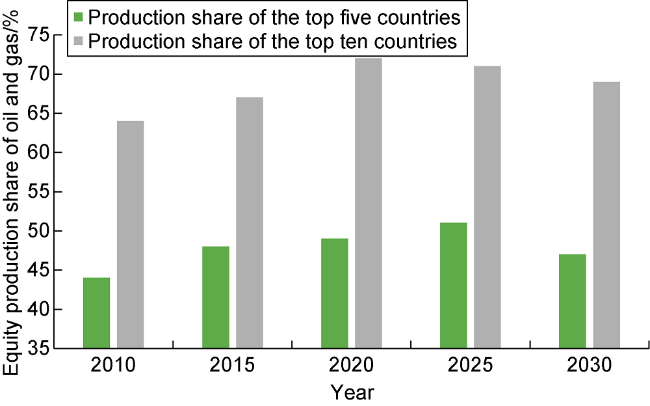
Fig. 22. Country production concentration share of major international oil companies. |
3.3. Transformation of integrated synergy to full business chain development based on the demand of multiple scenarios of natural gas
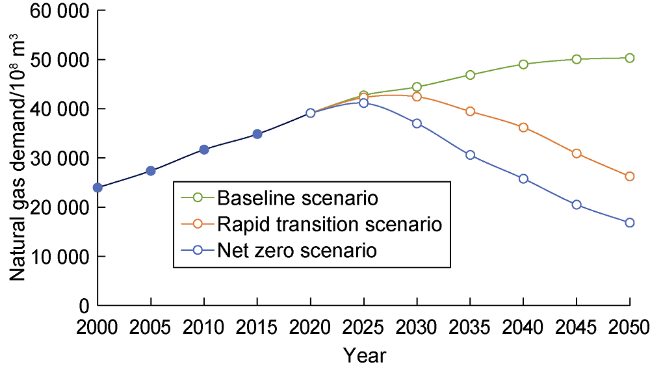
The future development trend of natural gas will be more resilient than that of coal and oil and is expected to play an important role in the energy transition, with natural gas demand set to grow significantly in the next 10-15 years. In the baseline scenario, natural gas demand will continue to grow until 2050. Natural gas will grow at an average annual rate of 1.30% through 2035 and 0.87% through 2050. Under the rapid transition scenario, natural gas demand is expected to reach a peak period in 2025-2030, with an average annual growth rate of 0.90% (Fig. 23 ). The future LNG market supply and demand balance depends on whether the new planned projects can be successfully put into operation, and the global final investment decision (FID) scale of LNG in 2021 is nearly 3100×104 t/a. Affected by the pandemic and investment and other factors, the FID scale is about 500× 104 t smaller than previously expected. Stimulated by the double carbon policy and the high price of LNG in 2021, it is expected that the 2022-2023 new FID scale will increase by 1100×104 t and 2000×104 t, respectively, compared to the 2020 forecast [20,32].
Fig. 23. Global gas demand forecast under different scenarios. |
Based on the multi-scenario demand for natural gas, the natural gas business will realize the transformation from upstream and downstream integration to the development of the entire industry chain of exploration, development, production, processing, pipeline/liquefaction, transportation, sales, and commerce. It seeks to achieve the goal of maximizing the overall benefits of the whole business chain to achieve a win-win situation of low-carbon energy transformation, social livelihood supply assurance, and oil company profitability [21].
3.4. Increasing the acquisition of high-quality scale assets and focusing on the continuous optimization of the shareholding ratio of projects at different stages
Both NOCs and IOCs dominate the exploration blocks, with NOCs' shareholding 20 percentage points higher than that of IOCs. From the exploration and construction to the production of oil and gas fields, the shareholding ratio of national oil companies continues to decrease slightly, while the shareholding ratio of international oil companies decreases significantly and then increases slightly, continuously optimizing the shareholding ratio of oil and gas assets.
Both NOCs and IOCs have a stronger incentive to develop and build production in their home countries while being more cautious in their business strategies for overseas oil and gas assets. NOCs hold high share ratios at different stages of their indigenous projects, with a spread between overseas and indigenous assets of greater than 20 percentage points; international oil companies hold high share ratios in their territories and 10 to 17 percentage points lower in their overseas projects.
4. Conclusions
This study analyzed the number of oil and gas fields and the reasons why some oil and gas fields are not in production, the characteristics and year-on-year changes in the distribution of remaining recoverable reserves, the characteristics and year-on-year changes in the distribution of oil and gas production, and the development potential of unbuilt and to-be-built oil and gas production. Additionally, it examined the macro-political and economic environment, the adjustment of oil and gas taxation policies, the latest policy developments of international organizations, the relationship between oil and gas supply and demand and price trends, upstream investment and development costs, and the future development potential and development direction. Based on the analysis results, four points of understanding and insight are propounded to help Chinese oil companies to grasp the global oil and gas development situation and development trend, conduct benchmarking analysis, identify gaps, and adjust the company's business strategy promptly. Moreover, the study hopes to provide a forward-looking and strategic reference for the national energy strategy, energy development planning, and oil and gas industry policies. On the whole, Chinese oil companies and private enterprises going abroad to conduct energy cooperation should scientifically learn from and digest the typical practices and management concepts of international oil companies and national oil companies in key resource-host countries, make full use of their multiple advantages, and adhere to the internationalization strategy. In the broad arena of global oil and gas development and usage, we should fulfill our responsibilities and obligations in low-carbon energy transition and climate governance, ensuring national energy security and maximizing the overall efficiency of oil companies.