

Introduction
In 2020, energy-related CO2 emissions accounted for about 87% of global carbon emissions, and fossil fuel combustion was the main source of global CO2 emissions [1]. It has become a global consensus to address climate warming caused by CO2 emissions and to achieve carbon neutrality. The Chinese government has made a major strategic decision and pledged to adopt more powerful policies and measures to make CO2 emissions peak by 2030 and strive to achieve carbon neutrality by 2060. According to the International Energy Agency (IEA), in 2050, there will still be 76×108 t of carbon emissions in the world that need to be completely sequestered by carbon-negative technologies such as CO2 utilization and storage, of which China accounts for (5-15)×108 t [2-3].
CO2 capture, utilization and storage (CCUS for short) refers to the industrial process that the CO2 emissions are reduced while CO2 emitted from industrial sources is captured and further utilized after separation. As an excellent oil displacement medium, CO2 is a valuable resource for reservoir development and utilization. Combining CO2 flooding with CCUS can utilize CO2 as a resource to achieve a "win-win" of social and economic benefits, which has been generally accepted by international community. According to the report from Global Carbon Capture and Storage Institute (GCCSI), CO2 capture, utilization and storage (CCUS-EOR) is a main way to reduce carbon emissions; at present, there are 28 carbon emission reduction projects in the world with an annual capture capacity of 3816×104 t, of which 22 are CCUS-EOR projects with an annual capture capacity of 2926×104 t, accounting for 76.68% [4].
In this paper, the development history of CCUS-EOR in China is comprehensively reviewed, which includes three stages: research and exploration, field test, and industrial application. Then, the breakthrough understanding in the aspects of CO2 flooding mechanism and field practice and the corresponding technical achievements of CCUS-EOR projects in recent years are systematically described. Finally, the development prospects of CCUS-EOR technology are proposed, such as large-scale CO2 flooding and storage in the whole structure-controlled area, and conversion of CO2 and residual oil into methane by using microorganisms, so as to promote the formation of the CCUS-EOR technology system for continental sedimentary reservoirs.
1. Development history of CCUS-EOR technology
1.1. Research and exploration stage (1965-2004)
In China, the Daqing Oilfield began to explore CO2 flooding technology as early as 1965. After the 1970s, limited by CO2 gas source, some laboratory researches and experiments on minimum miscibility pressure measurement and miscible flooding mechanism were performed, and some field tests on CO2 huff-and-puff and CO2 flooding in a single unit were carried out in some oilfields such as Jilin Oilfield and Jiangsu Oilfield, which demonstrated the advantages of CO2 flooding. However, the CO2 flooding technology progressed slowly overall [5⇓⇓-8].
After 2000, the discovery of CO2-containing gas reservoirs in the Songliao Basin accelerated the CO2 flooding researches in Jilin and Daqing oilfields. Such researches were performed mainly by way of laboratory experiments, together with an attempt of small-scale field tests in flooding unit, but no large-scale pilot test had been conducted. According to the theoretical cognitions and evaluation available abroad at that time, most of the oil reservoirs in China could not be recovered by CO2 miscible flooding, suggesting a poor application effect and potential of this technology. Due to the corrosivity of CO2 dissolved in water and the phase transition of CO2 at different temperatures and pressures, the application of CO2 flooding raises high and complex requirements for oilfield corrosion protection, dynamic monitoring, and updating of the original development system. Unfortunately, the foreign companies monopolized the core technology and only provided relevant products and services. Therefore, before the Eleventh Five-Year Plan, there was no precedent for large-scale successful application of CO2 flooding in engineering practice in China [9⇓⇓-12].
1.2. Field test stage (2005-2020)
In 2005, China National Petroleum Corporation (CNPC) and other organizations including Chinese Academy of Sciences (CAS) jointly launched the Xiangshan Science Conference on "The Greenhouse Gas Emission Reduction Strategy and Development of China". At the conference, Professor Shen Pingping first proposed the concept and initiative of CO2 flooding and storage. Since 2006, CNPC has taken the lead in undertaking a number of projects in CO2 flooding and storage under the National Program on Key Basic Research Project (973 Program), the National High-tech R&D Program of China (863 Program), and the National Major Science and Technology Project. After systematically summarizing the successful test cases in foreign countries, the research team from PetroChina Research Institute of Exploration & Development and Jilin Oilfield proposed to develop the theory and technology of CO2 flooding and storage suitable for the continental reservoirs in China. In addition, CNPC set up major science and technology projects and major development testing projects, and conducted field tests of CO2 flooding and storage in Jilin, Daqing and other oilfields. Through these projects, some signature experimental devices for nuclear magnetic resonance detection, CT 3D scanning, high-temperature and high-pressure physical simulation, and microscopic visualization models were developed, and the mechanisms of CO2 EOR in effectively supplementing formation energy, improving oil displacement efficiency, and expanding swept volume were revealed. Furthermore, the fine reservoir description process and method suitable for CO2 flooding were established, the component numerical simulation technology for CO2 flooding was developed, and the bottlenecks in many key core technologies (e.g. CO2 anticorrosion and storage monitoring) were addressed. Based on these key technologies, China’s first national science and technology demonstration project of CO2 capture, flooding and storage was successfully built in Jilin Oilfield, breaking the technological monopoly of foreign companies. This represents a complete practice of the whole process of CO2 capture, transportation, injection, produced fluid collection and treatment, and cyclic reinjection.
The carbon source for the CCUS-EOR project in Jilin Oilfield is the gas from volcanic gas reservoir in Changling Gas Field, which contains CO2 up to 23%. The CO2 in the produced gas must be treated to meet the requirements for exported commercial gas and to reduce the greenhouse gas emissions. Daqingzijing Oilfield and Changling Gas Field are superimposed with large reserves, where crude oil can be miscible with CO2. The CO2 separated from the produced gas in Changling Gas Field is transported via pipeline to Daqingzijing Oilfield for CO2 flooding and storage. In this way, the associated CO2 is stored, and also the CO2 flooding can be considered to enhance the recovery of continental low-permeability reservoirs.
Field tests show that the injection capacity of CO2 is 2 to 6 times that of water. Injecting CO2 into formation can effectively supplement the reservoir energy to build and maintain a displacement pressure system. Through the oil displacement mechanisms such as viscosity reduction, swelling, and miscibility, CO2 flooding can realize the effective production of the hard-to-recover reserves and greatly improve the recovery rate in low-permeability reservoirs. It provides an effective way suitable for the profitable development of low-permeability oilfields and CO2 emission reduction in China. Efforts in this stage laid a solid foundation for the future industrialization of CCUS- EOR and demonstrated broad application prospects.
1.3. Industrial application stage (2021 to present)
Through nearly 20 years of research and testing, a whole industry chain technology system integrating carbon capture, carbon transportation, carbon utilization and carbon storage was preliminarily formed in China, allowing the CCUS-EOR technology ready for industrial promotion and application. In September 2020, with China committing to peak carbon emissions by 2030 and achieve carbon neutrality by 2060, the CCUS-EOR technology ushered in a period of opportunities for rapid development. By the end of 2021, CNPC had built four CCUS-EOR national pilot test areas featuring different types of oil reservoirs, including low-permeability reservoirs in Daqing Oilfield, ultra-low permeability reservoirs in Jilin Oilfield, ultra-low permeability reservoirs in Changqing Oilfield, and conglomerate reservoirs in Xinjiang Oilfield. The industrial CCUS applications in ultra-low permeability reservoirs in Jilin Daqingzijing and Daqing Yushulin oilfields have cumulatively injected CO2 for 452×104 t, accounting for over 70% of China’s total. The CO2 used in Jilin Daqingzijing and Daqing Yushulin oilfields is separated from the produced gas in gas reservoirs or captured in petrochemical companies, while the CO2 used in pilot tests on Changqing ultra-low permeability oil reservoirs is captured in natural gas conditioning plant and petrochemical companies, and the CO2 used in Xinjiang conglomerate reservoirs is captured from Karamay Petrochemical Company. As planned, the tests on industrial application in Jilin Daqingzijing and Daqing Yushulin oilfields will be completely sourced by the captured CO2 in Jilin Petrochemical Company and Daqing Petrochemical Company. At the beginning of 2022, CNPC announced the launch of a large-scale application project with an annual CO2 injection of 300×104 t in the Songliao Basin, with the carbon source completely contributed by the captured CO2 in Jilin Petrochemical Company and Daqing Petrochemical Company. Furthermore, CNPC will initiate the CCUS demonstration project in Changqing and Xinjiang oilfields. China Petrochemical Corporation (Sinopec) is building a demonstration project with an annual CO2 injection at the million-ton scale, and Yanchang Group has also carried out pilot test on CCUS. Therefore, the CCUS-EOR technology has entered a rapid development stage [13⇓⇓⇓⇓⇓⇓-20].
2. New understandings on mechanisms of CO2 flooding in continental reservoirs and field tests
CO2 is of high compressibility/elasticity, strong mobility, and strong diffusion ability, and has unique advantages as a special oil displacement medium for enhanced oil recovery. Injecting CO2 into reservoirs can expand the volume of crude oil and reduce its viscosity, thereby improving oil mobility and making it easier to be produced. The mass transfer between CO2 phase and oil phase can eliminate the interfacial tension, which makes the CO2 and the crude oil be miscible to form a homogeneous phase, which allows the oil displacement efficiency to be up to 100%. In other countries outside China, oil reservoirs are generally dominated by marine sediments, with relatively homogeneous physical properties. Therefore, 90% of CO2 flooding projects can achieve miscible flooding. The North American countries hold mature CO2 flooding technology owing to more than 30 years of efforts, which has contributed high oil production.
Through laboratory experiments and field tests, China has further broadened the miscibility mechanism of intermediate crude oil in continental sedimentary reservoirs, deepened the understanding on the role of CO2 in expanding crude oil volume, and proposed that C7-C15 components and their contents are also important factors affecting miscibility. As verified by the field tests in Jilin Daqingzijing Oilfield, it is easier to establish an effective displacement pressure system by CO2 flooding. In Daqingzijing Oilfield, injecting CO2 showed remarkable effects in interfacial tension reduction, oil swelling, viscosity reduction, and miscibility, which can effectively expand the swept volume and improve the oil displacement efficiency. Specifically, the CO2 miscible flooding test with small well spacing in the Hei 79-north block improved the phased recovery efficiency by more than 20 percent points. Referencing the development model of chemical flooding in becoming the main technology for enhanced oil recovery in medium- and high-permeability reservoirs, CCUS-EOR can be expected for low-permeability oil reservoirs in China.
2.1. Mechanisms of CO2 flooding in continental reservoirs
Through basic researches under the China National 973 Program and 863 Program, the mechanisms of CO2 flooding in continental sedimentary reservoirs in China were developed. Some new understandings were proposed in three aspects, that is, oil-CO2 swelling, key factors for miscibility between CO2 and formation oil system, and effect of single-carbon- number components on CO2 miscibility.
(1) Oil-CO2 swelling
After analyzing the components in crude oil from different oil regions in China, 11 representative hydrocarbon components were selected, that is, linear alkanes with 6-16 carbon atoms, monocyclic/bicyclic cycloalkanes, and monocyclic/bicyclic aromatic hydrocarbons. The 11 hydrocarbon components were respectively mixed with different mole fractions of CO2 to form hydrocarbon component-CO2 binary systems, which were then analyzed by constant-mass expansion (CME) test at different temperatures and pressures to clarify the volume swelling of the hydrocarbon components after mixing with CO2. In the research, the concept of molar density of hydrocarbon component was proposed, that is, the amount-of-substance of hydrocarbon components per unit of volume. The experiment results showed that, given constant temperature and pressure and mole fraction of CO2, the extent of volume swelling of CO2 with the same mole fraction to pure hydrocarbon components depends on the amount-of-substance of the pure hydrocarbon components per unit of volume. The larger the amount-of-substance of hydrocarbon components per unit of volume, the larger the volume swelling extent of hydrocarbon components after CO2 is dissolved. There is a linear positive correlation between the volume swelling coefficient and the amount-of-substance of hydrocarbon components per unit of volume before mixing with CO2 (Fig. 1 ). The linear relationship obtained by the hydrocarbon component-CO2 mixture test is also applicable to the real oil-CO2 mixture. According to this relationship, a method for rapidly predicting the oil-CO2 swelling was established. This method can achieve a calculation accuracy of more than 95%, which meets the needs of engineering applications. The results of research on hydrocarbon component-CO2 swelling have been successfully extended to the oil-CO2 system, which also demonstrates that the swelling effect of CO2 on crude oil is mainly due to the contribution of hydrocarbon components in crude oil [21].
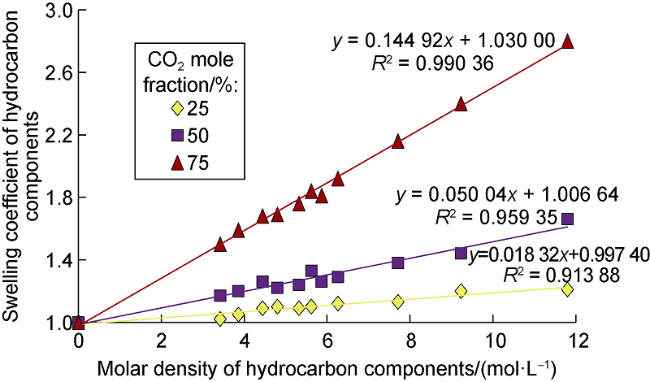
Fig. 1. Swelling coefficient vs. molar density of hydrocarbon components at 50 °C and 30 MPa. |
(2) Key factors for miscibility between CO2 and formation oil system
Such key factors were extended from C2-C6 components and formation temperature in traditional understanding abroad to C2-C15 components and formation temperature. The formation oil samples from 22 low-permeability reservoirs in 12 oilfields of 8 major basins around the world were analyzed for component distribution (Fig. 2 ). It is found that the content of C2-C6 components in oil reservoirs in China is lower than that in other countries, and the reservoirs in China and abroad are very different in the composition of crude oil. Through macroscopic experiments, the mass transfer characteristics after reaching miscibility between CO2 and three kinds of continental formation oil (light, medium, and heavy) were evaluated, and the experimental results were verified by using a long one-dimensional visualization sand-packing unit to simulate the real reservoir conditions. The dynamic process of miscibility between CO2 and oil was observed using a high-temperature and high-pressure fluid phase analyzer, which could intuitively show the CO2 extraction of oil. The original CO2 in the reactor was clear and transparent. When oil was injected from the bottom to increase the system pressure gradually, the oil-gas interface appeared chaotic, and a great quantity of hydrocarbon components in the formation oil were extracted to form an intermediate/transitional phase. In-depth analysis of the gas phase showed that the mass transfer of oil components occurred between phases level by level. The mass transfer of a level of components (C2-C6) promoted the mass transfer of the succeeding level of components (C7-C15), which in turn drove the mass transfer of heavy components (C16+) to finally form a miscible phase. At the formation temperature, the dynamic characteristics of CO2 miscible displacement in porous media were simulated by the long one-dimensional visualization sand-packing unit, and the fluid phase behaviors were observed and recorded by the terminal high-pressure visualization device. CO2 in the porous media replaced the oil forward. Through evaporation and condensation, the oil and gas fluids exchanged components to form a mass transfer transition zone. After rounds of processes, the oil and gas became miscible and the interface disappeared. The content of heavy components in the mass transfer transition zone gradually increased from left (CO2) to right (oil), gradually approaching the properties of oil. These activities explained the mechanism that the oil with a low content of C2-C6 components from some reservoirs in eastern China could still be miscible with CO2 under formation pressure, and innovatively developed the basic theory of the miscible phase state of continental oil. The achievements provided new ideas for reducing miscibility pressure in implementing CO2 flooding for medium oil recovery, and theoretical support for the large-scale application of CO2 miscible flooding [22-23].
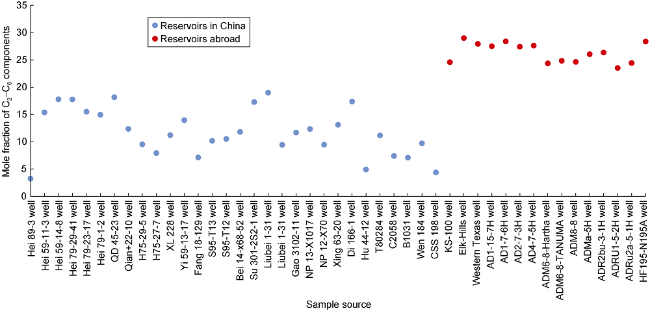
Fig. 2. Content of C2-C6 components in reservoirs in China and abroad. |
(3) Effect of single-carbon-number components on CO2 miscibility
For continental low-permeability reservoirs, which are characterized by presence of fractures, strong heterogeneity, and high miscibility pressure of oil, the effect of single-carbon-number components in C2-C15 on the miscibility of CO2 was investigated. Taking the oil from the Mahu 1 well block in Xinjiang Oilfield as an example, it was preliminarily determined that when CH4 changes by a unit of amount-of-substance, the CO2 miscibility pressure changes by +0.22 MPa; when C3H8 changes by a unit of amount-of-substance, the CO2 miscibility pressure changes by −0.51 MPa. These results point out the direction for the research on reduction of miscibility pressure in high miscibility pressure reservoirs. Subsequent efforts are recommended to focus on the effect of dual-carbon-number components on CO2 miscibility, and on expanding the swept volume of gas injection and improving the miscibility conditions.
2.2. Field tests
CNPC oilfields, such as Jilin, Daqing, and Changqing, have kept field tests on CCUS-EOR, extending from pilot test of CO2 huff-and-puff in wells to industrial test. Breakthroughs were made in core technologies such as the design of CCUS-EOR for continental low-permeability reservoirs, and a system of theory and technology of CCUS-EOR in continental sedimentary reservoirs was formed. With the support of these achievements, CNPC oilfields have witnessed the annual CO2 injection of 57×104 t and the annual oil production of 20×104 t in field tests.
CNPC’s CCUS-EOR field test started in the Daqingzijing Oilfield in Jilin. This oilfield is an ultra-low permeability (less than 10×10-3 μm2) structural-lithologic reservoir with poor physical properties, which is difficult to establish an effective water flooding system; therefore, the formation pressure level is maintained below 70%, and the recovery is only 20%. In 2008, the pilot test of CO2 flooding was carried out in the original undeveloped oil reservoir - Hei 59 block. In 2012, the expanded lifecycle test with small well spacing was performed in the ultra-low-permeability and high-water-cut oil reservoir - Hei 79-north block. In 2020, the industrial application demonstration area was established in Hei 125 block. In this process, the mechanisms of CCUS-EOR, such as CO2 injection into continental sedimentary reservoirs to quickly replenish formation energy and miscible flooding to greatly enhance oil recovery, were verified.
(1) CO2 can be injected to quickly and effectively restore formation energy, and CO2 miscibility can improve single-well production. In Jilin Oilfield, more than 80% of produced reserves are hard-to-recover reserves in low-permeability and unconventional reservoirs. In the initial production stage of low-permeability reservoirs, the formation pressure dropped rapidly, leading to poor water flooding performance and less-than-expected well production. It was urgent to find ways to replenish and effectively maintain formation energy for improvement of production and recovery. In May 2008, a pilot test of CO2 flooding with 6 injection wells and 25 production wells was conducted in the Hei 59 block, and the CO2 was transported in liquid state by tanker trucks. By October 2014, CO2 of 0.33 HCPV (hydrocarbon pore volume) was injected. After the formation pressure recovered initially to the miscible state, the oil production capacity became strong, and some production wells even realized high-yield flow, far more than the initial production, with the average daily oil production more than doubled from the level during water flooding. Compared with similar blocks developed by water flooding, the CO2 injection capacity was 2 to 6 times of the water injection capacity, which can quickly restore the formation pressure and maintain it at a high level above the original formation pressure (Fig. 3 ). This is a rare achievement in decades of ultra-low permeability reservoir development. In the past development of such reservoirs, the single-well productivity was low and declined rapidly after fracturing. The quick decrease of pressure coefficient made it difficult to establish an effective displacement system with water injection. As a result, the formation pressure maintained at a low level, and the recovery remained at low rate and low efficiency, with the economic benefits far below the expected threshold. By injecting CO2, the formation energy was quickly recovered, and the formation pressure was maintained above the original formation pressure during the production. After the miscibility was achieved, the single-well productivity was greatly improved from the initial level. Injecting CO2 into ultra-low permeability reservoirs can effectively maintain formation pressure during production, which may lay a solid theoretical and practical foundation for the effective development of such reservoirs.
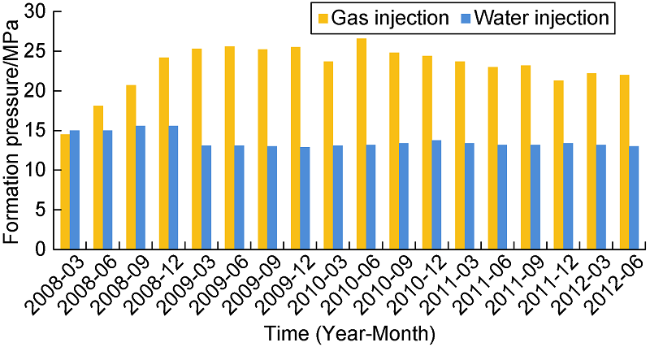
Fig. 3. Histogram of formation pressure in Hei 59 and analog blocks. |
(2) CO2 flooding can effectively reduce water and increase oil, and CO2 miscible flooding can greatly improve the recovery rate in low-permeability reservoirs. In order to scientifically and comprehensively evaluate the performance and EOR potential of CO2 miscible flooding, and to verify the feasibility of CO2 flooding and storage technology in continental sedimentary reservoirs, in July 2012, the CO2 flooding test with small well spacing (80 m × 240 m inverted seven-spot well pattern) was performed on layers 11 and 12 of Cretaceous Qing 1 Member in Hei 79-north block of Jilin Oilfield (Fig. 4 ). The test area was developed by water flooding with 160 m×480 m diamond inverted nine-spot well pattern since 2002. Before CO2 injection, the recovery rate was less than 0.5%, the total water cut was 91.6%, the recovery efficiency was 17.5%, and the formation pressure was about 16 MPa (about 67% of the original formation pressure). Moreover, Layer 12 was severely water-washed, and its oil saturation was 38.9% according to core analysis and saturation logging, indicative of strongly water-flooded. CO2 flooding mainly goes through three stages: energy replenishment, partial miscibility, and overall response. By the end of 2021, a total of 32.7×10⁴ t (1.05 HCPV) CO2 was injected in the CO2 flooding test with small well spacing, which revealed the production 5 times higher than that in water flooding. Currently, in the core evaluation area, the recovery rate is 1.7%, and the phased recovery efficiency is increased by 23 percent points; the recovery is enhanced by over 25 percent points as predicted (Fig. 5 ), and the ultimate recovery efficiency is more than 56.4%. According to the overall effect of the test area with small well spacing, the formation pressure increased significantly after CO2 injection and remained above the miscibility pressure 22.1 MPa, the water saturation of the water-flooded zone dropped significantly, the residual oil after water flooding was effectively produced, and the miscible dynamic characteristics of the block were obvious. The liquid production was increased by 20% in the early period of response, and remained basically stable in the middle and late periods. The total water cut dropped significantly - by 12 percent points in the whole block and 16 percent points in the core evaluation area. The recovery rate was greatly improved - to 2.2% in the whole block and 4.6% in the core evaluation area.
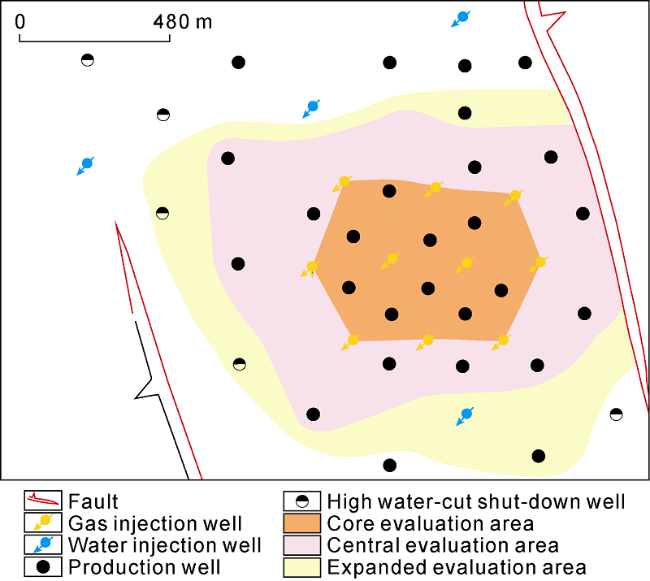
Fig. 4. Well pattern with small well spacing for CO2 miscible flooding in Hei 79-north block. |
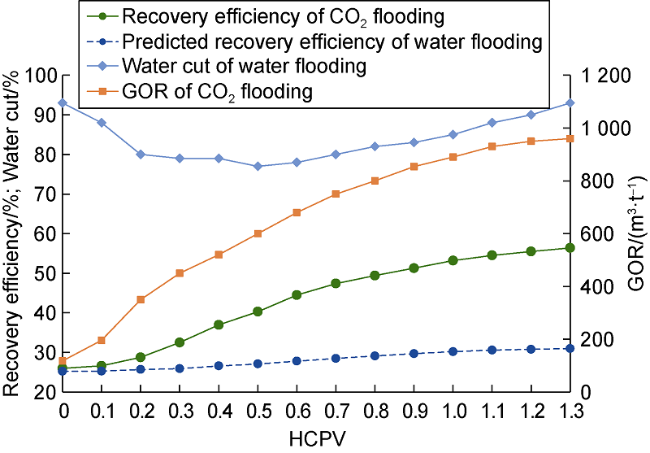
Fig. 5. Test curves of CO2 miscible flooding with small well spacing in core evaluation area of Hei 79-north block. |
(3) CO2 miscible flooding can effectively produce residual oil after water flooding, and CO2 flooding can further greatly improve the oil recovery after water flooding in ultra-low-permeability reservoirs. When reaching miscibility after CO2 injection, in view of single-well performance, the water saturation of the water-flooded zone dropped significantly, and the residual oil after water flooding was effectively produced. For typical flooded wells and high water-cut shut-down wells, the water cut dropped by 15 to 25 percent points after two years of gas injection, the response period lasted for more than 6 years, and the phased recovery efficiency was increased by 16.3 percent points. The effect of converting water injection wells to production wells was obvious, which further verified the water-reducing and oil-increasing characteristics of CO2 flooding, and expanded the space for well pattern adjustment. A typical water injection well demonstrated a cumulative injection of 14.6×10⁴ m3 before converting to a production well, which was shut down due to high water cut at the initial stage. It was reopened after two years of gas injection. As a result, the water cut dropped by 10-25 percent points, the response period continued for 5 years, and the phased recovery efficiency was increased by 15.4 percent points. Generally, after water breakthrough during the development of low-permeability reservoirs, especially at the high-water- cut stage during the development of ultra-low-permeability reservoirs, the liquid productivity index and oil productivity index drop sharply, ushering the onset of an ultra-low-velocity development stage when the recovery is difficult to enhance. When the production wells, which were converted from seriously water-flooded wells and long-term extensive water injection wells, reached miscibility after CO2 injection, the residual oil after water flooding was effectively produced, the microscopic sweep efficiency was improved, the water cut decreased from 100% to 80%, and the oil production continued to increase by a large margin. This shows that CO2 miscible flooding is an effective technique to enhance oil recovery of ultra-low-permeability reservoirs after water flooding, and it lays a practical foundation for developing oil-water transition zone with low oil saturation.
Based on the new understandings and field tests above, a four-stage CO2 flooding process for low-permeability reservoirs in China was proposed (Table 1 ), which provides the basis for reservoir engineering design and adjustment and subsequent industrial application of the CO2 flooding technique. In the initial stage of CO2 injection (stage I), gas is continuously injected, and the response of water flooding is remained. Some production wells are shut in and the formation energy gradually recovers. With the injection of gas, the main period of oil production by miscible flooding starts (stages II and III). In this period, the oil production accounts for more than 70% of the oil increment, and the miscible oil bank induced by CO2 flooding reaches all production wells. The water cut drops sharply, the liquid production and oil production rise to a plateau, and the gas-oil ratio (GOR) climbs to 500 m3/t. Some measures, such as plane profile control and production adjustment for non-response wells, are mainly adopted. In stage IV, the production is carried out with high GOR, and the liquid production and oil production gradually decrease. The necessary measures include injection-production coordination, water alternating gas (WAG), and chemical assisted control.
Table 1. Four-stage CO2 flooding process |
| Stage of CO2 flooding | CO2 injected/HCPV | Performance |
|---|---|---|
| Water flooding continuation and formation energy recovery (I) | 0-0.05 | Formation pressure rises and the response of water flooding continues. After gas flooding is implemented, for production wells with low water cut, the liquid production and oil production increase significantly, and the water cut decreases; for production wells with medium to high water cut, the liquid production increases, the oil production changes little, the water cut increases, the gas breaks through locally, and the GOR is less than 50 m3/t. |
| Successive response and production increase (II) | 0.05-0.30 | Miscible oil bank induced by CO2 flooding reaches the production wells successively, the total water cut begins to drop, the liquid production and oil production gradually increase, and the GOR gradually rises to 200 m3/t. |
| Overall response and stable production (III) | 0.30-0.65 | Miscible oil bank induced by CO2 flooding reaches all production wells, the water cut drops significantly, the liquid production and oil production rise to a plateau, and the GOR rises steadily to 500 m3/t. |
| Comprehensive breakthrough and high GOR (IV) | >0.65 | Breakthrough is realized in all production wells, gas channeling occurs in many production wells, the GOR is high (greater than 500 m3/t), and the liquid production and oil production decrease gradually. |
3. Technologies for optimizing CCUS-EOR reservoir engineering design
For continental sedimentary reservoirs in China, based on the understandings on the mechanisms of CO2 flooding and field tests, the reservoir engineering technologies for CO2 flooding and storage with the core principles of maintaining miscibility to improve oil displacement efficiency and uniform displacement to improve sweep efficiency were formed. These technologies can be used to design and adjust the reservoir engineering parameters, so as to maximize the potential of CO2 flooding in reservoirs for enhanced recovery effect. These technologies mainly involve reservoir numerical simulation, reservoir engineering parameter design, and well pattern/spacing optimization.
3.1. Reservoir numerical simulation for CO2 flooding
During CO2 flooding, interphase mass transfer occurs frequently. The phase state and physicochemical properties of each phase vary with temperature, pressure, and oil composition. In the process of reservoir numerical simulation describing this complex phase transition, it is very important to select and establish the multi-phase and multi-component equation of state (EOS) and three-phase relative permeability model, which determine the reliability of the simulation calculation.
In China, the content of heavy components in paraffin-based crude oil is high. After vaporization and extraction of light components by CO2, the crude oil then is dominated by heavy components. Predicting the phase state or fluid properties of the heavy component as well as the phase changes near the critical point is difficult in reservoir numerical simulation for CO2 flooding. Mechanism research and practical application show that the revised PR (Peng-Robinson) equation of state (Eq. (1)) can meet the technical needs. This equation is based on the PR three-parameter EOS, and introduces the CO2-hydrocarbon binary gravitational and repulsive interaction parameters into the mixing rule to characterize the interaction between dissimilar molecules in the CO2-hydrocarbon system, which well describes the interactions between heavy components and CO2.
$p=\frac{RT}{V-b}-\frac{a\alpha }{V\left( V+b \right)+b\left( V-b \right)}$
where $a\alpha =\sum\limits_{i=1}^{n}{\sum\limits_{j=1}^{n}{{{x}_{i}}{{x}_{j}}{{\left( {{a}_{i}}{{\alpha }_{i}}{{a}_{j}}{{\alpha }_{j}} \right)}^{0.5}}\left( 1-{{K}_{ij}} \right)}}$
${{\alpha }_{i}}={{\left[ 1+\left( 0.374\ 64+1.542\ 26{{\omega }_{i}}-0.269\ 92{{\omega }_{i}}^{2} \right)\left( 1-\sqrt{\frac{T}{{{T}_{\text{c}i}}}} \right) \right]}^{2}}$
$b=\sum\limits_{i=1}^{n}{\sum\limits_{j=1}^{n}{{{x}_{i}}{{x}_{j}}\left[ \left( {{b}_{i}}+{{b}_{j}} \right)/2 \right]\left( 1-{{D}_{ij}} \right)}}$
The parameters of the revised PR EOS can be obtained by fitting the experimental data from single flash, multiple degassing, crude oil expansion, and multiple contact of CO2 flooding by using phase state fitting software. At the same time, the method for characterizing the three-phase flow law of CO2 flooding is improved, and a new experimental method for accurate identification and quantitative characterization of three-phase fluid saturation is established by means of nuclear magnetic resonance and CT scanning. The relative permeability curves of oil, gas and water are obtained. Considering the oil flow and diffusion mechanisms of CO2 flooding in continental sedimentary reservoirs, a multiphase and multi-component numerical model for CO2 flooding is established, which can be solved by implicit iterative difference scheme, forming a numerical simulation method for CO2 flooding. The method has been applied in designing field test scheme in the Hei 59, Hei 79, and Hei 46 blocks of Jilin Oilfield, showing the predicted coincidence rate of more than 90%. Thus, it effectively guides the tracking and adjustment of field test.
3.2. Design of reservoir engineering parameters for CCUS-EOR
Design of reservoir engineering parameters for CO2 flooding and storage needs an accurate understanding on reservoir heterogeneity. According to the geological characteristics of the reservoirs and the characteristics of gas injection development, and by using the methods such as numerical simulation, analogy analysis, and calculation with empirical formula, the layer combination, well pattern deployment and injection parameters (e.g. gas injection rate, slug size, injection-production ratio, and injection pattern) are designed, optimized and adjusted. According to the testing performance and the whole process adjustment experience in Hei 79-north block, the parameter design and adjustment are generally completed subject to the principles of maintaining miscibility to improve oil displacement efficiency and uniform displacement to improve sweep efficiency.
The gas injection rate and production well flow pressure should be optimized to maintain the reservoir miscibility pressure and a certain recovery rate. If the daily gas injection is too small, the formation pressure will rise slowly, and the gas flooding recovery will not be improved significantly or even not catch up with the water flooding recovery. When the daily gas injection is higher than a reasonable value, gas channeling will be accelerated and the recovery will not increase. In the CO2 flooding test with small well spacing in the Hei 79-north block, after 6 months of gas injection since June 2012, the formation pressure reached the minimum miscibility pressure and maintained a high level, and the calculated annual average injection volume was kept around 0.1 HCPV. Different injection-production ratios should be adopted depending on stages. In the energy recovery stage, due to the formation energy deficit caused by water flooding, continuous gas injection pattern is adopted, and the injection-production ratio is kept between 1.5 and 1.8, to quickly restore the formation pressure and reach the miscible state as early as possible. In the miscibility stage, a high level of formation pressure is maintained, the injection-production ratio is appropriately reduced, and various measures to delay gas channeling are taken to exert the effect of miscible flooding.
To determine the cumulative injection volume, the relationships between the maximum recovery and the utilization rate of injected gas, oil production, and produced gas tolerance of surface system should be comprehensively considered. In the CO2 flooding test with small well spacing in the Hei 79-north block, favorable results were obtained after injecting CO2 for 1.0 HCPV, and there was a positive correlation between the oil increment and the gas injection volume; however, the oil exchange rate showed a downward trend. Therefore, the goal of the design should be to maximize the injected hydrocarbon pore volume, and to make the oil exchange rate reach economic limit.
WAG is an effective method to control the mobility of gas flooding. In China, the reservoirs are characterized by multiple layers and strong heterogeneity, and the gas supply and surface treatment capacities are insufficient. Therefore, water and gas slugs with varying sizes are preferentially used. A large continuous gas slug is injected, and then a relatively small water slug is injected, alternating with each other. The gas slug size gradually decreases and the water slug size gradually increases, so that the gas production is reduced to improve the utilization efficiency of the injected gas. Referring to the CO2 flooding test with small well spacing in the Hei 79-north block, the gas-water slug ratio at the initial stage of gas injection is set at 2:1 (gas slug injection for 2 months, and water slug injection for 1 month), in order to maintain the miscibility pressure and prevent gas channeling. When gas channeling occurs in a local unit, the gas-water slug ratio of the unit is adjusted to 1:1 to gradually control gas channeling. In the late stage of miscible flooding, the GOR rises sharply, foam flooding is used to control the profile, and the gas-water slug ratio is adjusted from 1:1 to 1:2. In this way, the GOR rising rate is delayed, and the life of miscible flooding under relatively high GOR conditions is prolonged.
CO2 foam flooding can alleviate the interlayer and intralayer contradictions, control gas channeling, effectively expand CO2 swept volume, and improve development effect. On the one hand, due to the high resistance factor, the foam can effectively control the gas or water mobility and improve the displacement mobility ratio. On the other hand, the foaming agent has surface activity and has the functions of reducing interfacial tension, emulsifying, peeling, etc., allowing it to help improve the oil washing efficiency, which will greatly improve the recovery. Jilin Oilfield has developed a CO2 foam flooding system suitable for high temperature conditions. This system is composed of foaming agent (0.4%) and foam stabilizer (0.15%), with the foaming rate greater than 300%, and the half-life greater than 3 600 s. Foam flooding was implemented in three wells. After foam injection, the gas injection pressure increased by 2.8 MPa, and the water injection pressure increased by 2.1 MPa. The injection profile tended to be balanced, the liquid production and oil production increased, and the GOR decreased. This indicates that CO2 foam flooding can control gas channeling and play a role in expanding swept volume.
To sum up, CO2 miscible flooding with an injection rate of 0.1 HCPV/a, a reasonable injection-production ratio, a large injected hydrocarbon pore volume, and an accurate WAG model can greatly improve the recovery of ultra-low-permeability reservoirs after water flooding.
3.3. Optimization of well pattern/spacing for CCUS-EOR
The design of well pattern and well spacing is very important in establishing an effective injection-production displacement system in the process of water flooding in ultra-low-permeability reservoirs. Since the 1990s, through a large number of laboratory experiments and field tests, a wealth of practical experience has been accumulated, and the well pattern and well spacing suitable for water flooding in ultra-low-permeability reservoirs have also been formed. The Daqingzijing Oilfield as a whole is an ultra-low-permeability reservoir with good oil properties, where the delta underwater distributary channel and front sheet sand body with southwest provenance along the direction of maximum in-situ stress are developed in the near east-west direction. In the early stage of water flooding in this oilfield, a diamond-shaped inverted nine-spot well pattern (160 m×480 m) elongated along the east-west corner wells was determined. After 15 years of water injection, the average annual recovery rate reached about 1%, suggesting a good development result. The analysis of various factors reveals that this well pattern controls weakly on sand bodies, and it is especially necessary to improve the displacement strength and sweep efficiency of different types of sand bodies with a large well spacing along water flooding distributary lines and east-west direction.
The inverted nine-spot well pattern can be transformed into inverted seven-spot well pattern or five-spot well pattern by converting old well to injection well, or into five-spot or inverted seven-spot well pattern by drilling infill well (Fig. 6 ). The following well patterns are proposed for CO2 flooding test.
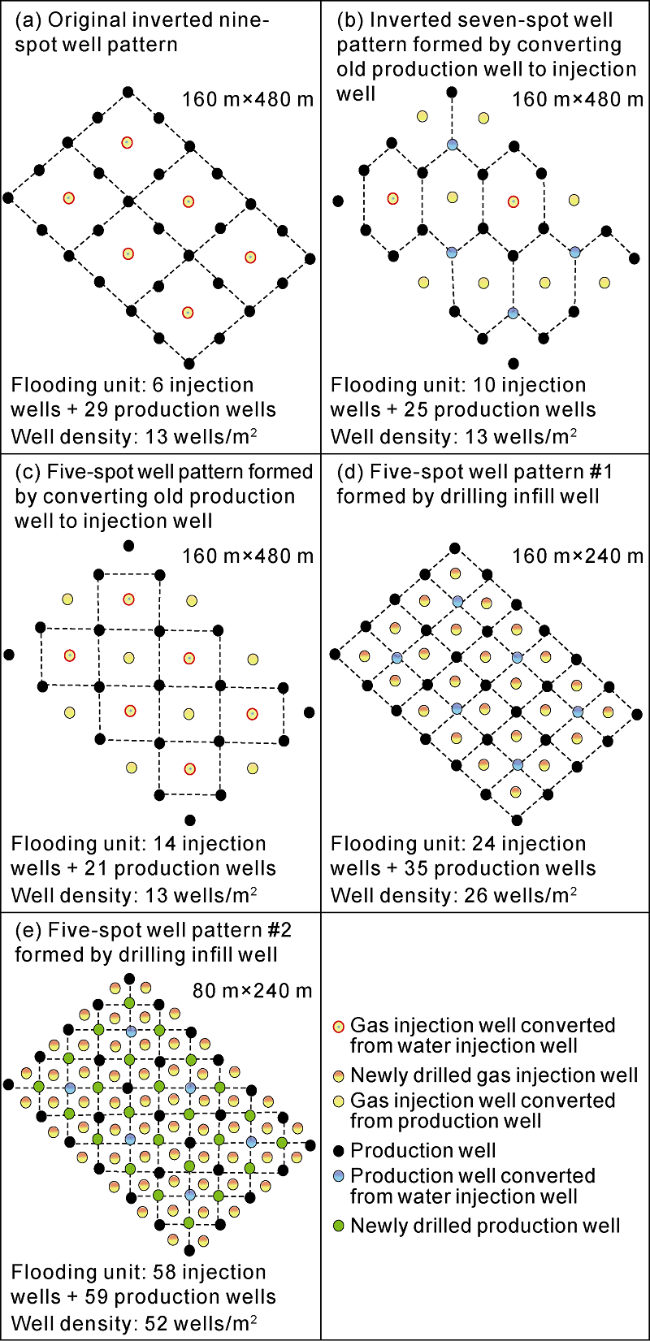
Fig. 6. Adjustment of well patterns in Daqingzijing Oilfield. |
(1) Original well pattern for water flooding. For the CO2 flooding test in the Hei 46 block, a basic diamond-shaped inverted nine-spot well pattern (160 m×480 m) is adopted, with the ratio of production wells to gas injection wells of 3:1, and the reserves controlled by a single gas injection well are 5 times that in the test with small well spacing in the Hei 79-north block. Given the annual injection of 0.1 HCPV CO2 at small well spacing, a daily injection of 80 t gas and 137 t water is required for a single well. However, in the Hei 46 block now, the actual daily injection is 50 t gas and 40 t water, and the annual injection is 0.03 HCPV, far less than the injection volumes in the test with small well spacing in the Hei 79-north block. Overall, the Hei 46 block is in an immiscible flooding state, with poor dynamic response.
(2) Inverted seven-spot well pattern or five-spot well pattern formed by converting old well into injection well. This well pattern (160 m × 480 m) was tested in the Hei 59 and Hei 79-south blocks where the formation pressure remained at only 60% before CO2 injection. Rapid injection and production well soaking were adopted to make the reservoir reach the miscibility pressure before production. Initially, a favorable production was achieved, and even a high flow yield was obtained in some wells. After a period of production (2 to 3 months), the productivity declined greatly, and the miscibility pressure could not be maintained due to the too large well spacing.
(3) Five-spot well pattern formed by drilling infill well between the injection well and the corner well. This well pattern (160 m×240 m) was adopted in the Hei 125 block. On one hand, drilling infill well could improve the sweep efficiency. On the other hand, water broke through fast in the NE direction, resulting in high water cut, which was also the main sand belt direction to be controlled by the source; thus, the injection well row was adjusted to this direction. The ratio of production wells to gas injection wells was 1:1, and the geological reserves controlled by a single gas injection well were 6×10⁴ t, which was close to that (4.1×10⁴ t) in the test with a small well spacing. After injection of 0.07 HCPV CO2, the formation pressure in local wells approached the miscibility pressure. This verified that the adjustment of well pattern by drilling infill well is feasible. Some wells achieved a production doubled, and other wells witnessed a reduction of water cut and great increase of production. Some reservoirs with poor physical properties also obtained high productivity after flooding.
(4) Five-spot well pattern or inverted seven-spot well pattern formed by drilling infill well both between existing wells and rows. This well pattern can control much more sand bodies, with the well spacing reduced by half. In the test with small well spacing in the Hei 79-north block, an inverted seven-spot well pattern (80 m × 240 m) was adopted, with the ratio of production wells to gas injection wells of 2:1. After the whole-process test for 10 years, in the core evaluation area, the annual injection was maintained above 0.1 HCPV, the gas-water slug ratio was about 3:2, the formation pressure was always above the miscibility pressure (22.1 MPa), and the overall GOR kept stable. By the end of 2021, the average daily oil production of a single well in the core evaluation area was more than doubled, with a GOR of 954 m3/t and a water cut of 86% (Fig. 7 ). From the dynamic performance, it can be seen that there is a peak response period, and the miscible oil bank of CO2 flooding inhibits the rapid rise of the total water cut in production wells, demonstrating a favorable oil displacement effect. In the central evaluation area, the average daily oil production was increased by more than 1.8 times, with a GOR of 537 m3/t and a water cut of 82% (Fig. 8 ). The test process revealed that a too small well spacing would lead to more difficult control. Some production wells in the central evaluation area are far away from the injection wells. Compared with the core evaluation area, the central evaluation area exhibits a longer continuous response time and a slower rise of GOR. Therefore, in designing well pattern and well spacing, it is necessary to extend the response period as much as possible and reduce the difficulty in controlling gas channeling while ensuring the injection capacity, miscible displacement and control over reservoir sand bodies.
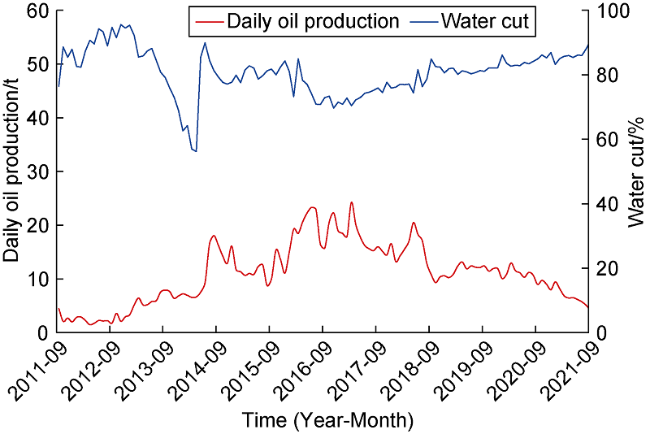
Fig. 7. Production profile of the core evaluation area in CO2 miscible flooding test with small well spacing in Hei 79-north block. |
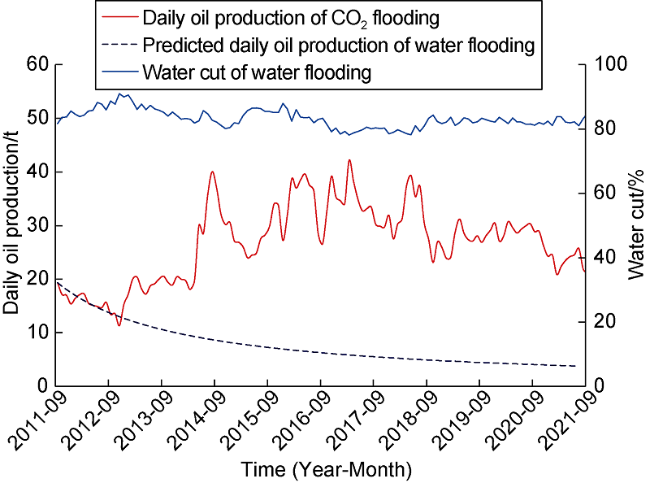
Fig. 8. Production profile of the central evaluation area in CO2 miscible flooding test with small well spacing in Hei 79-north block. |
Through the tests with different well patterns and well spacings, it can be seen that the well pattern for CO2 miscible flooding requires more than that for water flooding in conventional low-permeability reservoirs. Higher injection-production ratio and injection rate are essential for realizing the miscibility pressure. In low-permeability reservoirs, where the injection capacity of a single well is limited, the ratio of production wells to gas injection wells is very important in designing well pattern for CO2 miscible flooding. Moreover, for maintaining a reasonable well spacing, it is necessary to retain the formation pressure and also to avoid premature gas channeling which may lead to an early entry into the high GOR stage. The focus of future well pattern adjustment is to seek a balance among ensuring injection capacity, achieving uniform miscibility, and preventing gas channeling to maximize the peak response period.
4. Engineering supporting technologies for CCUS-EOR
The CO2 flooding process is quite different from conventional water flooding process. The CO2 phase state changes complicatedly. Corrosion, gas sealing, and high-pressure injection-production are the bottlenecks restricting the safety of CO2 flooding. These features bring many challenges to the technology implementation. Through years of efforts, some engineering supporting technologies have been formed, such as CO2 capture, coiled tubing gas injection, carbon steel + corrosion inhibitor for low-cost anticorrosion, and CO2 storage monitoring. These technologies have solved the anti-corrosion problem for the entire injection-production system at different nodes and under different working conditions, and facilitated the whole process of CCUS-EOR test. They basically ensure the industrialization of CO2 flooding in Jilin Oilfield, and promote the large-scale and beneficial development by CCUS-EOR.
4.1. CO2 capture technologies
CO2 capture refers to the process of separating and enriching CO2 produced during the utilization of fossil energy. According to the separation principle, the CO2 capture technologies mainly include chemical absorption method, physical absorption method, membrane separation method, adsorption separation method, and oxygen-enriched combustion method. The CO2 emitted by coal power and refining enterprises is the main stable carbon source that can be captured, which consists of combustion emissions, process emissions, fugitive emissions and external supply emissions. The combustion emissions take a high share. The CO2 in the flue gas accounts for 8% to 14%, which is a low-concentration carbon source. The CO2 in the exhaust gas discharged from hydrogen production, sulfur recovery tail gas and other devices accounts for about 30% to 50%, which is a medium-concentration carbon source. The CO2 emitted from devices synthesizing ammonia, ethylene glycol ethylene oxide, and butyl octanol and from the tail gas produced because of light hydrocarbon decarbonation accounts for more than 90%, which are high-concentration carbon sources. CO2 emissions from refining enterprises account for 68% of CNPC's direct CO2 emissions.
Specific CO2 capture technology is required for different concentrations of carbon sources. The framework of CO2 capture system and corresponding capture technologies have been innovatively integrated for high-, medium- and low-concentration carbon sources, realizing a full coverage of carbon capture from different industrial gas sources. Commonly, the chemical absorption method is used in capturing CO2 from low- and medium-concentration carbon sources, and the physical absorption method is used in capturing CO2 from high-concentration carbon sources. CNPC has built three improved amine decarbonization units in the carbon capture base of Changling Gas Field in Jilin, for capturing CO2 with a concentration of 23% from the gas produced from volcanic gas reservoirs, with a total CO2 capture capacity of 65×104 t/a. CNPC has also built a pressure swing adsorption unit with a capacity of 7×10⁴ t/a, which captures CO2 from the gas produced in oil displacement. A CO2 capture unit with a capacity of 10×104 t/a was built in Karamay Petrochemical Company, Xinjiang, which captures the exhausted gas from the refinery by using the new compound organic amine liquid method.
4.2. CO2 injection-production technologies
In Jilin Oilfield, the well completion process by injecting gas based on "gas sealed tubing + gas sealed packer" has been operated safely and stably for 8 years in field test of 78 wells. In 2020, an innovative technology was developed by replacing gas sealed tubing with coiled tubing. Furthermore, multi-functional wellhead suspension and downhole sealing devices were developed independently, which can greatly reduce the risk of gas-sealing control and improve the inspection cycle and operation efficiency. Field application in 10 wells demonstrated that the one-time investment in well completion was dropped by 28%, and the cost could be reduced by 66% during the service period, which meet the needs of economical and efficient gas injection in practical CO2 flooding. The gas lifting technology that integrates anticorrosion, gas lift, pumping assistance, and casing control was applied to 287 wells. Combining with the gas/liquid separate transportation on the ground, the gas lifting technology realized the normal production of production wells with high gas-liquid ratio, and converted the lift of production wells with high gas-liquid ratio into the lift of “conventional wells", which improved the lifting efficiency and reduced the routine maintenance and operation costs by 30%. The application of gas/liquid separate transportation has realized the normalized production management on the production wells with high gas-liquid ratio or on the gathering system after gas channeling. The first CO2 circulating injection station in China was built, with a daily gas injection capacity of 20×104 m3, realizing the "zero emission" of the produced associated gas and the full storage of injected CO2.
4.3. Whole process equipment
Through years of efforts, Jilin Oilfield has gone through the whole process of CO2 capture, transportation, injection, produced fluid collection and transportation, and cyclic gas injection, and developed a series of core equipment covering the entire system of injection, production, and cyclic injection, facilitating the equipment localization, factory prefabrication, modular construction, and intelligent operation. The unit integrating CO2 capture, CO2 refrigeration, liquid and supercritical CO2 injection, gas-liquid two-phase separation, oil-gas-water three-phase separation, produced gas treatment and reinjection, and corrosion control has realized the cyclic utilization of CO2. In the Hei 125 industrialization demonstration zone of Jilin Oilfield, the surface engineering process was optimized and simplified, and intensive well construction and integrated skid-mounted design were adopted; thus, the investment in land acquisition and pipeline projects was reduced by 21%. Furthermore, by virtue of intelligent management and control, the wells/stations were unattended, saving 50% of labor force.
4.4. System-wide anti-corrosion technologies
Considering the corrosion characteristics of CO2, together with the actual operating conditions of CO2 flooding and storage, a corrosion evaluation method integrating laboratory, pilot and field tests was developed to clarify the corrosion laws and main controlling factors of each link during CO2 flooding. The anti-corrosion cement and "corrosion inhibition + sterilization + scale inhibition" composite corrosion inhibitor system were developed, and the supporting mobile and fixed corrosion inhibitor injection processes were integrated. A system-wide anti-corrosion technology covering CO2 capture, injection, production, and cyclic reinjection was formed. With these technologies and processes, the corrosion rate during field test was lower than 0.076 mm/a, meeting the requirements of industry standards. The surface system has been running safely and smoothly for 8 consecutive years, the maintenance-free period of production wells has been increased from 580 d to 900 d, the anti-corrosion cost has been reduced by 40%, and the anti-corrosion effect is remarkable.
4.5. CO2 monitoring technologies
The safety monitoring of CO2 storage involves three aspects: atmospheric CO2 concentration monitoring, soil gas concentration monitoring, and pH and CO32−, HCO3− and CO2 concentration monitoring of surface water and lake water. The methods for safety monitoring of CO2 storage were optimized and combined (Table 2 ), and an underground + surface + space integrated monitoring method and evaluation process were formed, which were successfully applied to the CO2 test area of Jilin Oilfield. The results show that the main indicators in the monitoring stage are normal, indicating safe CO2 storage.
Table 2. Methods for safety monitoring on CO2 storage |
| Item | Monitoring stage | Monitoring point | Monitoring requirements | Monitoring interval | Monitoring equipment |
|---|---|---|---|---|---|
| Atmospheric CO2 concentration | During gas injection | Select about 10 gas injection wells and production wells in the test area, and take samples within 20 m around each well | Measure CO2 concentration | Quarterly, or more frequently in case of abnormality | Pump suction CO2 detector |
| Soil gas concentration | During gas injection | Select about 10 gas injection wells and production wells in the test area, and take samples within 20 m around each well | When the CO2 concentration is higher than the normal value and the predicted value, then carry out the concentration test on O2, N2, CH4, C2H6, C3H8 and other gases, so as to analyze the source of CO2 | Quarterly, or more frequently in case of abnormality | DIK-5220 soil gas sampler |
| After gas injection | Annually after the injection, in 5 years | Gas chromatograph | |||
| pH and CO32-, HCO3- and CO2 concen- trations of surface water and lake water | Before gas injection | Drill two shallow formation water wells in the production well site in Hei 59 test area, and set up two sampling points; set up eight sampling points in the surface water source wells in the eight metering rooms in the south Hei 79 block; set up two sampling points in nearby villages | Measure the pH value and CO32-, HCO3-, and CO2 concentrations of original surface water samples | Once | Portable multiparameter water quality analyzer |
| During gas injection | Measure the pH value and CO32-, HCO3-, and CO2 concentrations of shallow surface water | Quarterly, or more frequently in case of abnormality |
There are problems during CO2 flooding, such as unstable miscibility, difficulty in controlling fluid migration, prominent corrosion, and high safety and environmental requirements. Accordingly, some special items need to be added in reservoir monitoring, mainly including injection profile monitoring, direct reading pressure monitoring, well fluid analysis, gas phase tracer, corrosion monitoring, and CO2 leakage monitoring. These items have achieved good results in the CO2 flooding test area of Jilin Oilfield, with the characteristics and trends of dynamic changes in the test area clarified, providing technical support for maintaining miscibility and preventing gas channeling, corrosion and leakage. The dynamic monitoring technology suitable for CO2 flooding has been initially formed.
5. CCUS-EOR prospects
Field practices worldwide have proved that CCUS-EOR is the main method for large-scale carbon emission reduction, and also a strategic replacement technique for improving the production and recovery of abundant low- permeability and unconventional resources in China [22].
China is far behind other countries in CCUS-EOR, especially in basic research, core technologies, scale of field test, EOR cost control, large-scale CCUS engineering application, some key technologies of CCUS-EOR for continental oil reservoirs with strong heterogeneity, and field management. In China, CCUS-EOR is in a critical strategic development period. Great efforts should be taken to improve the relevant technical standards, perform industrial tests, develop major technologies, and reduce comprehensive costs. Under the background of global goals of "carbon peak and carbon neutrality", the trend of seriously fluctuating carbon trading prices is irreversible, and CCUS-EOR is prospective for the green and low- carbon transition in upstream and downstream business of oilfield companies. Preliminary evaluation shows that the potential of CO2 sequestration in China reaches (1.21-4.13)×1012 t [24]; specifically, the low-permeability oil reservoirs suitable for CCUS-EOR in China contain the reserves exceeding 100×108 t, and have the potential of additional recoverable reserves of 20×108 t or more.
In order to achieve efficient utilization and permanent storage of CO2, CCUS-EOR can be implemented in two stages. In the first stage, i.e. CO2 flooding and storage, the dominance of areal flooding in the main part of the reservoir is gradually changed to gravity flooding in structure-controlled areas after injecting a large HCPV of CO2; in this way, the oil-water transition zone with low oil saturation is effectively developed. While utilizing CO2 for oil displacement as a resource, effective storage of CO2 is realized. As a common practice in this stage, CO2 flooding is dominant, and a certain extent of beneficial CO2 storage is also considered. In the second stage, i.e. CO2 storage and utilization, CO2 is permanently stored and utilized. For example, microorganisms are used to convert CO2 and residual oil into methane, so that the CO2 can be permanently stored and the tailing resources can be reused.
5.1. CO2 flooding and storage
Driven by unconventional ideas and technologies, the understandings on resources have changed revolutionarily in recent years. In some basins such as Ordos and Songliao, a large quantity of low-grade resources has been discovered. They are widely endowed in continuous reservoirs. Most of them are found in the relatively low parts of conventional oil reservoirs, which belong to oil-water transition zones, with an area 3 to 5 times larger than that of conventional oil reservoirs. Due to low oil saturation, these resources are difficult to recover by conventional techniques.
The CO2 flooding test in the oil-water transition zones in some blocks of Daqingzijing Oilfield showed good results. Conventional low-permeability reservoirs and large-area oil-water transition zones with low oil saturation can be considered as a whole to realize both recovery of unconventional resources and CO2 flooding and storage.
It is found that the oil in the oil-water transition zone of continuous reservoir remains the composition of conventional thin oil generally, suggesting the potential to change the development mode. The gravity-stable CO2 flooding can further improve the recovery and storage rate. Comparison of oil samples from the Hei 102 fault block of Daqingzijing Oilfield indicates that the crude oil from the oil-water transition zone contains slightly higher content of heavy saturated hydrocarbons and colloids and less aromatic hydrocarbons than that from conventional reservoirs, but reveals basically identical four-component content (Fig. 9 ). This proves that the crude oil from the wide oil-water transition zone in Daqingzijing Oilfield maintains the characteristics of conventional thin oil. The oil displacement and storage effects of plane miscible flooding and gravity-stable CO2 flooding in the oil-water transition zone were simulated numerically. It is found that, under the same HCPV, the recovery rate and cumulative storage rate of gravity-stable CO2 flooding are 10.5 and 10.2 percent points more than that of plane miscible flooding (Fig. 10 ).
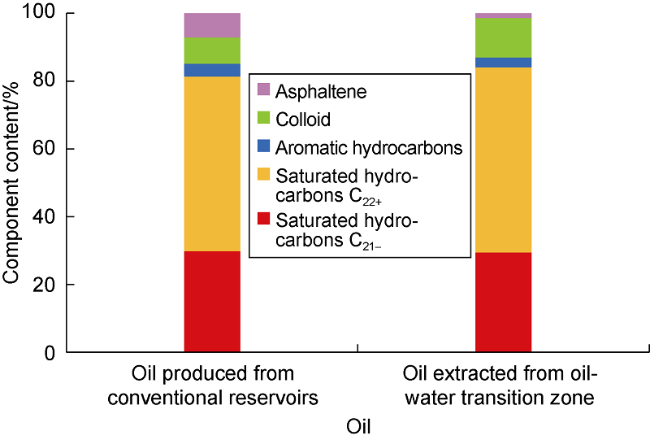
Fig. 9. Components of oil from Daqingzijing Oilfield. |
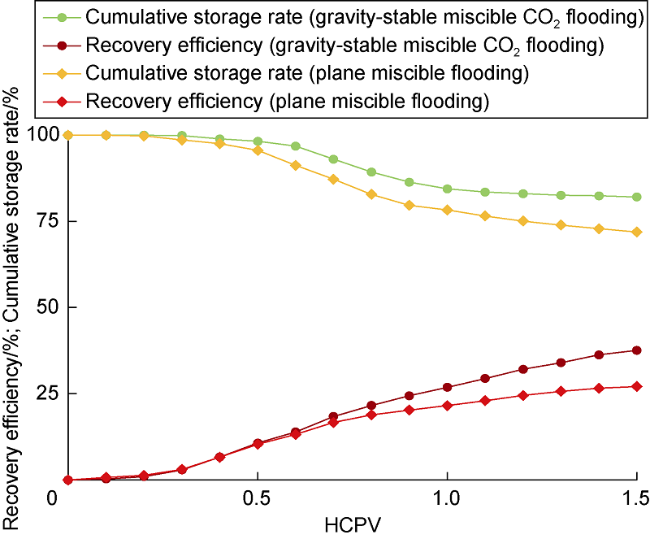
Fig. 10. Recovery efficiency and cumulative storage rate of oil-water transition zone under different CO2 flooding techniques. |
Taking complex fault blocks and surrounding oil-water transition zone into consideration, CO2 flooding and storage can be upgraded from a single fault block reservoir to a large-scale overall area controlled by structure, which can drive the effective development of the oil-water transition zone with low oil saturation and realize the maximum utilization of CO2 flooding and storage. The Changling fault depression in southern Songliao Basin has the conditions for large-scale CO2 flooding and storage demonstration in the overall area controlled by structure. Conventional ultra-low-permeability reservoirs distribute in a limited range, and a large number of oil-water transition zones such as oil-water layers and oil-bearing water layers develop in the low parts. Considering the overall structure, if conventional oil reservoir and the oil-water transition zone are developed together, the crude oil in the transition zone can be recovered while storing CO2, which greatly expands the storage space and is the best choice for CCUS-EOR. In Daqingzijing Oilfield, the reservoirs suitable for CO2 miscible flooding contain geological reserves of 1.12×10⁸ t, with the potential additional recoverable reserves of more than 0.5×10⁸ t and cumulative CO2 storage of more than 1.0×10⁸ t. If the fault-block reservoir and the oil-water transition zone are taken as a whole, gravity-stable CO2 flooding can realize the effective development of the oil-water transition zone, and the reserves suitable for CO2 flooding and storage will be increased by 3 to 5 times.
5.2. CO2 storage and utilization
The CO2 storage process involves various media such as minerals, fluids, and original microorganisms, and mainly refers to mechanisms such as volume displacement, dissolution retention, and mineralization reactions. After CO2 flooding, 30% to 40% of crude oil remains in the ground. Therefore, it is necessary to explore reserve technologies such as enhanced production in the later stage of CO2 flooding and conversion of residual oil into methane. Microorganisms can be considered to convert CO2 and residual oil into methane, thereby enabling CO2 permanent storage and tailing resource reuse.
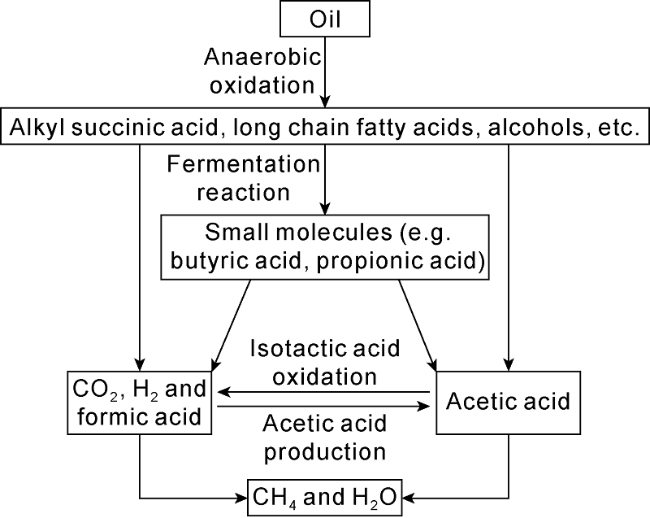
Anaerobic hydrocarbon degradation is a ubiquitous and slow process in oil reservoirs. After CO2 injection, the reservoir environment becomes weakly acidic, which is conducive to activating the hydrogenase [25]. H2 is generated under the action of hydrogen-producing bacteria, and CO2 and H2 will be further converted into methane under the action of hydrogenophilic methanogens (Fig. 11 ) [26].
Fig. 11. Process of anaerobic microorganisms to produce methane by using oil and CO2. |
Experiments have shown that under the reservoir conditions, the high-concentration CO2 promotes the anaerobic degradation of hydrocarbons and the decomposition of acetic acid, which nearly doubles the methane generation [27]. In the process transiting from CO2 flooding to storage, the CO2 storage in the reservoir will help to promote the degradation and conversion of a large amount of difficult-to-exploit residual oil into small molecular organic matter, and finally into methane. For example, by using the microbial community in the produced fluid from Yumen Oilfield, and after adding oil and CO2, the volume ratio of produced methane reached 18.2% after 800 d anaerobic culture.
A large number of abandoned oil reservoirs will store CO2 which will be at the same time transformed into methane by anaerobic microorganisms. Owing to gravity differentiation generated by the density difference between methane and CO2, methane will be enriched in the structural high parts, and then produced when necessary. In this way, CO2 will be stored permanently.
6. Conclusions
Through decades of efforts, the theory of CO2 flooding and storage suitable for continental sedimentary reservoirs in China has been innovatively developed, and breakthroughs have been made in core technologies, laying a good foundation for industrialization.
It is proposed innovatively that C7-C15 are also important components that affect the miscibility of CO2 and crude oil. Field tests have proved the mechanisms that CO2 can rapidly recover formation energy and greatly improve block productivity and recovery rate, which help realize the effective development of residual oil in ultra-low-permeability reservoirs with high water cut.
Reservoir engineering design technologies for CCUS- EOR in continental sedimentary reservoirs were developed, and reservoir engineering parameter design technology and well pattern/spacing optimization design technology focused on maintaining miscibility to improve oil displacement efficiency and uniform displacement to improve sweep efficiency were formed. These technologies can maximize the CO2 flooding potential for reservoirs.
Through continuous research and testing, the whole process supporting technologies including CO2 capture, injection-production, system-wide anti-corrosion, and monitoring have been initially formed, and the core equipment are basically localized, effectively facilitating the breakthroughs and progress in field tests.
The cumulative gas injection is generally low in CCUS-EOR test blocks in China. Only the Hei 79-north block of Jilin Oilfield reached 1.05 HCPV gas injection in the test with small spacing, where the predicted ultimate recovery rate is 56.4%, merely about 44% of the geological reserves remaining in the formation. It is necessary take into account the oil-water transition zone for the large-scale CO2 flooding and storage in the area from single reservoir to the overall structural control system. The oil reservoir in the oil-water transition zone is developed by stable gravity flooding of injecting CO2 from structural highs. The conversion of CO2 and residual oil into methane by using microorganisms is also realized, so as to drive the ultimate recovery of miscible flooding to reach more than 70% and to maximize the recovery rate and CO2 storage rate.
Acknowledgments
We appreciate WANG Feng, ZHANG Deping, and LI Jinlong from PetroChina Jilin Oilfield Company, and YANG Yongzhi, ZHANG Ke, HAN Haishui, SUN Yingying and WANG Lu from PetroChina Research Institute of Exploration & Development, who provided grand support to this work.
Nomenclature
a—average gravitational coefficient of mixture, J/mol;
ai, aj—gravitational coefficients of component i and component j, J/mol;
b—average repulsion coefficient of the mixture, m3/mol;
bi, bj—repulsion coefficients of component i and component j, m3/mol;
Dij—binary repulsive interaction parameters between component i and component j in the mixture, dimensionless;
i, j—component number, i≠j;
Kij—binary gravitational interaction parameters between component i and component j in the mixture, dimensionless;
n—number of components;
p—reservoir pressure, Pa;
R—gas constant, J/(mol·K);
T—reservoir temperature, K;
Tci—critical temperature of component i, K;
V—molar volume of the mixture, m3/mol;
xi, xj—mole fractions of components i and j in the mixture, %;
α—temperature fitting function, dimensionless;
αi, αj—temperature fitting functions of components i and j, dimensionless;
ωi—pitzer eccentricity coefficient for component i in the mixture, dimensionless.