

Introduction
Deep shale gas (buried depth deeper than 3500 m) is the most realistic option for increasing shale gas reserves and production in China [1-2]. In 2011, Well Y101 (vertical depth of 3577 m), jointly drilled by PetroChina and Shell in the Luzhou block of the low-steep structural belt in the southern Sichuan Basin, achieved a gas production of 43×104 m3/d during test, recording an exploration breakthrough of shale gas deeper than 3500 m. Since then, PetroChina and Sinopec have obtained commercial gas flows from deep strata in the Luzhou, Yuxi, Dingshan, Yongchuan and Weirong blocks, and confirmed proven deep shale gas reserves in the Weirong, Yongchuan and Luzhou blocks [3]. Important progress has also been made in geological evaluation [4-5], reservoir stimulation [6] and productivity prediction of deep shale gas [7].
Deep shale under high temperature and high pressure has different characteristics from medium-shallow shales. Currently, deep shale is mostly studied using the conventional testing methods for medium-shallow shales. Such methods cannot effectively reveal the differences between deep shale and medium-shallow shales, especially in porosity, permeability and mechanical properties. Previous studies investigated the porosity and permeability of deep shale through conventional ground static testing or in-situ experiment at confining pressure and normal temperature. According to the conventional ground static testing, with the increasing burial depth, the porosity and permeability of deep shale are comparable to those of medium-shallow shales due to the effect of formation overpressure for pore preservation [8]. According to the in-situ experiment at confining pressure and normal temperature, when the pressure rises to 50 MPa, the porosity and permeability of shale reduce significantly, and the rock physical properties vary depending upon lithofacies [9]. Some scholars compared and analyzed the changes in mechanical parameters of deep shales when the single factor of confining pressure changes, and they indicated that high confining pressure reduces shale brittleness [10-11], thus disabling the evaluation of deep shale brittleness based on elastic modulus and Poisson's ratio [12-13]. The impact of high temperature on the mechanical properties of deep shale has rarely been studied and is controversial. Some scholars believed that the microstructure of shale with rich organic matter and high clay content is easy to distort under high temperature, which may enhance the shale plasticity and deformability[14]. Other scholars indicated that the thermal expansion effect caused by high temperature is conducive to the opening of microfractures and the increase of rock brittleness [15]. These studies have played an active role in understanding the porosity, permeability and mechanical properties of deep shale under the coupling effect of temperature and pressure. However, the porosity/permeability and mechanical properties of shale under high temperature and high pressure and their mutual constraint mechanism have not been identified, which hinders the reservoir stimulation and reasonable evaluation of reserves/production of deep shale.
In this paper, the core samples of deep shale from the Silurian Longmaxi Formation in the Weirong and Yongchuan blocks of the southern Sichuan Basin were used for the porosity and permeability experiment and the triaxial compression and sound wave integration experiment at the temperature of 60-120 °C and the confining pressure of 10-70 MPa. Based on the experimental data, the porosity/ permeability and mechanical properties of deep shale under the temperature-pressure coupling effect were analyzed for their changes, and their mutual constraint mechanism and characteristics in different areas were discussed, with an aim to provide a basis for the reservoir evaluation, sweet spot selection, dynamic analysis of gas reservoir, and optimization of reservoir stimulation of deep shales.
1. Geological setting
The Weirong block is located between the southeast wing of Weiyuan structure and the Ziliujing underwater high, and the Yongchuan block is located on the Huayingshan structural belt as a whole. In both blocks, shales at the bottom of the Silurian Longmaxi Formation are deeper than 3500 m. The Longmaxi Formation shale was deposited after the Ordovician glacial age, generally in a deep-water shelf environment in the south of the Central Sichuan paleouplift (Fig. 1 ). In the Weirong block, the deep shale is buried at 3550-3880 m, with the pressure coefficient of 1.79-1.95. As the block is close to the provenance of the Central Sichuan paleouplift, the high-quality shale has a high content of carbonate minerals, and is dominantly carbonate-bearing siliceous shale with carbonate lamination and strong reservoir heterogeneity. In the Yongchuan block, the deep shale is buried at 3700-4200 m, with the pressure coefficient of 1.7-2.1. As this block is farther from the Central Sichuan paleouplift than the Weirong block, the high-quality shale is dominated by siliceous shale with strong homogeneity.
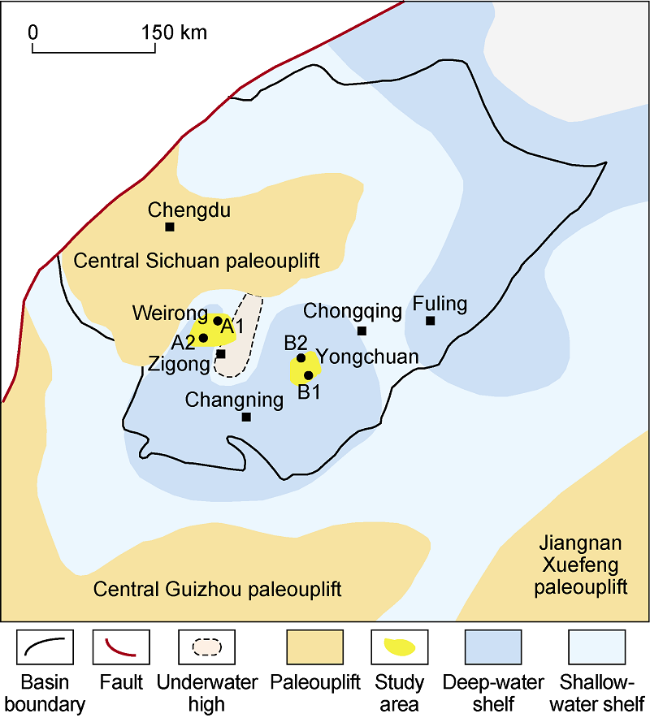
Fig. 1. Location of the study area and sedimentary facies of shale at the bottom of Silurian Longmaxi Formation. |
2. Samples and experiments
2.1. Porosity and permeability experiment at high temperature and high pressure
2.1.1. Sample information
The core samples taken from the carbonate-bearing siliceous shale of Longmaxi Formation in Well A1 in the Weirong block and the siliceous shale of Longmaxi Formation in Well B1 in the Yongchuan block were cut into 10 standard core plugs (Table 1 ).
Table 1. Basic parameters of shale samples in porosity and permeability experiment |
| Sample No. | Depth/m | TOC/% | Ro/% | Mineral content/% | Length/ mm | Diameter/ cm | Density/ (g·cm-3) | ||||
|---|---|---|---|---|---|---|---|---|---|---|---|
| Quartz | Clay | Calcite | Dolomite | Others | |||||||
| A1-1 | 3847.26 | 4.41 | 2.21 | 30 | 31 | 25 | 19 | 4 | 4.952 | 2.516 | 2.437 |
| A1-2 | 3847.50 | 4.41 | 2.93 | 27 | 29 | 24 | 17 | 3 | 2.932 | 2.516 | 2.554 |
| A1-3 | 3847.73 | 4.41 | 2.21 | 24 | 30 | 23 | 18 | 5 | 4.798 | 2.514 | 2.514 |
| A1-4 | 3847.87 | 4.41 | 2.93 | 26 | 29 | 22 | 19 | 4 | 4.818 | 2.514 | 2.531 |
| A1-5 | 3848.20 | 5.35 | 2.21 | 56 | 22 | 10 | 7 | 5 | 6.162 | 2.518 | 2.480 |
| B1-1 | 3857.33 | 2.83 | 3.37 | 43 | 41 | 1 | 5 | 10 | 4.386 | 2.520 | 2.559 |
| B1-2 | 3861.44 | 4.23 | 3.37 | 56 | 27 | 1 | 8 | 6 | 3.640 | 2.520 | 2.515 |
| B1-3 | 3864.72 | 7.83 | 2.99 | 58 | 23 | 4 | 9 | 10 | 3.324 | 2.518 | 2.499 |
| B1-4 | 3864.87 | 7.83 | 2.99 | 53 | 24 | 5 | 10 | 8 | 4.492 | 2.520 | 2.497 |
| B1-5 | 3865.64 | 5.08 | 2.99 | 44 | 17 | 12 | 18 | 9 | 3.452 | 2.522 | 2.530 |
2.1.2. Experimental equipment, experimental objective and scheme
The experiment was performed in Southwest Petroleum University using the pulse-decay-based experimental device, in accordance with the measurement of helium porosity and pulse decay permeability of shale (GB/T 34533-2017). The experimental device is composed of upstream and downstream bottles, a triaxial core holder, a confining pressure pump and a pressure sensor.
The purpose of the experiment is to simulate the different changes of porosity and permeability of deep shale under the formation temperature and pressure at the burial depth of 1500-4500 m. At the bottom of Longmaxi Formation in the Weirong block, the formation temperature gradient is 2.8-3.0 °C/100 m, and the measured formation temperature is 125-134 °C; the pressure gradient is 1.9-2.1 MPa/100 m, and the measured formation pressure is 68.69-77.48 MPa. In the Longmaxi Formation in the Yongchuan block, the formation temperature gradient is 2.70 °C/100 m, and the measured formation temperature is 134 °C; the pressure gradient is 1.8-1.9 MPa/100 m, and the measured formation pressure is 70 MPa. Accordingly, the experiment was completed under seven groups of temperature and pressure conditions: (10 MPa, 60 °C), (20 MPa, 70 °C), (30 MPa, 80 °C), (40 MPa, 90 °C), (50 MPa, 100 °C), (60 MPa, 110 °C), and (70 MPa, 120 °C), corresponding to the burial depths of 1500, 2000, 2500, 3000, 3500, 4000 and 4500 m, respectively. The temperatures were calculated according to the burial depth and formation temperature gradient (2.8-3.0 °C/100 m). The pressures were obtained by multiplying the formation pressure by the pressure coefficient which was determined as 1.0-1.7 (increasing with the burial depth) with consideration to the dynamic change of the pressure coefficient in the deep burial-uplift stage. For example, when the burial depth is 3500 m, the calculated formation temperature is 98 °C, and the formation pressure is 50.4 MPa given the pressure coefficient of 1.5. The porosity and permeability (bedding permeability) of shale were measured by the helium method and the pulse permeability method. Before the experiment, the core plugs were checked, and the intact core plugs were selected and put onto the core holder. Then, the triaxial confining pressure and temperature were set to the designed values, and the relevant parameters measured during the experiment were recorded. These procedures were repeated until a cycle test with increasing and decreasing temperature and pressure conditions were completed to determine the core porosity and permeability.
2.2. Rock mechanics experiment at high temperature and high pressure
2.2.1. Samples
Two groups of samples taken from the carbonate-bearing siliceous shale of Longmaxi Formation in wells A1 and A2 in the Weirong block and the siliceous shale of Longmaxi Formation in Well B2 in the Yongchuan block were cut in the parallel direction to the bedding plane to prepare 10 core plugs (25 mm × 50 mm) (Table 2 ).
Table 2. Basic parameters of shale samples in rock mechanics experiment |
| Sample No. | Depth/m | Mineral content/% | Lithology | Experimental conditions | ||||
|---|---|---|---|---|---|---|---|---|
| Quartz | Clay | Calcite | Dolomite | Confining pressure/MPa | Temperature/ °C | |||
| A2-1 | 3706.84 | 45 | 27 | 9 | 12 | Carbonate-bearing siliceous shale | 30 | 80 |
| A2-2 | 50 | 100 | ||||||
| A2-3 | 70 | 120 | ||||||
| B1-1 | 3859.18 | 57 | 29 | 1 | 6 | Siliceous shale | 30 | 80 |
| B1-2 | 50 | 100 | ||||||
| B1-3 | 70 | 120 | ||||||
| B2-1 | 4092.17 | 58 | 22 | 5 | 9 | Siliceous shale | 10 | 60 |
| B2-2 | 30 | 80 | ||||||
| B2-3 | 50 | 100 | ||||||
| B2-4 | 70 | 120 | ||||||
2.2.2. Experimental equipment, objective and scheme
The experiment was performed in the Institute of Rock and Soil Mechanics, Chinese Academy of Sciences, using the XTR01-01 electro-hydraulic servo testing machine, in accordance with the standard for test methods of engineering rock mass (GB/T 50266-2013). The testing machine is composed of an axial compression system, a confining pressure system, a microcomputer control system, and an integrated sound wave monitoring device, and it can simulate uniaxial and triaxial rock loading and unloading under the formation conditions of high temperature and high pressure.
The purpose of the experiment is to analyze the influence of high temperature and high pressure on the mechanical properties of deep shale. The triaxial compression experiment was completed under four groups of temperature and pressure conditions: (10 MPa, 60 °C), (30 MPa, 80 °C), (50 MPa, 100 °C), (70 MPa, 120 °C), to obtain the stress-strain curves and characteristic parameters of shale samples with brittle failure at different temperatures and pressures, and dynamically monitor the P-wave velocity of each sample. Before the experiment, the sound wave was set as a sine wave with an excitation frequency of 300 kHz. The excitation period of the sound wave signal was 40 s, and a single P-wave signal was excited in each period, with a time interval of 1 s. The sound wave signal amplification factor was set to 40 dB, the P-wave noise threshold was 60 dB, and the sampling rate was 1 MSPS. In order to obtain more detailed sound wave signals, a low loading rate of 0.06 mm/min was used. In the experiment, the sound wave signal excitation system was started. Then, the sound wave acquisition system and test loading system were started. The test temperature was raised from room temperature (25 °C) to the designed value, and the test loading signal was recorded. Then the confining pressure was loaded from 0 MPa to the designed value, and the test loading signal was recorded. Finally, the compression experiment was conducted. In the process, the test loading signal was recorded with the axial pressure of 20 MPa as an interval, until the end of the test. The dynamic changes of samples from normal temperature to high temperature and from compaction to fracture during the experiment were captured. After the integrated experiment, the CT imaging technology was adopted to depict the three-dimensional morphology of fractures after the destruction of samples and calculate the proportion of the fracture volume.
3. Results
3.1. Porosity and permeability experiment at high temperature and high pressure
In the process of temperature and pressure loading, the porosity and permeability of core samples in two wells showed a nonlinear decrease from steep to gentle. When the pressure and temperature changed from 10 MPa and 60 °C to 30 MPa and 80 °C, the samples revealed the most sensitive changes of porosity and permeability, with a reduction of more than two-thirds of the total reduction in the experiment. As the temperature and pressure further increased, the porosity and permeability further decreased, but with a limited extent (Table 3 and Table 4 ). With the recovery of temperature and pressure, the porosity and permeability rose again, but remained lower than the measured values during the increase of temperature and pressure.
Table 3. Results of porosity and permeability experiment at high temperature and high pressure for shale samples from Well A1 |
| Confining pressure/ MPa | Temperature/°C | A1-1 | A1-2 | A1-3 | A1-4 | A1-5 | |||||||||
|---|---|---|---|---|---|---|---|---|---|---|---|---|---|---|---|
| Porosity/% | Permeability/ 10−6 μm2 | Porosity/% | Permeability/ 10−6 μm2 | Porosity/% | Permeability/ 10−6 μm2 | Porosity/% | Permeability/ 10−6 μm2 | Porosity/% | Permeability/ 10−6 μm2 | ||||||
| 10 | 60 | 7.06 | 3.12 | 8.08 | 0.94 | 4.05 | 1.28 | 3.57 | 0.69 | 4.87 | 3.69 | ||||
| 20 | 70 | 5.94 | 1.91 | 6.52 | 0.54 | 3.08 | 0.75 | 3.05 | 0.41 | 3.91 | 2.68 | ||||
| 30 | 80 | 5.53 | 1.15 | 5.74 | 0.33 | 2.65 | 0.46 | 2.71 | 0.19 | 3.60 | 1.55 | ||||
| 40 | 90 | 5.15 | 0.86 | 5.45 | 0.15 | 2.52 | 0.25 | 2.57 | 0.11 | 3.24 | 1.04 | ||||
| 50 | 100 | 4.96 | 0.68 | 5.06 | 0.08 | 2.36 | 0.14 | 2.34 | 0.08 | 3.09 | 0.58 | ||||
| 60 | 110 | 4.75 | 0.59 | 4.78 | 0.06 | 2.25 | 0.10 | 2.24 | 0.07 | 2.87 | 0.47 | ||||
| 70 | 120 | 4.66 | 0.41 | 4.59 | 0.05 | 2.16 | 0.07 | 2.15 | 0.05 | 2.76 | 0.27 | ||||
| 60 | 110 | 4.69 | 0.42 | 4.64 | 0.05 | 2.19 | 0.08 | 2.20 | 0.05 | 2.80 | 0.28 | ||||
| 50 | 100 | 4.77 | 0.47 | 4.72 | 0.06 | 2.24 | 0.08 | 2.28 | 0.05 | 2.89 | 0.30 | ||||
| 40 | 90 | 4.85 | 0.49 | 4.87 | 0.08 | 2.31 | 0.10 | 2.42 | 0.05 | 3.00 | 0.43 | ||||
| 30 | 80 | 4.96 | 0.60 | 5.01 | 0.10 | 2.42 | 0.11 | 2.48 | 0.07 | 3.20 | 0.59 | ||||
| 20 | 70 | 5.19 | 0.80 | 5.36 | 0.14 | 2.49 | 0.16 | 2.57 | 0.08 | 3.39 | 0.84 | ||||
| 10 | 60 | 5.54 | 1.14 | 5.93 | 0.22 | 2.80 | 0.28 | 2.79 | 0.11 | 3.72 | 1.47 | ||||
Table 4. Results of porosity and permeability experiment at high temperature and high pressure for shale samples from Well B1 |
| Confining pressure/ MPa | Temperature/°C | B1-1 | B1-2 | B1-3 | B1-4 | B1-5 | |||||||||
|---|---|---|---|---|---|---|---|---|---|---|---|---|---|---|---|
| Porosity/% | Permeability/ 10−6 μm2 | Porosity/% | Permeability/ 10−6 μm2 | Porosity/% | Permeability/ 10−6 μm2 | Porosity/% | Permeability/ 10−6 μm2 | Porosity/% | Permeability/ 10−6 μm2 | ||||||
| 10 | 60 | 3.31 | 9.10 | 3.25 | 3.43 | 4.06 | 6.26 | 4.72 | 0.11 | 4.10 | 5.09 | ||||
| 20 | 70 | 2.38 | 5.69 | 2.61 | 2.51 | 3.04 | 2.71 | 3.86 | 0.08 | 2.63 | 2.23 | ||||
| 30 | 80 | 1.87 | 3.05 | 1.97 | 1.69 | 2.59 | 1.62 | 2.96 | 0.06 | 1.83 | 1.02 | ||||
| 40 | 90 | 1.64 | 2.00 | 1.73 | 1.22 | 2.28 | 1.27 | 2.54 | 0.04 | 1.65 | 0.52 | ||||
| 50 | 100 | 1.53 | 1.07 | 1.63 | 0.79 | 2.05 | 1.04 | 2.40 | 0.03 | 1.41 | 0.38 | ||||
| 60 | 110 | 1.37 | 0.79 | 1.54 | 0.65 | 2.00 | 0.77 | 2.24 | 0.02 | 1.31 | 0.23 | ||||
| 70 | 120 | 1.29 | 0.48 | 1.49 | 0.49 | 1.86 | 0.60 | 2.13 | 0.02 | 1.19 | 0.13 | ||||
| 60 | 110 | 1.30 | 0.49 | 1.51 | 0.52 | 1.88 | 0.62 | 2.17 | 0.02 | 1.23 | 0.14 | ||||
| 50 | 100 | 1.37 | 0.54 | 1.53 | 0.53 | 1.91 | 0.73 | 2.20 | 0.02 | 1.32 | 0.15 | ||||
| 40 | 90 | 1.46 | 0.69 | 1.58 | 0.54 | 1.99 | 0.76 | 2.27 | 0.02 | 1.40 | 0.16 | ||||
| 30 | 80 | 1.52 | 0.89 | 1.73 | 0.63 | 2.07 | 0.81 | 2.37 | 0.02 | 1.46 | 0.21 | ||||
| 20 | 70 | 1.73 | 1.14 | 1.96 | 0.71 | 2.34 | 1.11 | 2.57 | 0.03 | 1.61 | 0.34 | ||||
| 10 | 60 | 1.99 | 1.75 | 2.42 | 1.05 | 2.79 | 2.25 | 2.97 | 0.04 | 1.97 | 0.84 | ||||
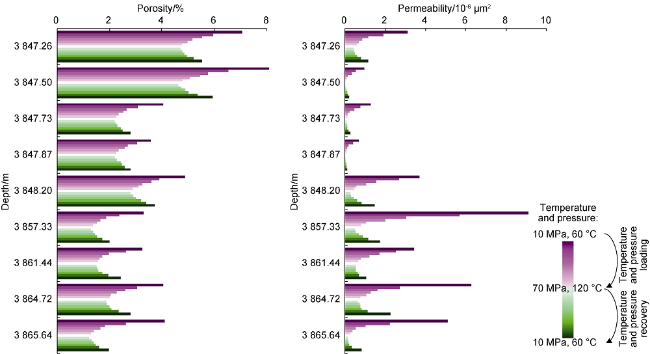
With the increase of temperature and pressure, the porosity and permeability of deep shale samples from Well A1 in the Weirong block decreased nonlinearly. When the temperature and pressure went up to the maximum values (120 °C and 70 MPa), the porosity and permeability reached the minimum (Fig. 2 ). The shale samples at different depths demonstrated a reduction of porosity by 34%-47%, with an average of 41%, and a reduction of permeability by 87%-95%, with an average of 92%. As the temperature and pressure recovered to 60 °C and 10 MPa, the porosity and permeability recovery curves showed obvious "hysteresis", that is, the porosity and permeability are lower than the initial values; the porosity recovery rate was 69%-78%, and the permeability recovery rate was 16%-40%. During temperature and pressure loading of deep shale samples from Well B1 in the Yongchuan block (Fig. 3 ), the shale samples at different depths demonstrated a reduction of porosity by 54%-71%, with an average of 59%, and a reduction of permeability by 85%-97%, with an average of 91%. When the temperature and pressure decreased to 60 °C and 10 MPa, the porosity recovery rate was 48%-74%, and the permeability recovery rate was 17%-36%.
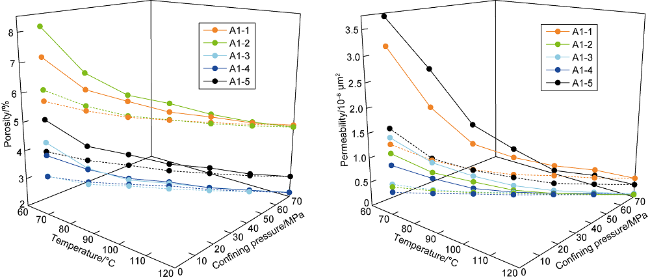
Fig. 2. Variation of porosity and permeability with temperature and pressure for deep shale samples from Well A1 (dotted lines indicate the recovery curves of porosity and permeability when temperature and pressure decrease). |
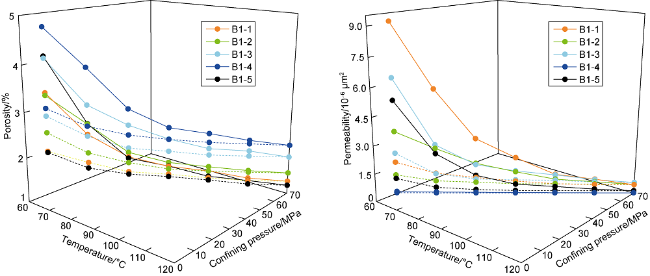
Fig. 3. Variation of porosity and permeability with temperature and pressure for deep shale samples from Well B1 (dotted lines indicate the recovery curves of porosity and permeability when temperature and pressure decrease). |
3.2. Rock mechanics experiment at high temperature and high pressure
According to the triaxial compression-sound wave integration experiment, with the increasing temperature and pressure, the compressive strength, strain and pre-peak average P-wave velocity of deep shale samples showed nonlinear increase from steep to gentle, and the elastic modulus and Poisson's ratio fluctuated slightly, with unobvious change characteristics (Table 5 ). The CT scanning experiment revealed that the complexity of fractures and the proportion of fracture volume decreased.
Table 5. Results of triaxial compression-sound wave integration experiment at high temperature and high pressure |
| Sample No. | Experimental conditions | Experimental results | |||||||
|---|---|---|---|---|---|---|---|---|---|
| Confining pressure/MPa | Temperature/°C | Compressive strength/MPa | Peak strain/% | Elastic modulus/GPa | Poisson's ratio | Pre-peak average P-wave velocity/(m·s-1) | Proportion of fracture volume/% | ||
| A2-1 | 30 | 80 | 215.2 | 1.49 | 11.62 | 0.181 | 3281.08 | 1.78 | |
| A2-2 | 50 | 100 | 240.6 | 1.71 | 12.59 | 0.174 | 3634.80 | 1.59 | |
| A2-3 | 70 | 120 | 266.5 | 1.83 | 13.02 | 0.190 | 3654.91 | 1.46 | |
| B1-1 | 30 | 80 | 277.3 | 1.65 | 17.02 | 0.192 | 3355.78 | ||
| B1-2 | 50 | 100 | 292.8 | 1.91 | 17.80 | 0.181 | 3557.08 | ||
| B1-3 | 70 | 120 | 300.9 | 1.99 | 17.74 | 0.183 | 3764.11 | ||
| B2-1 | 10 | 60 | 165.3 | 1.27 | 13.24 | 0.181 | 3310.11 | 2.30 | |
| B2-2 | 30 | 80 | 326.4 | 1.89 | 16.98 | 0.175 | 3738.01 | 2.21 | |
| B2-3 | 50 | 100 | 402.8 | 2.11 | 17.46 | 0.171 | 3920.78 | 2.04 | |
| B2-4 | 70 | 120 | 435.1 | 2.18 | 17.56 | 0.168 | 3940.86 | 1.97 | |
According to the stress-strain curve of shale samples from Well B2 in the Yongchuan block, when the temperature and confining pressure increase from 60 °C and 10 MPa to 80 °C and 30 MPa, the compressive strength and peak strain change the most, from 165.3 MPa and 1.27% to 326.4 MPa and 1.89%, by 2 times and 0.6%, respectively. When the temperature and pressure exceed 80 °C and 30 MPa, the increases of the compressive strength and peak strain slow down significantly. When the temperature and pressure reach 100 °C and 50 MPa, the pre-peak strain begins to exceed 2%, and the post-peak slope of the stress-strain curve becomes significantly gentler (Fig. 4 a). When the temperature and pressure reach 120 °C and 70 MPa, the compressive strength reaches the maximum (435.1 MPa), and the post-peak rock strength remains above 400 MPa. The shale samples from Well A2 in the Weirong block demonstrate the compressive strength of 215.2-266.5 MPa (Fig. 4 b), the maximum peak strain of 1.83%, and significantly gentler post-peak slope with the rise of temperature and pressure.
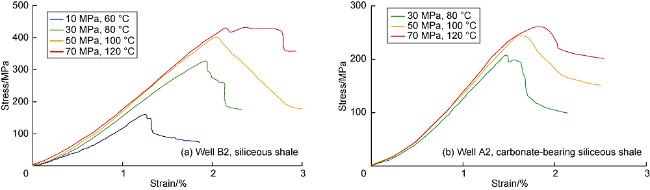
Fig. 4. Stress-strain curves of deep shale samples from triaxial compression experiment at high temperature and high pressure. |
The dynamic monitoring of P-wave velocity shows that the pre-peak average P-wave velocity of samples from Well B2 is 3310-3941 m/s (Fig. 5 ). With the increase of axial pressure, when the temperature and pressure are low, the P-wave velocity increases briefly and then decreases gradually (Fig. 5 a, 5b); when the temperature and pressure are high, the P-wave velocity tends to maintain a high value and then drops sharply (Fig. 5 c). According to the CT scanning images of fractures, when the temperature and confining pressure are low, the longitudinal splitting tensile fractures are dominant with a large number, forming a complex network with rough fracture plane (Fig. 6 a-6c). When the temperature is 80 °C and the confining pressure is 30 MPa, the proportion of fracture volume is 2.21%. With the increase of temperature and confining pressure, double shear fractures are dominant under stress (Fig. 6 d-6i), but the number of fractures is significantly reduced and the shear plane is relatively smooth. When the temperature and confining pressure are 120 °C and 70 MPa, the proportion of fracture volume is only 1.97%, reduced by 11%. Generally, the samples from Well B1 exhibit similar changes of mechanical properties to that from Well B2. Under the same temperature and pressure conditions, the siliceous shale samples from Well B1 have the compressive strength of 277.3-300.9 MPa, the peak strain of 1.65%-1.99%, and the pre-peak average P-wave velocity of 3356-3764 m/s, all lower than that of Well B2.
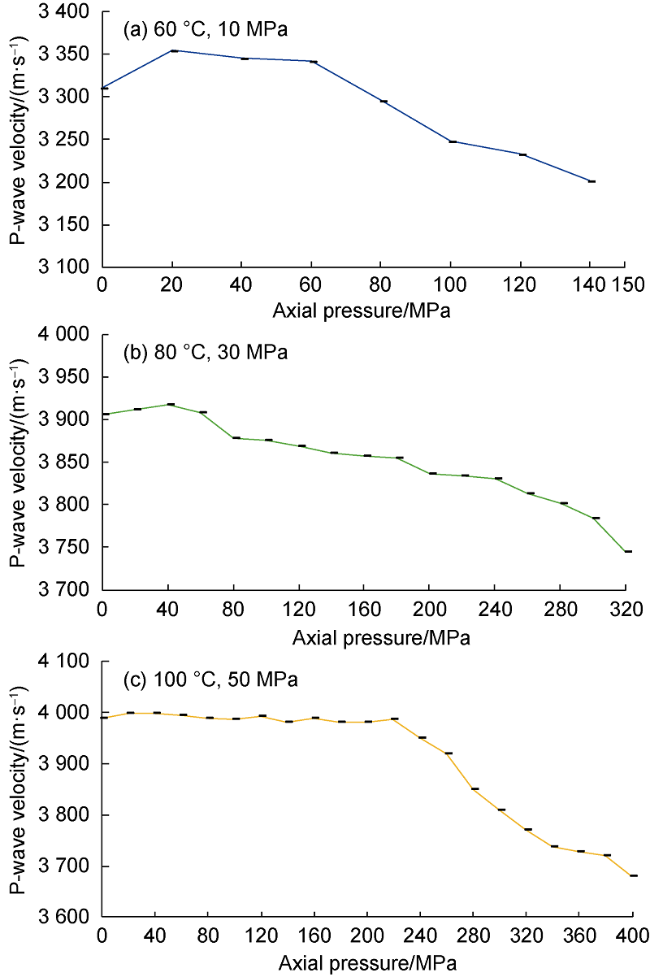
Fig. 5. Dynamic monitoring of P-wave velocity of siliceous shale samples from Well B2 in triaxial compression experiment at high temperature and high pressure. |
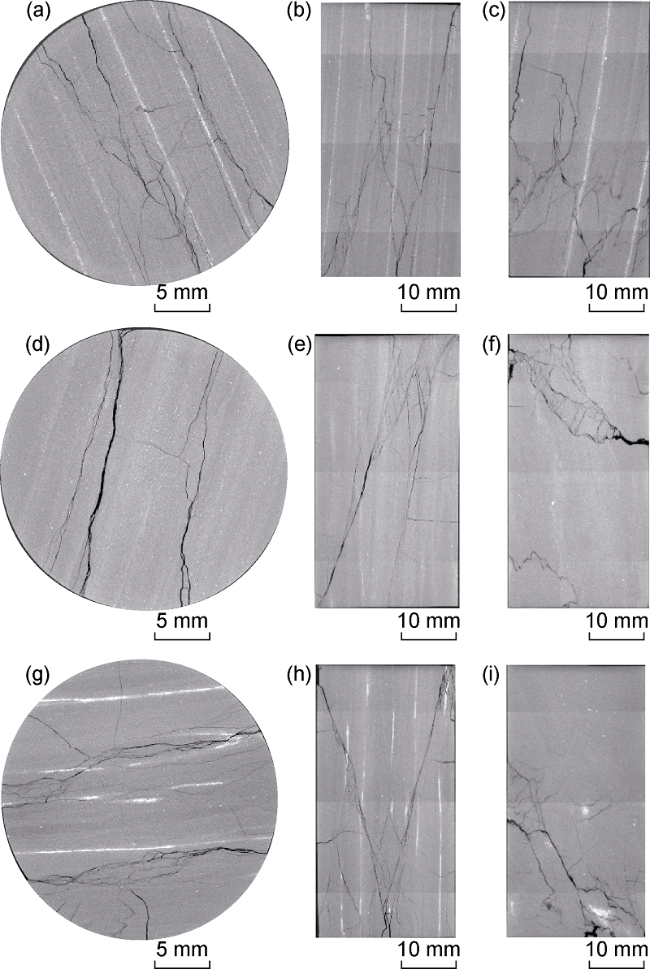
Fig. 6. CT scanning 3D views of siliceous shale after compression in Well B2. (a) Vertical view section, at 80 °C and 30 MPa; (b) Side view section, at 80 °C and 30 MPa; (c) Front view section, at 80 °C and 30 MPa; (d) Vertical view section, at 100 °C and 50 MPa; (e) Side view section, at 100 °C and 50 MPa; (f) Front view section, at 100 °C and 50 MPa; (g) Vertical view section, at 120 °C and 70 MPa; (h) Side view section, at 120 °C and 70 MPa; (i) Front view section, at 120 °C and 70 MPa. |
The average P-wave velocity of samples from Well A2 is 3281.08-3654.91 m/s. According to the CT scanning results, when the temperature and pressure are low, the splitting fractures are dominant (Fig. 7 a-7c); when the temperature and pressure are high, the main fractures have relatively large dip angles, and are mainly single shear fractures (Fig. 7 d-7i). The number of fractures is small and the fracture complexity is low. It can be seen that the branch fractures pinch out in the calcareous lamination, with flat and smooth fracture plane, and a proportion of fracture volume of 1.46%-1.78%.

Fig. 7. CT scanning 3D views of carbonate-bearing siliceous shale after compression in Well A2. (a) Vertical view section, at 80 °C and 30 MPa; (b) Side view section, at 80 °C and 30 MPa; (c) Front view section, at 80 °C and 30 MPa; (d) Vertical view section, at 100 °C and 50 MPa; (e) Side view section, at 100 °C and 50 MPa; (f) Front view section, at 100 °C and 50 MPa; (g) Vertical view section, at 120 °C and 70 MPa; (h) Side view section, at 120 °C and 70 MPa; (i) Front view section, at 120 °C and 70 MPa. |
4. Discussion
4.1. Factors affecting porosity and permeability of deep shale
4.1.1. Effect of experiment on porosity and permeability of deep shale
Compared with the experiment at normal temperature and normal pressure and the in-situ experiment at normal temperature, the porosity and permeability experiment at high temperature and high pressure can more accurately reflect the porosity and permeability of deep shale by simulating the actual geological environment of deep shale to realize a cycle experiment under increasing and then decreasing temperature and pressure conditions. Taking A1-5 sample as an example, when the initial temperature and pressure are 60 °C and 10 MPa, the porosity is 4.87% and the permeability is 3.69×10⁻⁶ μm2. When the temperature and pressure rise to 100 °C and 50 MPa (at the burial depth of approximately 3500 m), the porosity and permeability are 3.09% and 0.58×10⁻⁶ μm2, 37% and 84% lower than that under the initial temperature and pressure conditions. When the temperature and pressure further increase to 120 °C and 70 MPa (at the burial depth of 4000-4500 m), the porosity and permeability are 2.76% and 0.27×10⁻⁶ μm2, 43% and 92% lower than that under the initial temperature and pressure conditions. When the temperature and pressure decrease to 100 °C and 50 MPa (gradually to the current burial depth), the porosity is 2.89% and the permeability is 0.30×10⁻⁶ μm2, decreased by 6% and 48% respectively from 3.09% and 0.58×10⁻⁶ μm obtained for the first time under the same temperature and pressure conditions. The porosity and permeability corresponding to the temperature and pressure recovery process can better reflect the actual porosity and permeability of deep shale, as they are measured by reducing temperature and pressure to simulate the formation uplifting process after reaching greater temperature and pressure conditions.
The previous studies mainly measure the porosity and permeability by directly increasing the temperature and pressure to a certain temperature or pressure depending upon the sample depth [16-17], which are higher than the actual values and thus cannot accurately reflect the actual geological environment at high temperature and high pressure. It is recommended to adopt the porosity and permeability data obtained when the temperature and pressure are increased to the values at the maximum burial depth and then reduced to a certain temperature and pressure (at a certain buried depth), with consideration to the whole process of sedimentary tectonic evolution.
4.1.2. Limitation of temperature-pressure effect of rock mechanics on porosity and permeability of deep shale
High temperature and high confining pressure control the porosity and permeability of deep shale by changing its mechanical properties. Comparing the two processes of temperature and pressure increase and decrease, it is found that the recovery of porosity or permeability has obvious "hysteresis" (Figs. 2 and 3 ). The recovery rates of porosity and permeability are 48%-78% and 16%-40%, respectively, which reflects that there are both plastic deformation and elastic deformation in the rock during temperature and pressure loading [17]. The changing trend of porosity and permeability is obviously divided into two stages: the rapid reduction when the temperature and pressure change from 60 °C and 10 MPa to 80 °C and 30 MPa, and the slow reduction after the temperature and pressure further increase. The two stages reflect different deformation stages in the rock. The rapid reduction stage represents that plastic deformation dominantly occurs in the rock, which is mainly caused by the closure of organic pores, clay mineral pores and microfractures (e.g. structural microfractures and minor diagenetic shrinkage fractures) under pressure. The slow reduction stage represents that elastic deformation occurs dominantly, where brittle mineral pores (e.g. intergranular pores, intragranular dissolution pores, and pyrite intercrystalline pores) and rock skeleton particles are compressed. In shale, organic pores and clay mineral pores account for a large proportion of the total porosity. They have a good connectivity with microfractures and serves as the main flow pathways in shale. Porosity and permeability decrease significantly in the plastic deformation stage, and are difficult to recover after temperature and pressure increase, resulting in the "hysteresis" in the stage of porosity and permeability recovery. Under the protection of brittle mineral particles, brittle mineral pores are less affected by compaction. Under the condition of high temperature and high pressure, the deep shale reveals less reduction and higher recovery rate of porosity than that of permeability. Such pores have poor connectivity and small contribution to permeability, so the permeability reflects obvious reduction and low recovery rate.
According to the in-situ experiment at normal temperature, when the confining pressure increases to 50 MPa, the porosity and permeability of shale samples decrease by 15%-20% and 90%-95%, respectively [9]. According to the experiment at high temperature and high pressure, when the temperature and pressure rise to 100 °C and 50 MPa, the porosity and permeability of shale samples reduce by 40% and 85% on average, respectively. By contrast, the changes of porosity and permeability are generally consistent with the previous experiments. This indicates that the confining pressure is dominant when high temperature and high pressure change in a coupling manner, but the decreasing amplitude of porosity decreases by 20%-25% and the decreasing amplitude of permeability decreases by 10%-15% when both high temperature and high pressure are loaded, suggesting that temperature has an important and different impact on the stress sensitivity of porosity and permeability, that is, high temperature can aggravate the decrease of porosity and inhibit the decrease of permeability. Essentially, the content of organic matter and clay minerals in shale is high, therefore, with the increase of temperature, the rock plasticity increases [18-19], and the pores are more prone to deform by compression, leading to an increase in porosity reduction. When the temperature rises further, the thermal expansion of the rock skeleton particles intensifies. Under the high confining pressure, the rock cannot expand freely to generate thermal stress. The total pore space does not change significantly due to the small change in the total volume of the rock. However, the outward thermal stress causes the bedding plane in the shale to reopen or new fractures to be generated along the bedding and other weak surfaces. Conclusively, high temperature leads to enhanced compaction, which has a great impact on porosity, but inhibits the reduction of permeability along the bedding plane, making the shale permeability reduction decrease with the increase of temperature and confining pressure.
Obviously, the reservoir space of deep shale under the actual geological conditions is smaller than that recognized so far. As porosity is positively related to the free gas content in shale, and high temperature facilitates the reduction of porosity, which will inevitably lead to the change of total gas content and gas occurrence characteristics in deep shale, the theoretical value of shale gas content and its absorbed/free ratio need to be further studied depending upon the size and change of pore volume under high temperature and high pressure conditions [20]. Under the action of high temperature, the deep shale still maintains a certain flow capacity. Conventional fixed pore compression coefficient cannot objectively predict the permeability of deep shale [21]. It is necessary to consider the change of pore volume and permeability caused by rock deformation under the influence of temperature-pressure coupling, and further optimizes the prediction method and model of physical properties of deep shale.
4.1.3. Control of lithofacies and mineral composition difference on porosity and permeability of deep shale
Different lithofacies and mineral components control to a certain extent the absolute values of porosity and permeability and the variation of porosity and permeability with temperature and pressure. Compared with the Yongchuan block, the deep shale in the Weirong block is shallower, with higher porosity but smaller permeability (Fig. 8 ). This is attributed to three aspects. First, calcareous shale contains high contents of dolomite and calcite, and more developed dissolution pores in mineral particles, which contributes to the increase of porosity. Secondly, the dissolution pores are scattered, with poor connectivity with other pores/fractures, thus having limited contribution to permeability. Third, the dolomite and calcite particles are numerous, and very different from microcrystalline quartz particles in radius. The stacking of mineral particles with very different radii increases the porosity between particles to a certain extent, but demonstrates the poor connectivity and lower permeability than the case with uniform particle size. Shales with different lithofacies and mineral components have different porosity and permeability sensitivity to temperature and pressure. Previous studies show that the silica in high-quality shale of Longmaxi Formation in the Sichuan Basin is mainly biogenic, which is conducive to the formation of rigid support framework [22]. For the siliceous shale of A1-5 sample in the Longmaxi Formation (with a depth of 3848.2 m), the porosity and permeability reach the maximum values of this group of samples, and the porosity and permeability change rates are small when the temperature and pressure conditions change, indicating that siliceous shale with a quartz content of more than 50% has both good original physical properties and strong compressive resistance of siliceous framework compared with calcareous shale. For the clay shale of B1-1 sample (with a depth of 3857.33 m) and the carbonate-bearing siliceous shale of B1-5 sample (with a depth of 3865.64 m), as the plasticity is stronger than that of siliceous shale, the porosity and permeability are most affected by temperature and pressure. At 70 MPa and 120 °C, the porosity decreases by 61%-71%, and the permeability decreases by 95%-97%; when the temperature and pressure return to the initial values, the porosity and permeability show the lowest recovery degree. Therefore, siliceous shale has the best reservoir capacity. With the increase of calcareous and clay minerals in shale, the compaction resistance of shale decreases. Under the condition of high temperature and high pressure, the porosity and permeability retention capacity of deep shale are weakened, and the reservoir performance is inferior to that of siliceous shale [23].
Fig. 8. Porosity and permeability changes of shale samples from Well A1 and Well B1 in the study area under high temperature and high pressure conditions. |
Affected by high temperature and high pressure, high- quality deep shale intervals need to have higher compaction resistance. Under the current engineering technology conditions, siliceous shale has good exploration and development potential. However, the clay shale with strong plasticity and weak compaction resistance has poor reservoir performance due to its high stress sensitivity under high temperature. When the temperature and pressure in the medium-shallow intervals are low, the clay shale can still maintain good porosity and permeability. Both the clay shale and the siliceous shale with the best reservoir performance can be considered as favorable development intervals, which have been confirmed by the development of the gas reservoir in the upper part of the Jiaoshiba anticline.
4.2. Factors influencing the mechanical properties of deep shale
4.2.1. Constraints of temperature-pressure effect of microscopic porosity and permeability on mechanical properties of deep shale
The rock deformation and failure is essentially the break of the microstructure. The change of shale microscopic porosity and permeability caused by high temperature and high pressure has a constraint on rock deformation, which is mainly reflected in three aspects. (1) The constraint on the formation of main fracture. As the wave velocity is more sensitive to the changes of microfractures and pores in the rock, the triaxial compression experiment at high temperature and high pressure integrated with the monitoring of P-wave velocity was conducted, for the first time, in this study, to dynamically reflect the control of microstructure on rock deformation fracture. Taking 3 samples of Well B2 as an example, when the temperature gradually rises from room temperature (25 °C) to the designed value, given no confining pressure, the porosity and permeability increase, the shale expands freely, and the P-wave velocity decreases. When the confining pressure is set to the designed value, because the cutting direction of the sample is parallel to the bedding, the microfractures show an obvious closing trend under the confining pressure, and the P-wave velocity recovers. When the axial pressure is loaded, for the shale samples with low temperature and low pressure, the internal microfractures of the rock are opened and grow faster, and the P-wave velocity starts to drop when the axial pressure is slightly higher than the confining pressure (Fig. 5 a, 5b); for the shale samples with high temperature and high pressure, the opening and expansion of microfractures are restrained, and the P-wave velocity tends to maintain at a high value (Fig. 5 c). When the axial pressure is increased to a certain critical value, the number of microfractures increases sharply, and the volume expands, forming a main fracture through the rock mass [24], and the P-wave velocity decreases rapidly. (2) The constraint on the macro-fracture type of rock. According to the CT scanning image after compression, the rock undergoes tensile fracture (Fig. 6 a-6c and Fig. 7 a-7c) and shear fracture (Fig. 6 d-6i and Fig. 7 d-7i) under low and high temperature and pressure conditions respectively. The final macro-fracture of rock is formed by the evolution of microfractures and pore expansion in the rock, that is, the tensile fracture of microfractures causes macroscopic tensile fracture, and the shear fracture of microfractures determines macroscopic shear fracture [24]. (3) The constraint on fracture propagation pattern. With the increase of temperature and pressure, the angle between the fracture plane and the bedding surface tends to increase greatly, and the development of fractures becomes worse and less complex. When the confining pressure is low, the internal cracks of the rock under the axial stress experience tensile fracture. Because the cracks in shale are mainly developed in the mechanical weak surface (bedding surface) with high mud content, the angle between the fracture plane and the bedding surface is small. In this case, the surface friction of the microfractures is small, and they are easy to expand, forming the most cracks (Fig. 6 a-6c and Fig. 7 a-7c). When the confining pressure is high, the resultant direction of confining pressure and axial stress forms an angle with the bedding plane. The microfractures with a certain angle with the bedding plane form shear expansion, leading to an increased angle between the fracture plane and the bedding plane. By contrast, the microfractures parallel to or with a small angle with the bedding plane are mostly difficult to close or expand, the crack development is poor, and the complexity of the macro-fracture is reduced (Fig. 6 d-6i and Fig. 7 d-7i).
Compared with the results of triaxial compression experiment at room temperature and high pressure, the mechanical properties of deep shale at high temperature and high pressure show significant differences. Considering the control of shale reservoir heterogeneity parallel to the bedding and in vertical direction on rock mechanics, the deep core samples also parallel to the bedding were selected for room-temperature triaxial compression experiment. According to the whole stress-strain curve, in the triaxial compression experiment at room temperature and high confining pressure, when the confining pressure changes from 0 MPa to 75 MPa, the compressive strength increases approximately linearly. At 75 MPa, the compressive strength is 250 MPa, and the peak strain is 1.25%. With the increase of the confining pressure, the elastic modulus increases significantly, while the Poisson's ratio decreases [25]. In the triaxial compression experiment at high temperature and high pressure, when the temperature and pressure exceed 80 °C and 30 MPa, the increase of the compressive strength decreases significantly with the temperature and pressure. When the confining pressure is 70 MPa, the maximum compressive strength affected by high temperature is 435 MPa, and the corresponding peak strain is 2.18% (Fig. 4 a), increased by nearly 1%. As for the deformation parameters, with the increase of temperature and pressure, the changes of elastic modulus and Poisson's ratio are small and the characteristics are not obvious. The main reason for this difference is that high temperature can significantly increase the plasticity of rock [18-19]. Under high confining pressure, the microfractures in the sample along the bedding direction are quickly closed to the limit, resulting in a significant reduction in the increase of compressive strength. At the same time, high compressive strength, high peak strain, elastic modulus and Poisson's ratio fluctuate only in a small range, which is a reflection of rock brittleness reduction due to high temperature. Clearly, under the experimental conditions close to the temperature and pressure of deep shale, the compressive strength of deep shale is doubled, indicating that a higher pump pressure is required to successfully realize the reservoir stimulation of deep shale compared with previous understanding. An increase of 1% in the strain means that during fracturing, the rock needs to be significantly deformed before new fractures are generated, which significantly increases the difficulty of fracturing to form new fractures, especially penetrating fractures, while natural fractures in shale will be opened and extended to become the main flow pathways for oil and gas. This indicates that for deep shale with large burial depth, strong plasticity and large absolute value of strain, the development of natural fractures largely determines the effect of reservoir stimulation.
4.2.2. Control of lithofacies and mineral composition on mechanical properties of deep shale
The temperature-pressure effect and brittle-ductile transition of rock mechanics of shales with different lithofacies are obviously distinct due to different mineral components [10]. Compared with siliceous shale, the carbonate-bearing siliceous shale is characterized by smaller pre-peak strain, lower compressive strength and lower average P-wave velocity (Fig. 4 and Table 5 ). The reason is that with the increase of carbonate mineral content, the rock hardness becomes lower and the compressive resistance becomes worse, making the brittle failure of the carbonate-bearing siliceous shale less difficult than that of the siliceous shale.
The CT scanning results show that when the temperature and pressure are low, the samples of different lithofacies form tensile fractures extending longitudinally, suggesting good brittleness characteristics (Fig. 6 a-6c and Fig. 7 a-7c). When the temperature and pressure exceed 80 °C and 30 MPa, the deep shale samples of different lithofacies show a transition from elastic-brittle to plastic-ductile mechanical state. Under the condition of high temperature and high pressure, the carbonate-bearing siliceous shale is mainly characterized by single shear fracture with larger dip angle, straight fracture plane and slim branch fractures (Fig. 7 d-7i). In contrast, the siliceous shale is dominated by double shear fractures with small dip angle, which penetrate the cross section longitudinally, with rough fracture plane, and high complexity (Fig. 6 d-6i). The proportion of fracture volume of the carbonate-bearing siliceous shale is significantly lower than that of the siliceous shale (Table 5 ). This is attributable to two aspects. First, under the compression load, the existence of particles in shale will induce and restrict the fracture growth and aggregation [26]. The carbonate-bearing siliceous shale contains calcite and dolomite transported from others. The embedding of these particles makes the microcrystalline quartz network discontinuous, resulting in low degree of brittle failure for the carbonate-bearing siliceous shale. Second, from the comparison of mineral components of high-quality shale (TOC larger than 4%) in the Weirong and Yongchuan blocks, it is known that the increase of carbonate minerals in Weirong occupies and inhibits the development space of quartz minerals, resulting in the low content of silica with good fracturability in mineral components. It has been proposed in previous studies that shale with high calcareous content has high fracture toughness and tensile strength. Although it has high brittleness index and is easy to be broken, its fracturability is lower than that of siliceous shale, so the rock cannot form complex fracture network after fracturing [27].
4.2.3. Control of high temperature and high pressure on deep shale fracturability
The porosity, permeability and mechanical properties of deep shale begin to change from steep to gentle under the temperature and pressure of 80 °C and 30 MPa, and the fracture deformation shows a clear transition from brittle to brittle-ductile. The reservoir depth corresponding to this temperature and pressure of 2000-2500 m is the critical depth for the transition from brittle to brittle-ductile of Longmaxi Formation shale. This critical depth is shallower than the depth of the brittleness bottom (2000-2700 m) obtained by He et al. [28] through the triaxial compression experiment at room temperature and high confining pressure, which indicates that the transition of deep shale to brittle-ductile is accelerated due to the increase of rock plasticity after high temperature is loaded additionally. The brittle-ductile property of shale reservoir can directly affect the effect of hydraulic fracturing. The enhanced ductility reduces the fracturability of deep shale and increases the difficulty of hydraulic fracturing [29]. Before fracture initiation, the rock needs to deform greatly and the fracture initiation pressure increases. After fracture initiation, the propagation and diversion of fractures become more difficult, and the activation effect of artificial fractures on natural fractures decreases, making it difficult to form complex fracture network. With the increase of rock plasticity, the fracture opening is smaller, it is more difficult for proppant to enter the artificial fractures, and the proppant may be embedded under the condition of high closure pressure. The complexity of fracture network is reduced and the fractures mainly change from tensile fracture to shear fracture. Based on the simulation of actual temperature and pressure conditions, this study reveals the changes of the mechanical parameters and fracture characteristics of shale with the depth, and provides basic data for the optimal design of fracturing stimulation technology, proppant materials, fracturing fluid formula, and dosage of deep shale reservoirs.
Compared with siliceous shale, the carbonate-bearing siliceous shale is low in both the difficulty of brittle failure and the sufficient degree of brittle failure, that is, under high temperature and high pressure conditions, fractures can be more easily initiated in the carbonate-bearing siliceous shale, but affected by high calcareous content, the complexity of fracture extension is low, and the fractures are easy to close in the late stage of fracture plane smoothing. If, with shale reservoir fracturing considered, shale brittleness is defined as the ability of shale to damage and generate complex fracture plane under a certain stress, then the brittleness and fracturability of shale in the Weirong block are obviously worse than those in the Yongchuan block. In the actual reservoir fracturing, the pump pressure required by the carbonate-bearing siliceous shale is relatively low. How to promote fracture extension and improve and maintain the complexity of fracture network for effectively increasing the number of flow pathways of reservoir is the key to optimize reservoir stimulation.
5. Conclusions
In the porosity and permeability experiment at high temperature and high pressure, high temperature can increase the rock plasticity and cause the thermal expansion effect between rock skeleton particles, so as to intensify the reduction of porosity and inhibit the reduction of permeability. It realizes a porosity reduction by 20%-25% and a permeability increase by 10%-15% from the values in the in-situ experiment at normal temperature. In the rock mechanics experiment at high temperature and high pressure, high temperature can intensify the inhibition of high confining pressure on the generation and expansion of microfractures in shale. It realizes a compressive strength of deep shale doubled and a peak stress increased by nearly 1% from the values in the triaxial compression experiment at normal temperature. Thus, effective stimulation of deep shale requires higher pump pressure.
The temperature-pressure effects of porosity/permeability and rock mechanics of deep shale are interrelated and mutually constrained. Under the condition of high temperature and high pressure, the porosity/permeability and mechanical properties of deep shale change fast first and then slowly. The fast change represents the plastic deformation in which organic pores and clay mineral pores are compressed and microfractures closed in the rock. The slow change indicates the elastic deformation in which brittle mineral pores and rock skeleton particles are compressed. The deformation stages and their characteristics constrain the changes of internal porosity and permeability characteristics, and microscopic porosity and permeability also constrain the deformation, fracture initiation and fracture expansion under compression in deep shale.
Lithofacies and mineral components of deep shale have an important influence on porosity, permeability and mechanical properties. The shales of different lithologies are different in the difficulty of fracture initiation and the sufficient degree of brittle failure. Compared with siliceous shale, the carbonate-bearing siliceous shale is characterized by lower rock hardness, poorer compaction resistance, and stronger stress sensitivity of porosity and permeability. The carbonate-bearing siliceous shale is easier to crack under high pressure but harder to form complex fracture networks.