

Introduction
The paradigm of world energy has been fundamentally altered in recent years by rapid increase in natural gas and oil production from unconventional resources in tight formations such as shale and tight sandstone [1⇓-3]. In such tight formations, the unique characteristic of oil and gas production is its fast decline rate, which can be 60% or more of the initial production level in a well for the first year [4-5]. Abnormal pore pressure, in-situ stress field and other geological factors are found to play a much more important role in controlling oil and gas production in unconventional reservoirs than in conventional ones [6-7]. In a global perspective, abnormal pore pressure regimes formed mostly in association with shale dictate the ground water flow, govern the large-scale fluid circulation in sedimentary basins, and strongly influence the occurrence of natural and man-made earthquakes [8⇓-10]. Despite such importance of the knowledge of subsurface pore pressure in shales, its generation mechanism, occurrence, spatial and temporal dynamic change, and prediction remain inadequately understood.
Shale is traditionally the typical source and seal rock in the conventional petroleum system. Now it gradually becomes one of the primary unconventional reservoirs around the world and shows great exploration perspective with theoretical and technological innovations [11-12]. Key parameters controlling the accumulation and enrichment of shale gas include net shale thickness, total organic carbon (TOC) content, thermal maturity, porosity, brittle mineral content, pore-fracture system, and pressure [2,13⇓ -15]. Many techniques were developed to estimate these factors for shale gas evaluation [16]. However, the pressure estimated from current methods utilizing acoustic velocity extracted from well log or seismic data lacks accuracy for sweet spot prediction in shale reservoirs.
Identifying and predicting the spatial variation of pore pressure are thus crucial for economic and safe exploration and production of gas-bearing shale. Pore pressure is the pressure exerted by the fluids in the pore space of a porous rock. Abnormal pressure occurs when pore pressure is higher (overpressure) or lower (underpressure) than the hydrostatic pressure [17]. For shale gas reservoirs, overpressure normally indicates good preservation conditions; the pressure coefficient (the ratio of pore pressure to hydrostatic pressure) is often directly proportional to gas production and it is an essential parameter in evaluating high production zones [2,6,18]. Accurate estimation of overpressure formations is conducive to determine favorable targets of well-preserved shale gas. Pore pressure also strongly affects the development of natural pore-fracture network as well as the matrix permeability in shale reservoirs [19-20]. Different from hydraulic fractures propped artificially, the natural pore-fracture network in shale is weakly supported and very sensitive to changes in pore pressure that critically and dynamically influence the rock permeability, the production decline rate and the ultimate recovery. Pore spaces, particularly natural fractures, are open and enlarged when pore pressure increases, but compressed and closed by declined pore pressure [21]. Thus, porosity and permeability of gas-bearing shale are reduced significantly as the pore-fracture network closes with depleted pore pressure. In addition, the miscalculation of abnormal pressure may cause serious drilling incidents such as kicks, blowouts, stuck pipe, and loss of circulation [22].
Based on the effective pressure principle [23], methods for pressure prediction obtain pore pressure by subtracting effective pressure on the rock frame from total stress. Different approaches are proposed using pre-drill and post-drill seismic, drilling and well log data [24⇓⇓⇓⇓⇓⇓-31]. Acoustic velocity and resistivity logs were the first two well logs used for pore pressure prediction, by which Hottmann and Johnson established empirical relationships with pore pressure for Tertiary sediments in the Gulf Coast [24]. Later, many methods were developed for pore pressure prediction using different well log and drilling parameters [25⇓-27,30]. Among these methods, an empirical equation derived from sonic log by Eaton [25] has had wide application to estimate pore pressure over the years. Seismic data is extensively used for pore pressure prediction. Most existing approaches are based on methods such as Eaton [25] and Bowers [27] using a velocity-to-pore pressure transform [32]. Usually a normal compaction trend (NCT) is established from the inverted velocity data for reference to estimate pore pressure [28]. Instead of relying on the smooth NCT, pore pressure can be predicted from theoretical models considering the effect of known rock properties including mineralogy and porosity on velocity based on rock physics theories [31,33].
In addition to porosity, acoustic velocity is influenced by many other factors, such as mineralogy, fluid content, and pore structure. Based on the extended Biot theory, a simplified rock physics model was developed [34-35] to quantitatively estimate the variation of pore structure from sonic velocity. In this model, an effective parameter called frame flexibility factor (γ) is used as the pore structure indicator to present the effect of pore shape on elastic properties. This model has worked well for estimation of pore structure variation in many carbonate and siliciclastic sedimentary reservoirs in, for example, the Bab Basin in UAE [36], the Permian Basin in the United States [37], and the Bohai Bay Basin [38] and Sichuan Basin[39] in China. It has been successfully applied to both low- and high-porosity rocks. Here, this rock physics model will be used to investigate the pressure effect on the elastic properties of shales.
Using the aforementioned rock physics model, we further focus on the impacts of pressure on pore structure, as well as other controlling factors of acoustic velocity for the purpose of estimation of pore pressure in consolidated rocks such as gas-bearing shales. The variation of pore structure induced by pressure changes will be quantified using a derived relationship between the frame flexibility factor (γ) and pressure. The contribution of other factors on velocity-pressure relations will also be analyzed using laboratory measurements. The rock physics model thus developed considers the effect of pressure on both porosity and pore structure. It is applied with well logs and 3D pre-stack seismic data to estimate pore pressure and pressure coefficient for the Upper Ordovician Wufeng and Lower Silurian Longmaxi formations in the Sichuan Basin.
1. Regional geology
The study area lies between the Qiyueshan and Huayingshan fault zones, spanning high and steep tectonic belt of the eastern Sichuan Basin and low and steep tectonic belt of the southern Sichuan Basin [40-41] (Fig. 1 a, 1b). The Dingshan structure is mainly composed of a series of NE-trending and NNE-trending fault anticlines, controlled by the Qiyueshan fault zone [42-43]. The Jiaoshiba structure, which is separated from the Qiyueshan fault zone by depression, is a NE-trending fault anticline with little deformation in the middle part and large dip angle at the wings [42,44]. This study focuses on the Upper Ordovician Wufeng (O3w) and Lower Silurian Longmaxi (S1l) formations in the Dingshan and Jiaoshiba areas of the Sichuan Basin, China (Fig. 1 c).

Two global transgressions in the period from Late Ordovician to Early Silurian resulted in a large area of low-energy and anoxic depositional environment, promoting the generation of the Wufeng and Longmaxi shales [42,46]. From the bottom to the top, the depositional environment of the Wufeng and Longmaxi formations transfers from the deep-water continental shelf to the shallow-water continental shelf. The lower part, O3w-S1l11 is dominated by siliceous shale and clayey siliceous shale, with abundant graptolite fossils. The middle part, S1l12 is composed of interbedded mudstone and silty shale. And the upper part, S1l13, consists of carbonaceous shale and mudstone (Fig. 1 c). Most of the core samples used in this study come from the middle and lower parts of the Wufeng and Longmaxi formations with high organic matter content[43⇓-45]. The pore structure is complicated in the target formation units, comprising organic matter hosted pores, interparticle pores, intraparticle pores, and micro-cracks [44,47]. The lower part of the Wufeng and Longmaxi formations (O3w-S1l11) is the main target interval for shale gas production in the study area, with an average thickness of 20-40 m [45].
2. Methods
2.1. Rock physics model
\[{{p}_{\text{e}}}=\text{ }{{p}_{\text{ls}}}-\alpha {{p}_{\text{p}}}\]
where α is the Biot coefficient and is related to dry bulk modulus. If α=1, the effective pressure equals to the difference between the lithostatic pressure (pls) and pore pressure (pp), i.e., pd=pls-pp. Normally, effective pressure is not equal to the differential pressure (pd).
Compressional wave velocity (Vp), shear wave velocity (Vs), and density (ρ) are expressed in the following formulas [48]:
$V_{p}=\sqrt{\frac{K+\frac{4}{3}\mu}{\rho}}$
$V_{s}=\sqrt{\frac{\mu}{\rho}}$
$\rho=(1-ø)\rho_{s}+ø\rho_{f}$
Density of the saturated rock is the function of porosity, mineral composition and pore fluid content (Eq. (4)). With the increase of pressure, porosity greatly reduces in unconsolidated sediments during compaction but has minimal change in consolidated rocks. For rocks in the shallow part of the Earth’s crust, mineralogical variation with pressure can be neglected, compared with the pressure effects on other rock properties, such as pore fluid. The fluids within pore spaces can change greatly in both composition and physical phases with different pressure and temperature conditions [49].
In Eqs. (2) and (3), bulk modulus (K) and shear modulus (μ) also change with pressure, in addition to density. Therefore, the relations between acoustic wave velocities and pressure are much more complicated than that can be approximated by simple empirical equations.
Rock physics models have been developed to study changes of elastic moduli with pressure [50⇓⇓-53]. The Hertz-Mindlin model is one of the most commonly used contact theories studying the elastic change of granular media with pressure [50-51]. The Hertz-Mindlin model is useful to obtain the effective elastic properties of unconsolidated sediments, but cannot be applied to consolidated rocks [54]. Effects of pore geometry on elastic moduli for low-porosity rocks were characterized by effective-medium rock physics models, such as that derived by Walsh [52]. Based on the scattering theory of acoustic waves, a rock physics model was developed to address the pore structure effect on elastic moduli and velocities by Toksöz and his co-authors [53]. A spectrum of aspect ratios is used to characterize the pressure effect on pore shape of isolated voids. The model limited to very low porosity rocks assumes that all pore spaces are isolated and non-interacting, and the change rate of the porosity is simply represented by the fractional change rate of aspect ratio. The Kuster-Toksöz model was further extended to a higher porosity range of a few percent using the differential effective medium (DEM) theory and others [55⇓-57] without establishing explicit relationships between aspect ratio and elastic moduli. These rock physics models are only appropriate for either unconsolidated sediments or low-porosity isolated cracks and pores. A better rock physics model valid for low-porosity and high-porosity rocks and sediments is desired for consolidated rocks with various pore-fracture networks in the intermediate range of porosity.
Here, a rock physics model combined with Gassmann’s equation is proposed to address the pressure effect on bulk modulus for consolidated rocks. Gassmann’s equation [58] was derived to relate the bulk modulus (K) in the closed system of a saturated rock in undrained condition to the frame bulk modulus (Kd) in the open system of the rock in drained condition and the bulk modulus of the saturating pore fluid, assuming that the rock is homogeneous and isotropic with completely connected pore space. The frame (dry) bulk modulus refers to that of the incremental bulk deformation caused by the increase of confining pressure while allowing the free flow of pore fluids. Gassmann’s equation is commonly used to separate the effect of pore fluid from geomechanical pore structure effect on bulk modulus. The equations are as follows, where C=1/K:
A simplified rock physics model, an extension of the Biot theory of poroelasticity, quantitatively evaluates the change of dry bulk modulus with pore structure [34-35]. In this model, the frame flexibility factor (γ) is used effectively to indicate the average pore structure of a porous rock. Dry bulk modulus of a porous rock (Kd) in the Sun model can be written as the function of mineral components (Ks), porosity (ϕ), and pore structure (γ) shown below:
The frame flexibility factor (γ) depends less on porosity and shows a good relationship with aspect ratio and grain size [59-60]. Based on the analysis of the sensitive response of pore aspect ratio to pressure changes [61-62] and the extended analysis of the stress field around a finite hole in an elastic medium to an effective medium of a fractured porous rock [63], the dependence of γ on differential pressure can be written as:
where a is the average pore aspect ratio of the rock; p1 is the initial differential pressure (pd=1 MPa); γ1 and a1 are the γ and a values at initial differential pressure,respectively; γ1 and β can be obtained from the data measured at different pressures [59]; nk is an index that relates to the elastic moduli of the solid grains [64]; D is a parameter measuring specific grain contact area which is proportional to grain size [59].
During the compaction of a sedimentary layer, with the gradual thickening of the overlying sediments, the burial depth of the layer increases, and the confining pressure builds up, resulting in the consolidation of the loose sediments in that layer. Its pore volume decreases significantly with increasing pressure. After the stage of compaction, the sedimentary layer is consolidated and lithified with continuous application of overburden pressure and diagenesis, and the pore volume compresses further with the rock frame, although the overall rate of volume change is small. To count for the porosity change with pressure during and after compaction, a commonly used relation between pressure and porosity for compaction can be modified as the relation between the fraction of rock matrix (ϕs) (ϕs=1-ϕ) and pressure [65]:
Rewriting Eq. (7) and taking the natural logarithm on both sides, we have
When pore pressure equals to hydrostatic pressure, we refer the differential pressure as the normal differential pressure (pdh), and the corresponding Kd as the normal dry bulk modulus (Kn). Accordingly, following Eq. (11), the relation between Kn and pdh is
The normal differential pressure (pdh) can be calculated by
where ph is the hydrostatic pressure with a constant hydrostatic pressure gradient of 10.18 kPa/m.
Dividing Eq. (12) by Eq. (11) leads to
where 2/n=β+m.
Eq. (14) can be used to calculate the differential pressure from the dry frame modulus measured in laboratory or sonic and seismic data if Kn is known.
From the derivation of Eqs. (11), (12) and (14), it is easy to see that Kn can be written in the following form:
where Kn1 is the normal dry bulk modulus of the rock close to the surface condition (pdh=1 MPa). Kn1 and l can be treated as constant in a regional scale. In the study area, Kn1 and l are 7.5 GPa and 0.54, respectively.
Based on the differential pressure obtained from Eq. (14) and a known pls, pore pressure (pp) and pressure coefficient (pc) can be further calculated by
2.2. Horizontal stresses and lithostatic pressure
The in-situ stress field consists of both vertical and horizontal stresses. Depending upon the in-situ stress field in a region, the horizontal stresses can be very important in calculation of the lithostatic pressure to obtain the pore pressure using Eq. (16). The vertical stress, or overburden pressure (pov), usually is only related to the combined weight of the overlying rock matrix and fluids in the pore space, and it can be obtained by integrating the gravity over depth z as in the following equation [65]:
Due to the variation of formation density in a small range, the vertical stress presents a trend of approximately linear increase with the depth.
Different from the linear relationship between overburden pressure and depth, the horizontal stress is more complex and relates to the formation pressure system and tectonic features, and its distribution is regionally specific [7,66 -67]. The ratio of the average horizontal stress to the overburden pressure called lateral stress coefficient (k) can be expressed as [68]:
Previous studies show that k is not a constant, but varies with depth [68]. The pattern is mostly consistent in a region, that is, the average horizontal stress and overburden pressure have a stable relation with depth. An empirical relation between k and depth z is derived for the study area as follows:
where A and B are empirical parameters varied with specific area.
The lithostatic pressure can then be calculated by the following equation using the overburden pressure as:
2.3. Pore pressure estimation from seismic data
The aforementioned equations can be readily applied to estimate pore pressure when borehole well log data are available. In order to apply the proposed method to seismic data, it is necessary to simplify the relation between dry bulk modulus and differential pressure and extract a minimal set of petrophysical parameters from seismic data. Acoustic measurements from tight sandstones [69] show that, Vp increases sharply only when water saturation changes from 90% to 100%, whereas Vp only slightly changes when gas saturation changes from 100% to 10%. This means that P-wave velocity is sensitive to the existence of gas but the dependence of Vp on gas saturation (10%-100%) is weak. For a gas reservoir unit, Eq. (14) can be approximated as:
Pre-stack seismic inversion can then be used to obtain Vp, Vs, and density volumes, from which the bulk modulus volume in Eq. (22) is derived for prediction of three-dimensional pore pressure distribution [70].
3. Data analysis and interpretation
In this section, the controllig factors on velocity-pressure relations are analyzed using laboratory measurements with a focus on differentiating the impact of porosity and pore structure on elastic properties under varying pressure. Quantitative understanding of dynamic changes of frame flexibility factor (γ) with effective pressure from measurement data analysis helps to gain confidence in using the proposed rock physics model for pore pressure estimation. The effect of horizontal stress on lithostatic pressure is then investigated and a relation between lateral stress coefficient and depth is obtained in the Dingshan area to calculate lithostatic pressure. The proposed rock physics model is finally applied for pore pressure estimation to well log and 3D pre-stack seismic data in the Dingshan area.
In this analysis, we will integrate core and well log data with seismic data. Laboratory core measurements on 35 dry samples from the Dingshan and Jiaoshiba areas involve mineralogy, TOC, porosity, density, and ultrasonic data measured at six differential pressures (10, 20, 30, 40, 50 and 55 MPa). Laboratory stress measurement was provided for 11 samples from the Dingshan area. Conventional, multipole array acoustic and elemental log data were obtained from three wells in the Dingshan area. Other data include pressure buildup testing data, mud weights and production data, as well as high-quality 3D pre-stack seismic data of the Dingshan area.
3.1. Analysis of controlling factors on velocity-pressure relations using core data
The velocity-pressure or modulus-pressure relation is affected by many factors, each of which needs to be considered separately. Compared with samples from the Wufeng and Longmaxi formations, which consist of various minerals and complex pore-fracture networks with a wide range of porosity, the low-porosity Casco granite sample used by Nur for laboratory measurement of elastic wave velocities at different pressures [71-72] is among the best to demonstrate the prominent effect of pore structure and fluid on acoustic velocity under pressure. The Casco granite sample has a total porosity of 0.7% (0.5% crack porosity and 0.2% pore porosity), mineral density of 2.6 g/cm3, and average grain diameter of 5 mm[72]. Compressional and shear wave velocities in dry and saturated conditions were measured at differential pressures varying from 2 MPa to 500 MPa [71]. Because the porosity is low and cracks are abundant in this sample, the sensitive response of geometrical factors, especially aspect ratio to pressure change can be delineated clearly, whereas the change of porosity with pressure is negligible. This example illustrates the typical phenomena that the closure of cracks and changes in pore structures significantly affect the acoustic velocity with incremental pressure, especially in low-porosity micro-cracked rocks [61-62].
In Fig. 2 , acoustic velocities and elastic properties of the Casco granite sample with 0 and 100% water saturation are shown versus differential pressure. The impact of fluid content on acoustic waves is more obvious when the pressure is less than 100 MPa. When the water saturation is 100%, the P-wave velocity and bulk modulus are substantially higher than those of dry rock samples and increases more gently with incremental pressure, whereas the S-wave velocity and shear modulus have no significant difference. This fact implies that dry bulk modulus derived from laboratory measurement or the frame bulk modulus calculated using the Gassmann’s equation should be used to improve the sensitivity of the model to pressure and so to increase the accuracy of pressure estimation from acoustic or seismic measurements, provided that the discrepancy, where it exists, between dry bulk modulus and Gassmann-derived frame bulk modulus can be remedied properly.
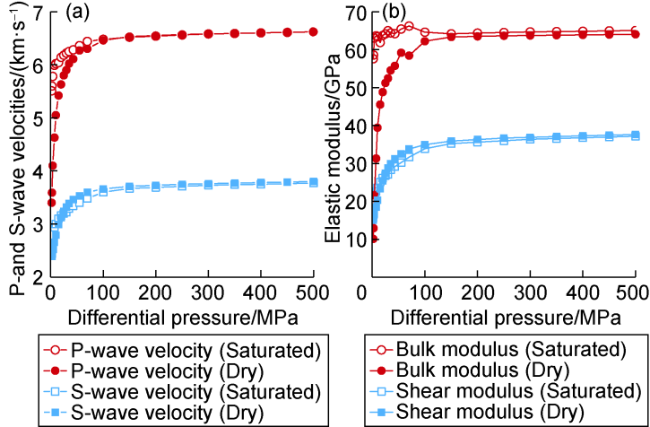
Fig. 2. Variation of (a) acoustic wave velocities and (b) elastic moduli with differential pressures of the Casco granite sample. |
Although the total porosity is only less than 1% and its change with pressure is neglibile, the micro-cracks in the Casco granite sample result in extremely low velocities at low pressures. Micro-cracks are gradually closed with incremental pressure, leading to a rapid Vp increase of 100% and a rapid Kd increase of 516%. The increase in P-wave velocity and dry bulk modulus is the greatest as pressure increases from 2 MPa to 100 MPa and has little change after 100 MPa. The dramatic increase of velocities and elastic moduli under a wide range of incremental pressure rather simply follows the change of pore structure with pressure as described in Eqs. (7) and (8). Frame flexbility factor (γ) indicating the effect of pore structure on Kd, varies greatly in this low-porosity sample (Fig. 3 ). γ decreases from 264.8 to 6.2 as differential pressure varies from 2 MPa to 100 MPa and reaches 2.0 at 500 MPa. The variation of pore structure caused by pressure changes is quantitatively represented by the γ-pd relation (Eq. (8)) as shown in Fig. 3 .
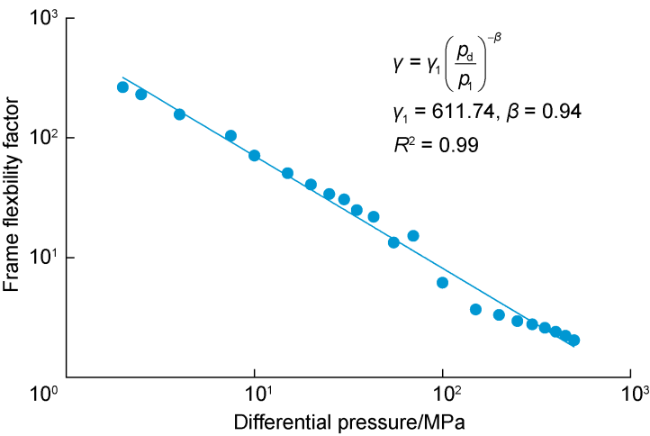
Fig. 3. Frame flexibility factor (γ) versus differential pressures of the Casco granite sample. |
The Casco granite sample illustrates the salient effect of pore structure and fluid content on pressure-velocity relations for consolidated rocks, especially for low-porosity rocks. In general, porosity also plays a significant role on velocity changes. For any porosity, the effect of pore structure on elastic properties is the most prominent when differential pressure is low. Therefore, the γ-pd relation in Eq. (8) should not be used alone for pore pressure prediction in practical applications. Instead, it has to be used with Eq. (7) to take into account of both the porosity and pore structure effect on bulk modulus.
Further analysis of the major factors controlling elastic parameters was conducted using the laboratory measurements under different pressures (10-55 MPa) on 35 dry samples collected from the Wufeng and Longmaxi formations in the Dingshan and Jiaoshiba areas. Clay (mostly illite), quartz, and calcite are three dominant minerals in the target formations (Fig. 4 ). Kerogen has similar density and acoustic properties to pore fluid, so the porosity discussed here is a combination of pore volume and TOC content.
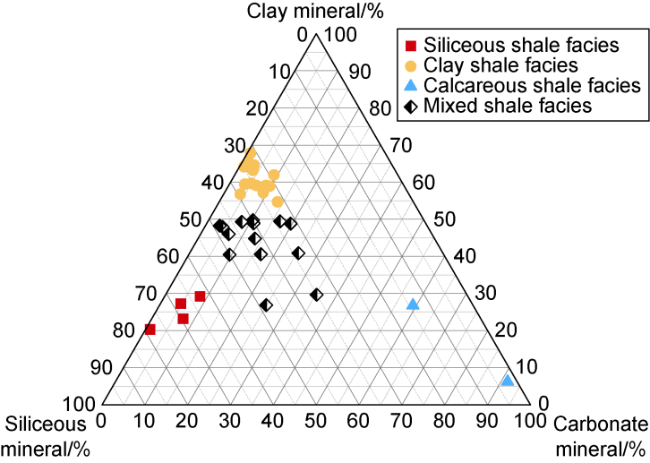
Fig. 4. Lithological ternary diagram of shale samples from Wufeng and Longmaxi formations. |
As illustrated in Fig. 5 , the dry bulk modulus (Kd) increases with incremental pressure and scattered at a given porosity and pressure. Fig. 5 a shows the variation of Kd with differential pressure from 10 to 55 MPa. Fig. 5 b shows the relation between Kd and porosity at 10 MPa. All samples displayed in these figures are colored by frame flexibility factor (γ) at corresponding pressure, which indicates the effect of pore structure on acoustic velocity.

Fig. 5. Variations of dry bulk modulus and frame flexibility factor (γ) with differential pressure and porosity. (a) Kd versus differential pressure increasing from 10 MPa to 55 MPa. Sample A (Red Curve) and Sample B (Blue Curve); (b) Kd versus porosity at 10 MPa; (c) γ versus differential pressure for samples A and B. γ values are colored. |
These 35 samples are divided into two categories according to γ value. For samples with γ>5, the porosity is relatively small, mostly less than 10%. For samples with γ<5, the porosity range is wide (4%-18%). For a given pressure, the change of Kd for both two categories is mainly controlled by porosity. As Fig. 5 b shows, for high γ samples (mainly red and yellow dots), Kd decreases from 57 GPa to 30 GPa as porosity increases from 0.6% to 10%; for low γ samples (mainly blue dots), Kd decreases from 52 GPa to 39 GPa as porosity increases from 4% to 18%. Given the pressure and porosity, Kd values are inversely related to γ, due to the effect of different pore shapes on elastic deformation. For samples with porosity of around 5%, the Kd value differs by about 20 GPa as the result of γ increasing from 1 to 9. The larger the value of γ, the smaller average aspect ratio of the rock, which means that the rock contains more narrow pores and micro- cracks, resulting in low velocity. Frame bulk modulus Kd increases more sharply as γ reduces more drastically with pressure in samples containing micro-cracks than others, since pores with low aspect ratio are very sensitive to pressure changes and close first as pressure increases. The gradient of Kd change with pressure is related to the pore structure of the rock. In Fig. 5 c, the γ-pd relations for sample A and sample B are given with respective γ1 and β values. For samples A (low porosity, large range of γ variation) and B (high porosity, small range of γ variation), Kd values are similar at 10 MPa and vary differently with incremental pressure. For a rock sample of given porosity, Kd is influenced by both pore structure and lithology at lower pressure, whereas it is mostly by lithology at higher pressure.
In general, effect of pressure on bulk modulus and P-wave velocity is usually much greater in dry or partial saturation condition than in fully water-saturated condition. For any porosity and lithology, effect of saturation is more prominent at low differential pressure than at high differential pressure. At low differential pressure, cracks and fractures play more important role in controlling the frame (dry) bulk modulus Kd in low porosity rocks than in high porosity rocks, for any given lithology. At high differential pressure where cracks and fractures are closed, Kd is affected by porosity more than lithology.
3.2. Effect of horizontal stress on lithostatic pressure
Pore pressure needs to be calculated from the difference between lithostatic pressure and effective pressure for subsurface stress systems instead of considering the overburden pressure alone, especially in active tectonic settings such as in the Sichuan Basin. It is crucial to incorporate all the three stress components, one vertical and two horizontal stresses, into the computation of lithostatic pressure for a greater accuracy. The lateral stress coefficient (k), the ratio of average horizontal stress to vertical stress [68], is utilized to study the variation of horizontal stress in the Dingshan area. Integrating the laboratory measured stress data from 11 samples in the Dingshan dataset with the stress data measured for 112 core samples from 38 wells in the eastern Sichuan Basin by Fang and Feng [73], the variation of k with burial depth in the eastern Sichuan Basin area is analyzed to assess the importance of horizontal stress in the study area.
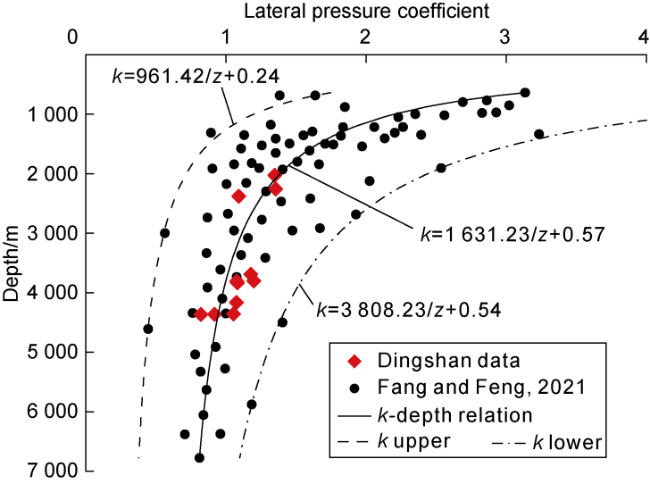
Fig. 6. Lateral pressure coefficient (k) versus buried depth in the eastern Sichuan Basin. |
3.3. Pore pressure estimation from well log data
The rock physics-based method was applied to three wells in the Dingshan area with mud weight and pressure buildup testing data to estimate pore pressure, providing calibration to further application of the proposed method to seismic data. The lithostatic pressure was calculated using overburden pressure and the lateral stress coefficient. In the Dingshan area, the lithostatic pressure is higher than the overburden pressure due to the large horizontal stress in the shallow formations. As depth increases, horizontal stress decreases, and the lithostatic pressure and the overburden pressure gradually tend to be similar. Figs. 7 and 8 show the pore pressure and pressure coefficient logs of wells DY4, DY5 and DY3 estimated from the lithostatic pressure and overburden pressure using the proposed model (Eqs. (14)-(17)). The values of parameter n in Eq. (14) are 1.0 and 0.8 for lithostatic and overburden pressure, respectively, in wells DY4 and DY5; and 1.0 and 1.0 in well DY3. In Fig. 7 and all other figures showing log curves, all depths are vertical depths. The pore pressure and pressure coefficient obtained from lithostatic pressure are higher than those predicted by using overburden pressure in three wells, especially in Well DY3. Because the target formation at Well DY3 is shallower, the lithostatic pressure here is highly affected by horizontal stress that is much higher than the overburden pressure compared with the same formation at wells DY4 and DY5. The difference between estimated results of deep wells DY4 and DY5 and shallow well DY3 reflects the importance of considering horizontal stress for pore pressure prediction, particularly for shallow wells or tectonically complex areas.

Fig. 7. Pore pressure estimated using lithostatic pressure and overburden pressure for wells (a) DY4, (b) DY5, and (c) DY3. |
To verify the proposed method, the estimated results are compared with pressure buildup testing and mud weight data (Figs. 7 and 8 ). Fig. 7 shows that the estimated pore pressure from lithostatic pressure agrees well with the reservoir pressure obtained from field pressure buildup test. The values of initial reservoir pressure in the Wufeng and Longmaxi formations are 54.77, 60.07 and 30.53 MPa, through the analysis of pressure buildup test for wells DY4, DY5, and DY3, respectively [74]. For the same target formation units, the pore pressure estimated from lithostatic pressure for wells DY4, DY5, and DY3 are 56.05, 60.66 and 31.77 MPa, respectively, which are close to the field measurements; whereas those from overburden pressure are 50.98, 56.83 and 28.10 MPa, respectively. The estimated pressure coefficients at the target depth in the three wells are compared with pressure coefficients from field measurement and mud weight data in Fig. 8 . The values of estimated pressure coefficient from lithostatic pressure are closer to the measured pressure coefficient in the target formations than those from overburden pressure. The pressure coefficients estimated from lithostatic pressure and overburden pressure are both lower than the mud weight values which are usually selected during drilling to be higher than the pore pressure and lower than the fracture pressure. Compared with the pressure coefficient estimated using overburden pressure, the pressure coefficient calculated from lithostatic pressure is closer to the mud weight data.

Fig. 8. Pressure coefficient estimated using lithostatic pressure and overburden pressure for wells (a) DY4, (b) DY5, and (c) DY3. |
For well log data, the dry bulk modulus can be calculated using Gassmann’s equation, but it could be difficult to apply to seismic inversion. Saturated bulk modulus, by contrast, can be extracted from seismic volumes [70], and is more appropriate for pressure estimation using seismic data. Fig. 9 shows the comparison of pore pressure and pressure coefficient estimated by dry bulk modulus using Eq. (14) and saturated bulk modulus using Eq. (22) for Well DY3. It can be seen that the replacement of dry bulk modulus with saturated bulk modulus does not significantly affect the accuracy of pressure estimation in the gas-bearing shale. Therefore, saturated bulk modulus can be used for pore pressure estimation from seismic data.
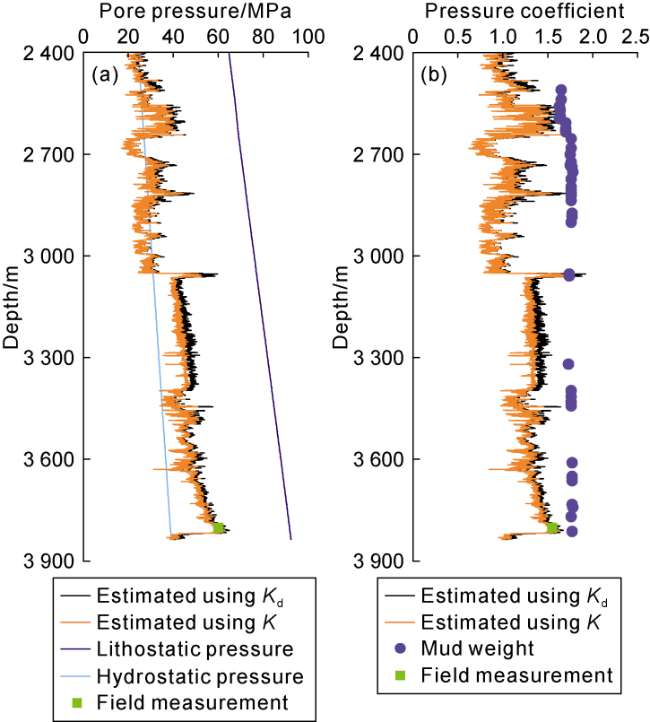
Fig. 9. (a) Pore pressure and (b) pressure coefficient estimated using dry bulk modulus and saturated bulk modulus for Well DY5. |
3.4. Pore pressure estimation from seismic data
The proposed method was applied to estimate pore pressure and pressure coefficient using seismic data in the Dingshan area. The results are derived directly from acoustic impedance, shear impedance, and density volumes which were obtained from pre-stack seismic inver-sion. The seismic inversion results reveal continuously three-dimensional variation of pore pressure and pressure coefficient [70].
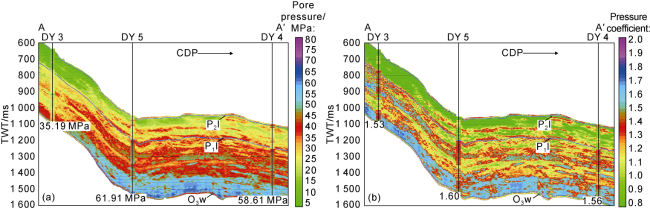
Fig. 10. 2D profile of (a) pore pressure and (b) pressure coefficient estimated from seismic data in the Dingshan area (P2l - Upper Permian Longtan Formation; P1l - Lower Permian Liangshan Formation; O3w - Upper Ordovician Wufeng Formation; the profile location is shown in |
A 2D pressure coefficient profile following the same line A-A’ extracted from the 3D inversion results is shown in Fig. 10 b. Pressure coefficient was calculated based on the estimated pore pressure. Both pore pressure and pressure coefficient have good stratigraphic layering and continuous features, corresponding well with the geological characteristics in the study area. The estimated pressure coefficient from seismic data matches well with the spatial distribution of hydrocarbon accumulation of the Wufeng and Longmaxi shales [75-76]. The deep-water continental shelf environment of the Wufeng and Longmaxi shale units are conducive to the preservation of the organic matter, which potentially increases pore pressure and pressure coefficient due to the late hydrocarbon generation. A layer of high pressure coefficient is observed in the target formation above Wufeng Formation from the seismic inversion results. The overlying formations deposited in shallow-water continental shelf and mixed continental shelf facies with carbonate and siliciclastic sediments have low porosity, low permeability, and relatively low organic abundance, resulting in the low values of pressure coefficient, which also is reflected in the inversion results. Compared with wells DY4 and DY5, the estimated pressure coefficient from seismic data at well DY3 looks slightly different from the field measurements and log prediction results. Due to the substantial tectonic uplift [75], fractures and micro-faults are more likely to develop near well DY3 than near wells DY4 and DY5 in the target layers. The seismic results reflect the initial formation pressure before drilling, which is higher than the log and measured pressure data acquired after drilling.
4. Discussion
To further verify the feasibility of the proposed method, the results estimated from logging data were also compared with the results obtained using the Eaton's method[25], which is one of the most popular approaches used in the petroleum industry for pore pressure estimation based on the empirical relations between compressional velocity and pressure. It is important to note that although the two methods show similar pressure variation trends (Fig. 11 ), the pore pressure and pressure coefficient estimated by the proposed model reveal more explicit changes that directly relate to their physical causes, manifesting the sensitivity of pore structure variations due to pressure. However, different from the Eaton’s method which requires only a normal compaction trend and an empirical parameter n, the proposed rock physics model like any other rock physics based models demands rather more rock property parameters than those can be obtained from seismic data for practical applications.
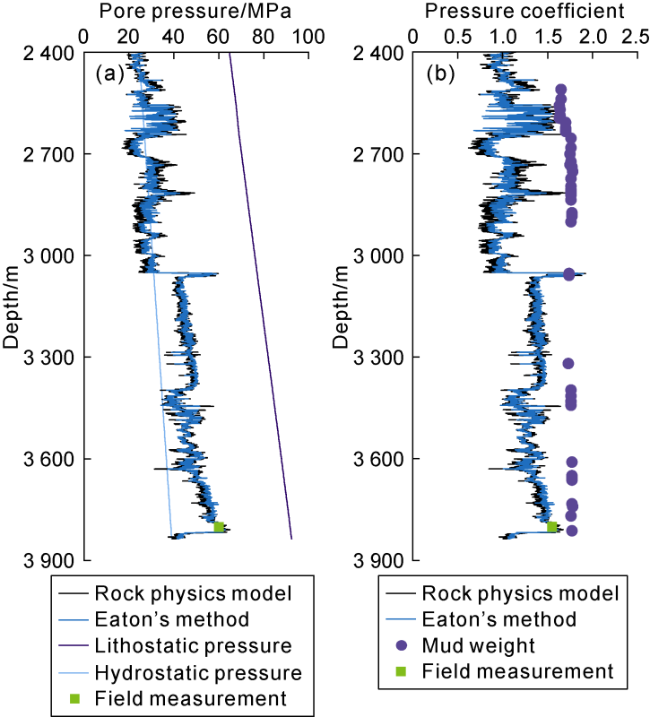
Fig. 11. (a) Pore pressure and (b) pressure coefficient estimated using the proposed method and the Eaton’s method for well DY5. |
The proposed method fundamentally depends upon the frame flexibility factor (γ) as a function of mineralogy, grain size and pore aspect ratio. Different from other rock physics models, the proposed model further introduces an explicit function of aspect ratio with pressure (Eq. (9)). For example, in the Xu and Payne model [55], on the basis of Kuster and Toksöz theory [53], aspect ratio is only implicitly related to pressure from qualitative interpretation, in addition to its limit to low porosity rocks [57]. Moreover, for practical applications, seismic inversion of elastic moduli should produce more accurate results theoretically than inversion of aspect ratio, because in the latter case many rock property parameters need to be unavoidably assumed in the inversion a priori which introduce uncertainty [56-57]. It must be noted that the approximation of dry bulk modulus using saturated bulk modulus for seismic pressure estimation should be applied with caution. Its feasibility and accuracy need to be examined at well locations using available well log data before application to seismic inversion.
The estimated pressure coefficient from pre-stack seismic inversion is positively correlated to the gas content from wells DY4, DY5, and DY3 (Fig. 12 a). The spatial distribution of both pressure coefficient and gas content is affected by the regional tectonic setting in the Dingshan area. The Dingshan structure is a NE-SW trending nose-shaped fault anticline controlled by the Qiyueshan fault zone. Adjacent to the Qiyueshan fault zone, intense compressional deformations and substantial uplifts occur in the southeast part of the Dingshan area. The intensity of deformation decreases with increasing distance from the Qiyueshan fault zone from southeast to northwest and is weak in the northwestern Dingshan area [43,75]. The geomechanical stress analysis by Xie et al. [77] shows that the variations of fracture density and fracture strike in the Dingshan area are consistent with the regional structural characteristics. Fracture density is relatively higher in the southeastern Dinshan area nearer to the Qiyueshan fault zone and shows an overall trend of gradual decrease from southeast to northwest in the Dingshan area (Fig. 12 b) [77]. Because of the diverse fracture density variation due to the tectonic activity in the vicinity of the study area, the preservation conditions of shale gas in the Wufeng and Longmaxi formations vary at different locations. As fractures are relatively less developed in the northwestern Dingshan area near wells DY4 and DY5, the good preservation condition of hydrocarbon led to high gas production and relatively high pressure coefficient; however, well-developed fractures and micro-faults in the southeast part near well DY3 due to uplift are not conducive to preserve hydrocarbon and also result in rapid production decline after drilling and relatively low gas production [74], as well as relatively low pressure coefficient. In general, the amplitude and directional distribution of pressure coefficient estimated from seismic data using proposed rock physics method are in good agreement with the regional tectonics and geomechanical stress analysis from other independent measurements and studies.

Fig. 12. (a) Time slice of pressure coefficient estimated from seismic data and (b) tectonic fracture density of the Wufeng and Longmaxi formations in the Dingshan area (Modified from Reference [77]). |
5. Conclusions
This study quantitatively characterizes the deformation of pore structures caused by pressure and its effect on bulk modulus and P-wave velocity.
During compaction, both porosity and pore structure changed significantly with pressure. After compaction, porosity only slightly varies with pressure, whereas pore structure is highly sensitive to pressure change, especially in gas saturated rocks with low porosity. Compressional wave velocity and bulk modulus are inversely related to frame flexibility factor (γ). The larger the value of γ, the smaller average aspect ratio of a rock, indicating that the rock contains more narrow pores and micro-cracks. As pressure increases, micro-cracks and thin pores are very sensitive to pressure changes and close first, which leads to drastic decrease in γ and a sharp increase in bulk modulus and P-wave velocity.
The rock physics-based modulus-pressure relations thus developed for pore pressure estimation incorporate the effect of pressure on both porosity and pore structure. The methods are successfully applied to well log and seismic data to estimate pore pressure and pressure coefficient in the Wufeng and Longmaxi formations in the Dingshan area. The estimated results are consistent with pressure buildup testing, mud weight, and production data, as well as regional tectonics and the geomechanical stress analysis. The uplift of southeast part of Wufeng and Longmaxi formations in the Dingshan area caused by compressional deformations leads to well-developed fractures and micro-faults, resulting in rapid production decline and low gas production after drilling.
A better in-depth understanding of the pressure effects on elastic properties using rock physics models proposed here and its resultant methods provide a more accurate approach to map the spatial distribution of abnormal pressures and evaluate the preservation conditions and enrichment for shale gas exploitation.
Nomenclature
a—average aspect ratio of the rock;
a1—initial average aspect ratio;
A, B—empirical parameters related to lateral stress coefficient and depth;
C—compressibility, m2/N;
Cd—compressibility of frame (dry rock), m2/N;
Cf—compressibility of pore fluid, m2/N;
Cs—compressibility of matrix minerals, m2/N;
D—parameter measuring specific grain contact area;
g—gravitational acceleration, m/s2;
K—bulk modulus, GPa;
Kd—dry bulk modulus, GPa;
Ks—bulk modulus of matrix minerals, GPa;
Kn—normal dry bulk modulus, GPa;
Kn1—normal dry bulk modulus at surface condition, GPa;
k—lateral stress coefficient;
l—empirical parameter related to normal dry bulk modulus and pressure;
m—empirical parameter related to porosity and pressure;
nk—index related to elastic moduli of the solid grains;
n—empirical parameter related to dry bulk modulus and pressure;
Pc—pressure coefficient;
Pd—differential pressure, MPa;
Pdh—normal differential pressure, MPa;
Pe—effective pressure, MPa;
Ph—hydrostatic pressure, MPa;
Pls—lithostatic pressure, MPa;
Pov—overburden pressure, MPa;
Pp—pore pressure, MPa;
P1—initial pressure, MPa;
TOC—total organic carbon content, %;
Vp—compressional wave velocity, km/s;
Vs—shear wave velocity, km/s;
z—depth, m;
z0—surface depth, m;
α—Biot coefficient;
β—empirical parameter related to pore structure and pressure;
γ—frame flexibility factor;
γ1—initial frame flexibility factor;
μ—shear modulus, GPa;
μd—shear modulus of frame (dry rock), GPa;
ρ—density of saturated rock, g/cm3;
ρf—density of pore fluid, g/cm3;
ρs—density of solid rock matrix, g/cm3;
ρ(z)—density of the overlying formations at depth z, g/cm3;
σH—maximum horizontal stress, MPa;
σh—minimum horizontal stress, MPa;
σv—vertical stress, MPa;
ϕ—porosity, %;
ϕs—fraction of rock matrix, %;
ϕs1—initial fraction of rock matrix, %.