

Introduction
Water flooding experiments with microfluidic model can directly show the fluid flow characteristics and remaining oil distribution law in the oil-water two-phase displacement process, which are essential for understanding the development of complex reservoirs. At present, most microfluidic experiments only demonstrate the flow of multiphase fluids under different environmental conditions, but do not quantitatively analyze its internal mechanism [1⇓-3]. Different from analytical methods such as experimental simulation and three-dimensional model reconstruction, the digital image processing technology can describe the fluid flow state more realistically and quantitatively, promoting the development of microfluidic experimental technology from phenomenon observation to quantitative description [4⇓-6]. Based on the image features of remaining oil distribution, Wang et al. [7] classified and identified the microscopic remaining oil and made quantitative statistics. Wu et al. [8] and Gao et al. [9] used microscopic model water flooding experiments to classify and count microscopic remaining oil under different conditions. Some scholars have also studied microscopic remaining oil distribution by Micro-CT scanning experiments [10⇓-12]. However, the previous studies are limited to microscopic residual oil under static conditions rather than the distribution law under flow conditions.
In addition to the microscopic remaining oil distribution, the oil-water-rock three-phase contact angle is also a paramount indicator of oil-water flow. The three-phase contact angle under the condition of only capillary force can reflect the wettability of rocks. It is of great significance to recognize the dynamic changes of the three- phase contact angle in water flooding to understand the law of oil-water flow [13]. Initially, the three-phase contact angle was mainly measured by using the contact angle measuring instrument to measure the contact angle of a single droplet in the open space [14⇓-16]. This method considers a single droplet and focuses on the characterization of the fluid-solid contact interface from an image perspective, but it neglects the distribution state of the droplet in the pore-throat environment. Micro-CT scanning image technology has also been applied to measure the contact angle in the pore-throat system. Andrew et al.[17] and Klise et al. [18] established a pixel-level in-situ contact angle automatic measurement method based on the micro-CT three-dimensional scanning images and studied the distribution of contact angle under different rock structures. Scanziani et al. [19] separated rock, water, and oil in the 3D core reconstruction data, carried out linear fitting on the rock edge, and made circular fitting and merging on the oil-water interface to take the tangent line. Then, they completed the automatic measurement of the three-phase contact angle by measuring the included angle of the two lines. This method realizes a more accurate measurement from microscopic images, but it reflects the characteristics of a three-phase contact angle under static conditions. Mirzaei et al. [20] determined the exact position of the contact point through the Harris corner detection function according to the edge curve and realized the measurement of the droplet contact angle. AlRatrout et al. [21] used the constant fluid- fluid interface curvature to find the contact line and normal vector, and calculated the contact angle, so that the in-situ contact angle of immiscible fluids could be measured. Ibekwe et al. [22] realized the accurate measurement of microscopic three-phase contact angles in images by means of contact point identification, rough estimate of contact angles, and angle precision. It is shown that the above efforts take less account of the abstract representation of the contact angle, and cannot make statistical analysis of a large number of contact angles in the image. However, these achievements have reference significance for the image processing and analysis strategy of three-phase contact angle. Considering the visual characteristics of microfluidic experimental images, such as clear threshold, uneven exposure, and few phase states, as well as relevant requirements for the measurement of the contact interface between oil, water, and rock, this paper proposes a method to automatically measure three-phase contact angles based on digital images from microfluidic experiments, according to the approach of Scanziani et al. [19] and AlRatrout et al. [21] to measure the micro three-phase contact angle by imitating CT reconstruction data.
1. Microfluidic water flooding experiment and image preprocessing
A water flooding experiment was performed on a microfluidic model, and the charge-coupled element (CCD) camera was used to take the images and videos (resolution of 1236×1624) of the experiment process. The obtained saturated oil images were used to extract the rock skeleton, and the remaining oil images when the microfluidic model reached the remaining oil state were used for the classification of remaining oil and the automatic measurement of contact angle (Fig. 1 ). The microfluidic model is water-wet, with the porosity of 20.63%, and the water saturation of 67.78% when the residual oil state is reached. The viscosity of oil used in this experiment is 4 mPa•s, and the total flow area of the model is about 2 cm×1.5 cm.

Fig. 1. Images of saturated and residual oil states. |
In order to remove the uneven exposure of the image, the adaptive threshold binarization method was used to segment the rock, oil, and water in the process of extracting the three phases of rock, oil and water in the image. The binary image was processed by median filtering to remove the salt-and-pepper noise in the image [11,22⇓ -24]. The corresponding binary images can be obtained after the preprocessing of the saturated oil image and residual oil image [25]. The binary image is superimposed to obtain the ternary image after oil, water, and rock separation and extraction. Fig. 2 shows the ternary image and local detection results at the time of water flooding to the 40 min and 10 s.
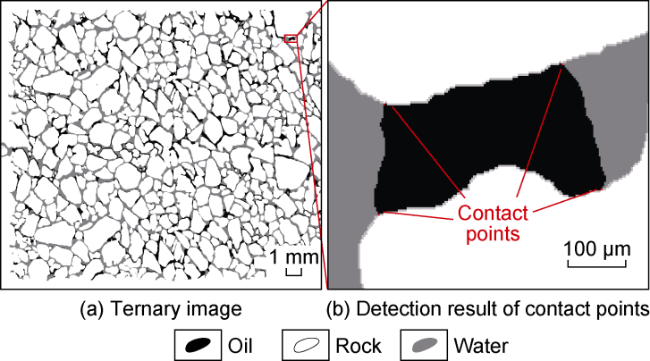
Fig. 2. Ternary image and detection result of local contact points. |
2. Automatic measurement of three-phase contact angles
2.1. Identification of the contact point by neighborhood detection
It is not necessary to detect all pixels of the rock phase to identify the critical points of the contact angle. Detecting pixels inside the rock in the image may lead to less efficient detection of contact angle. Using the edge detection approached proposed by Canny [26] to extract pixels on the rock edge can significantly improve the rock phase detection efficiency. In the remaining oil ternary image, the gray values of oil, water, and rock can be distinguished by Canny’s edge detection approach clearly. More specifically, the vertex of the three-phase contact angle (or the contact point) to be searched should be the gray values’ intersection of oil, water, and rock.
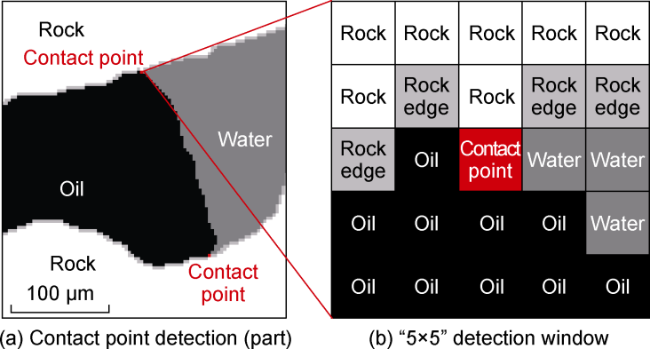
Fig. 3. Schematic diagram of “5×5” detection window of contact point. |
2.2. Extraction and fitting of three-phase interface
After all effective contact points in the image were detected, the oil-water-rock interface was extracted to avoid the influence of complex pore throat environment during the contact angle measurement. Based on the ternary image, the adjacent rock edge pixels and the oil-water interface curve pixels were extracted using the contact point as the starting point. These pixels would be used for the measurement of the contact angle. The contact angle that could be effectively measured should be called an effective contact angle. During the extraction, the contact points with few oil or water phase pixels near the contact point would be discarded in order to reduce the error.
In the process of detecting the oil-water interface curve, the mean slope difference of the pixels near the curve detection window was calculated in real-time. The inflection change of the rock edge or oil-water interface curve was quantified by adjusting the value of the mean slope difference of the neighborhood to determine when to stop detecting the interface curve.
The three-phase contact angle in micro-image is a variable at micro-scale. The image resolution in the experiment would cause errors in the measurement results. In this paper, the cubic spline interpolation method was used to enlarge the original image. This method retains three thresholds in the image, and fit the oil-water interface, rock edge and others. Thus, it improves the calculation accuracy of the ternary image at the image level.
After adjusting the image resolution, it is also necessary to process the rock edge and oil-water interface in the physical sense. According to the contact angle measurement method with 3D core reconstruction data established by Scanziani et al. [19], the rock edge curve pixels were straight-line fitted, and the oil-water interface curve pixels were fitted using the least squares method [27]. In Fig. 4 , the green line segment is the rock edge fitting line segment, and the blue line segment is the tangent line segment of the fitting arc passing through the contact point; the contact angle between the two lines is 112.4°.
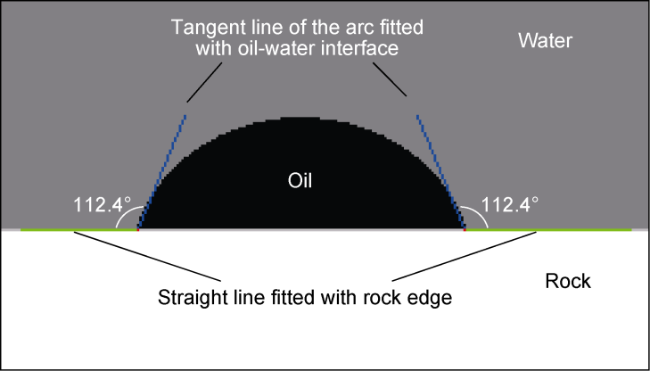
Fig. 4. Schematic illustration of contact angle measurement principle of standard circular droplet. |
After extracting and fitting the three-phase interface, both sides of the angle need to be represented as two end points that can be used for angle calculation. The abstract position relationship between the contact point and the two end points is shown in Fig. 5 . In the image coordinate system, the coordinate of the contact point is marked as (xc, yc), the coordinate of the end point of the line fitted with the rock edge is marked as (x0, y0), and the coordinate of the end point of the arc tangent line is marked as (qx, qy). These three points are used to calculate the contact angle. For the rock edge, any point on the fitting line can be taken as an end point. For the tangent line of the arc fitted with oil-water interface, a vertical line passing the contact point is drawn according to the line between the contact point and the center of the fitting arc (marked as (x1, y1)); then, arc tangent line is obtained, and any point on it can be taken as an end point.
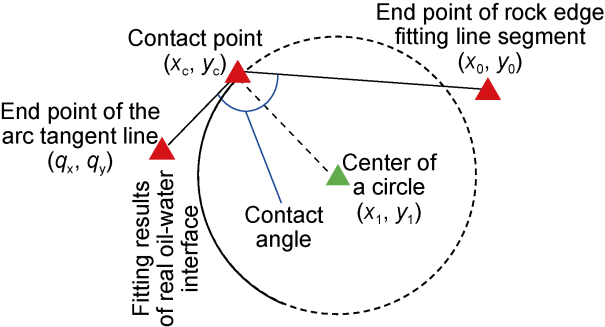
Fig. 5. Schematic diagram of abstract relation of positions of points of contact angle. |
2.3. Automatic measurement of three-phase contact angles
The angle composed of the contact point, rock edge line, and tangent line is the contact angle in the abstract sense. According to the relative positions of the three points, the specific value (measured value) of the contact angle can be calculated by the geometric method. The calculation process is shown in Fig. 6 . In the image, taking the contact point as the basic detection unit of the contact angle, the value of each contact angle was traversed, measured, and calculated, and the contact angles corresponding to complex measurement environment like very few data points, and location at the edge of the image are discarded. Finally, the batch calculation of effective three-phase contact angles at a time in the microfluidic experiment was completed. Because the positions of image pixels are all integers, there is an inevitable rounding error in the calculation result of the contact angle. However, this paper has calculated and counted all effective contact angles in the microfluidic experimental image, so the sample number is large enough, and the error caused by image accuracy has little impact on the statistical results.
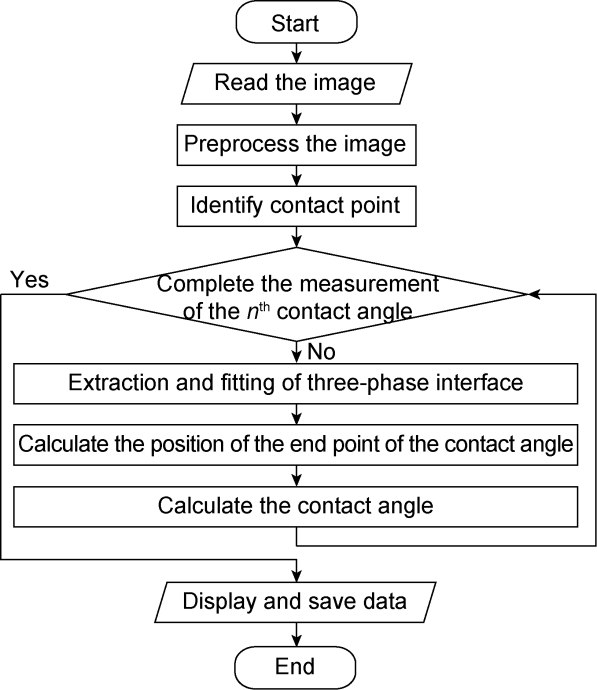
Fig. 6. Process of three-phase contact angle automatic measurement. |
3. Results of three-phase contact angle measurement
3.1. Measurement error
The manual measurement of contact angle is often subjective. It cannot reflect the unified constraints of this measurement method on multiple groups of results. Nonetheless, it can still be an additional verification of the automatic measurement in this study. During the microfluidic experiment, the residual oil state was achieved when the displacement reached 40 min and 10 s. The residual oil image at this time was selected, and 47 contact angles were measured manually on the ternary image. Then, the contact angles were sorted in an ascending order, and compared with the contact angles calculated by the method proposed in this study and sorted in the same order (Fig. 7 ). After removing some ineffective contact angles (with few data points, image noise, image boundary, etc.), a total of 2373 effective contact angles were obtained.
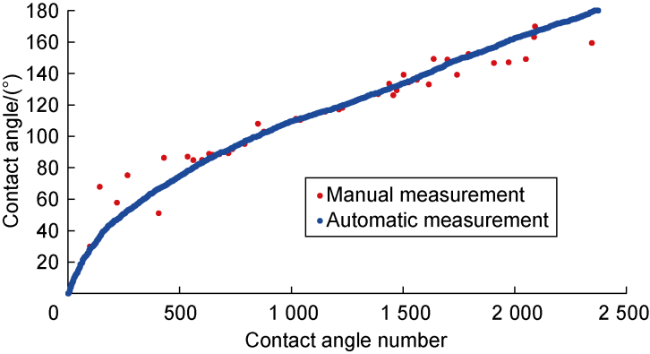
Fig. 7. Contact angle distribution curve and manual measurement results in the residual oil state. |
Assuming that the manual measurement is the actual value, the mean absolute error and the mean relative error of the automatic measurement are 5.40° and 1.50%, respectively. Obviously, the automatic measurement results are consistent with the manual measurement results. This indicates that the automatic measurement of three-phase contact angle is reliable. The error of the automatic measurement is mainly caused by the calculation error, which is related to three-phase threshold segmentation, extraction of rock edge and oil-water interface, data fitting algorithm, etc.
3.2. Distribution of three-phase contact angles
The value of the oil-water-rock three-phase contact angle is related to the wettability of the model, capillary pressure, and displacement parameters. The three-phase contact angle measured in the laboratory is a static result, and it is significantly different from the microscopic dynamic three-phase contact angle under oil-water displacement conditions. In the oil-water two-phase flow of the microfluidic model, the three-phase contact angle reflects the complex force changes of the contact interface. With the displacement time, the three-phase contact angle at the same position changes.
In order to observe the two-dimensional distribution of the measured contact angles more intuitively, all effective contact angles in the original ternary image at four displacement times are marked with solid circles in different colors (Fig. 8 ). As shown in Fig. 8 a, when the displacement reaches 16 min and 5 s, the contact angle near the injection end is mainly acute. As shown in Fig. 8 b, when the displacement reaches 21 min and 10 s, water is produced at the production end, near which there are a large number of obtuse contact angles. As shown in Fig. 8 c, when the displacement reaches 30 min and 14 s, the number of contact angles increases gradually, the number of obtuse angles increases as well. As shown in Fig. 8 d, when the displacement reaches 40 min and 10 s, the residual oil state is achieved, the contact angle tends to be evenly distributed on the plane, and the number of obtuse angles increases slightly.
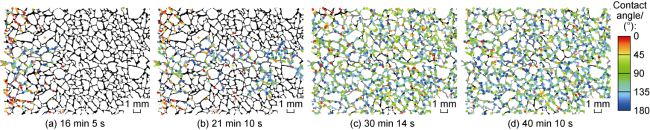
Fig. 8. Spatial distribution of contact angles at four times. |
In order to analyze the probability density of the contact angle measurement data, the standard fitting probability density curve and Gaussian kernel density estimation probability curve were drawn for the four groups of contact angle data. Fig. 9 a-9d are the results of normal distribution fitting, which can be used to analyze the uniformity and concentration of contact angle data distribution. It can be seen that with the displacement, the mean value of the contact angle gradually increases, the peak value of the contact angle shifts from the acute angle to the obtuse angle, and the data are more concentrated, indicating that the overall model gradually changes from water-wet to oil-wet. Fig. 9 e-9h are the Gaussian kernel density estimation probability curve of contact angle data, mainly reflecting the distribution characteristics of contact angle data in different angle ranges. Each upward-convex peak on the curve represents the aggregation of contact angle data within a specific angle range. In the early stage of water flooding (16 min 5 s), the kernel density estimation probability curve has an acute angle peak and an obtuse angle peak. The acute angle peak is higher, indicating that the data are more concentrated on acute angles and the mean value of contact angles reflects acute angle. It is speculated that the microfluidic model as a whole is water-wet at this time. As the displacement progresses, the peak of the curve gradually shifts to the right. When the displacement reaches 21 min and 10 s, the mean value of contact angles becomes obtuse. The kernel density estimation curve still contains an acute angle peak and an obtuse angle peak. However, the obtuse angle peak is higher, and the data are more concentrated on the obtuse angle. When the displacement reaches 30 min and 14 s, the number of contact angles begins to increase, corresponding to the increase in the number of contact angles in respect of two-dimensional distribution shown in Fig. 8 c. At this time, the mean value of contact angles is close to that at 21 min and 10 s, and the kernel density estimation curve contains two peaks in the obtuse angle area. When the displacement reaches 40 min and 10 s, the mean value further increases, and the data are more concentrated than that in the early stage of water flooding. The two peaks of the kernel density estimation curve in the obtuse angle area shift to the right as compared with those at 30 min and 14 s, and the data are concentrated on two larger obtuse angles.
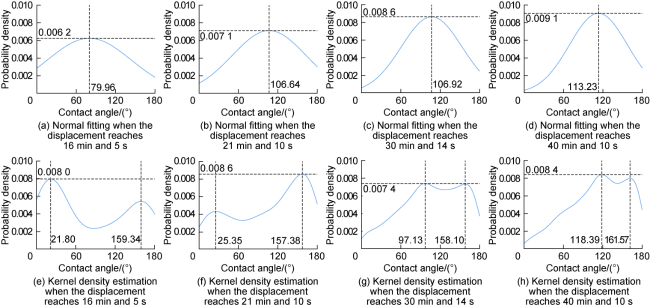
Fig. 9. Normal fitting and kernel density estimation probability distribution curves of contact angle data at four typical displacement times. |
3.3. Dynamic change of contact angle at different displacement stages
The overall wettability change of the microfluidic model is a complex dynamic process, and it is challenging to study the wettability of a single oil-water-rock three- phase contact angle from a microscopic perspective. Studying the dynamic statistical characteristics of the contact angle data at different displacement stages can more effectively characterize the overall wettability of the microfluidic model.
The dynamic changes of the three-phase contact angle and oil-water contact relationship during the displacement were further observed. The frame of the video was analyzed, the water saturation of the image at each time was calculated, and the three-phase contact angle at each displacement stage was measured. The video of the microfluidic displacement experiment is 25 frames/s, with a total duration of 40 min and 13 s. After water flooding for about 40 min, the model got a residual oil state. The water saturation at this time is 67.78%. In the video analysis process, only the contact angle on one side of the water phase was measured. The measured data include all the contact angle data from the beginning of water flooding to the residual oil state, which can basically reflect the dynamic change process of oil-water contact relationship in the microscopic water flooding experiment.
The microscopic three-phase contact angle change during water flooding reflects the interaction between capillary force and viscous force under flowing conditions. After displacement, the viscous force no longer affected the interface distribution of the fluid. Its contact angle measurement results can be used for the wettability analysis of the model. Fig. 10 shows the change of the mean value of contact angles at different displacement stages, mainly reflecting the dynamic change process of the mean value of three-phase contact angles from acute angle to obtuse angle. When the water saturation is less than 12.02%, the mean value of three-phase contact angles measured is almost acute. When the water saturation is higher than or equal to 12.02%, the mean value of three-phase contact angles measured is all obtuse, and distributes between 100° and 120°. When the residual oil state is reached (water saturation of about 67.78%), the mean value of contact angles is about 113.23°.
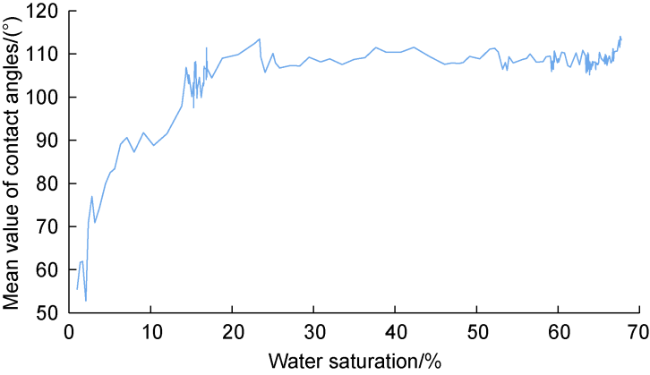
Fig. 10. Mean value of contact angles at different displacement stages. |
During the water flooding, the oil-water interface is always subject to the interaction between viscous force and capillary force. The change of contact angle reflects the result of interaction between capillary force and viscous force. At the initial stage of displacement, the viscous force dominates, and the contact angle is generally acute. In the process of gradual transformation of oil-water distribution to residual oil state, the effect of viscous force on residual oil is gradually weakened, and the contact angle is gradually transformed into an obtuse angle, which reflects the process of gradual transition from viscous force to capillary force. At the end of the displacement process, the residual oil is only subject to the capillary force, and the contact angle is mainly obtuse. The experimental model is prone to be oil-wet. At this time, the wettability of the microfluidic model is reversed, which is believed to be related to the change in the surface properties of silica caused by the acidic substances in oil.
3.4. Variation of contact angle of remaining oil with different flow regimes
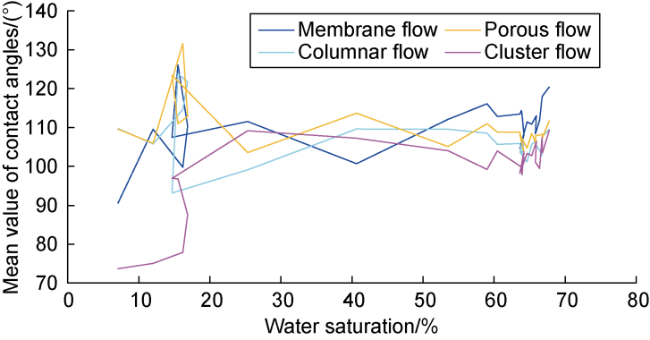
According to the microscopic remaining oil flow regime classification of Wang et al. [7] and Li et al. [28], the remaining oil flow regimes in the experimental image can be divided into five types: drip flow, membrane flow, columnar flow, porous flow, and cluster flow (Fig. 11 ). As a unique flow regime, the drip flow occurs in the center of the pore throat, and corresponds to no three-phase contact angle, so this flow regime is not analyzed here. The remaining four flow regimes were matched with the contact angle measurement results at the corresponding positions. The dynamic changes of the contact angle of the remaining oil with different flow regimes at different displacement stages were obtained (Fig. 12 ).
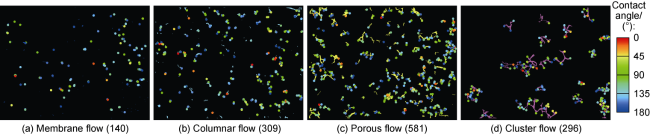
Fig. 11. Classification results of remaining oil and its contact angles when displacing to 40 min 10 s (the dot represents the location of the remaining oil flow). |
Fig. 12. Change of mean value of contact angles of remaining oil with different flow regimes at different displacement stages. |
4. Conclusions
For water-wet rocks, the mean value of contact angles is mainly acute in the early stage of displacement. Along with the displacement, the force of the oil phase transits from viscous force to capillary force dominated. The mean value of contact angles increases continuously, and the obtuse angle is dominant in the middle-late stages of displacement.
During the displacement, the contact angles of the remaining oil with porous flow and columnar flow change slightly, and the mean values represent obtuse angles. Such remaining oil has poor mobility after formation and is difficult to produce. The mean value of contact angles of remaining oil with cluster flow rises as a whole and the difficulty of producing such oil is gradually increasing. The membrane flow reflects obtuse angle generally; the mean value of contact angles is the largest and the difficulty of production is the largest in the late stage of water flooding. After the displacement, the remaining oil phases with different flow regimes are only affected by the capillary force, and the contact angle is obtuse. Under the action of oil, the model is prone to be oil-wet.
Nomenclature
n—number of contact angles to be calculated;
(xc, yc)—coordinate of contact point;
(x0, y0)—coordinate of end point of line segment fitted with rock edge;
(qx, qy)—coordinate of end point of arc tangent line;
(x1, y1)—coordinate of the circle center.