

Introduction
In 2020, China announced that it would strive to achieve Peak Carbon Dioxide Emission (PCDE) by 2030 and Carbon Neutrality (CN) by 2060 [1⇓-3] for the first time at the 75th session of the United Nations General Assembly. Currently China is the largest energy consumer in the world, with coal taking a much larger share of energy consumption compared to the world’s major economies, reaching 56.8% in 2020. China is also the largest carbon emitter, with carbon emissions of about 99.0×10⁸ t in 2020 from energy consumption, about one third of the world’s total carbon emissions [4-5]. The UN Paris Climate Change Agreement aims to limit the global average temperature rise to less than 2 °C above the pre-industrial level, and commits to limit the temperature rise to below 1.5 °C as a long-term goal. As the largest carbon emitter, China’s Dual Carbon Target (PCDE and CN) will play an important role in helping drive the long-term goals of Paris Climate Change Agreement.
In recent years, China has embraced clean energy and accelerated the process of natural gas exploration and development, resulting in record high natural gas production and consumption. The natural gas production reached 1925×108 m3 and consumption reached 3280×108 m3 in 2020. Natural gas will play a more vital role in the energy mix as a clean and low-carbon fossil energy under the guideline of Dual Carbon Target. In this paper, China’s natural gas supply and demand under the Dual Carbon Target is predicted by using the BP (Back Propagation) Neural Network-LEAP (Long-range Energy Alternatives Planning System) model and the production composition method, and the future direction of natural gas industry under the Dual Carbon Target is discussed.
1. Forecast of natural gas consumption in China
Approaches commonly used for natural gas consumption forecast include analogy method, energy consumption ratio method, sector analysis method, gas-consuming project analysis method, and system dynamics model, etc. Basically, however, these traditional methods do not involve carbon emission limit [1]. In this paper, the BP Neural Network-LEAP model was used to forecast natural gas consumption, which takes into account the balance between energy consumption, carbon emission limit and energy cost, so that the forecast results are more in line with the trend of natural gas consumption in the context of the Dual Carbon Target.
1.1. Forecast model for natural gas consumption
1.1.1. BP neural network
BP neural network is one of the most widely used artificial neural network models, and a standard BP neural network consists of an input layer, an output layer and several (one or more) hidden layers between them. Each layer can have several nodes, and the link state of the nodes between layers is represented by weights. The BP Neural Network is capable of discovering the linear or nonlinear relationships between data, which offers the benefit of optimizing the network structure and adjusting the weights and thresholds of each node through its own training without defining the mathematical equations of the mapping relations between inputs and outputs in advance, and also predicts the key parameters based on the network model created in the training.
The model training process of BP neural network involves forward propagation and backward propagation. In the forward propagation, the training samples (x, y) are first normalized, where the input vector x={x1, x2,..., xn} and the expected vector y={y1, y2,..., ym}. The normalized sample data is then propagated to the hidden layer for calculation, and the results of the calculation are transferred to the next node as input, and so on, until it is propagated to the output layer. If the error between the output vector $\tilde{y}=\{\tilde{y}_{1},\tilde{y}_{2},\cdots, \tilde{y}_{m}\}$ and the expected vector y is greater than the error limit, the training process is propagated backwards and the error is fed back to the input layer through the hidden layer. Through several iterations, the weights among the nodes on the network are continuously adjusted so that the error is gradually reduced until the accuracy requirement is met.
1.1.2. LEAP model
The LEAP model is a typical integrated multi-domain simulation system of energy, environment and economy established on the basis of “bottom-up” simulation approach. The LEAP model is mainly used to predict the energy demand and the carbon emissions of countries, regions or industries under different scenarios, so as to provide references for policy-making departments to make energy decisions [6].
The main benefits of LEAP model include: (1) The model is supported by a huge technological and environmental database (TED), which contains carbon emission data for different industries and energy sources, so it provides a perfect solution for studying the trend of energy consumption under the carbon emission limit. (2) The model can be used to forecast the energy consumption of different industrial sectors such as industry, transportation and power in different spatial ranges such as countries and regions. (3) The model considers all relevant factors, and builds a prediction model based on multiple aspects including energy supply side, demand side and conversion side, so the prediction results are accurate and reliable. (4) The model includes a built-in OSeMOSYS (open source energy modeling system) and GLPK (GNU linear programming kit) solver, which can be used to optimize the energy mix automatically, thus striking a balance between energy consumption, carbon emission limit and energy cost, and minimizing the impact of artificial settings on the prediction results.
1.1.3. Method for improving LEAP model
In the process of building the LEAP model, we need to set the energy consumption of the terminal users (demand side) first, and there is a conversion efficiency between the terminal energy consumption and primary energy consumption, for example, the nationwide terminal energy consumption is about 35×108 tce in 2020, while the primary energy consumption is about 49.8×10⁸ tce. Some primary energy sources can be directly used for terminal consumption after being processed. For example, natural gas can be directly used for terminal consumption after being processed in treatment plants and purification plants, and coal can be also directly used after being washed and desulfurized. There’s little raw material loss in the processing and transportation of natural gas and coal, with energy conversion efficiency above 95%. Other primary energy sources such as coal, oil, natural gas, hydro resource, wind, solar, nuclear, geothermal energy (geothermal power generation) need to be converted into secondary energy first, and then used for terminal consumption. The conversion efficiency from primary energy to electricity is about 40%, and the conversion efficiency of petroleum refining is about 94% [7].
It is widely believed that electricity will play a more important role in terminal energy consumption in the context of Dual Carbon Target, because non-fossil energy sources will replace fossil energy mainly in the power sector, and the share of electricity in terminal energy consumption is expected to increase to over 60% in 2060
(about 27% in 2020) [8]. As the share of electricity in terminal consumption gradually increases, the total primary energy consumption will increase significantly for the same amount of terminal energy consumption since the energy conversion efficiency of electricity in the LEAP model (about 40%) is much lower than that of other energy sources (more than 90%). This result deviates from the actual situation. This is because the LEAP model only considers the conversion efficiency between the primary energy and terminal energy, but does not consider the work efficiency of terminal energy, for example, gas cars consume about 10 L of fuel per 100 km, with a thermal equivalent of about 10.6 kgce, while electric cars consume about 16 kW•h of electricity per 100 km, and the energy consumption for the same electricity production is only 5.2 kgce; furthermore, the thermal energy utilization efficiency of gas stoves is about 50%, while the work efficiency of induction cookers can reach about 85%, which shows that electricity is more efficient than non-electric energy in the process of terminal energy consumption. Therefore, when setting the comprehensive energy efficiency, it is necessary to consider both the conversion efficiency from primary energy to terminal energy and the work efficiency of terminal energy.
To improve the LEAP model, the comprehensive energy efficiency is defined as follows:
Conversion relations exist between terminal energy consumption and terminal effective energy consumption:
While the traditional LEAP model calculates primary energy consumption based on terminal energy consumption and energy conversion efficiency, the improved model predicts total primary energy consumption in the future based on terminal effective energy consumption and comprehensive energy efficiency:
The share of electricity in terminal energy consumption and the share of electricity in the terminal effective energy consumption are inter-convertible:
1.1.4. BP neural network-LEAP model
Although BP neural network allows prediction of parameters relating to future energy consumption, using BP neural network alone is inadequate for prediction of complex energy consumption system including the evolution of the national energy mix, carbon emissions, and natural gas consumption. The LEAP model considers a wider range of factors including terminal energy consumption in households, industrial sector, transportation sector, and construction sector, energy conversion in intermediate stages such as power generation and chemical industry, and primary energy, secondary energy supply, but many parameters in the LEAP model, especially key parameters such as the effective energy consumption intensity of each terminal sector, need to be set artificially in advance. It is difficult to find reference values for these key parameters in relevant research papers, and the artificial settings are likely to cause big prediction errors. Therefore, this paper proposes a BP neural network-LEAP Model (Fig. 1 ), which combines the benefits of both methods to improve the accuracy and objectivity of the prediction results.
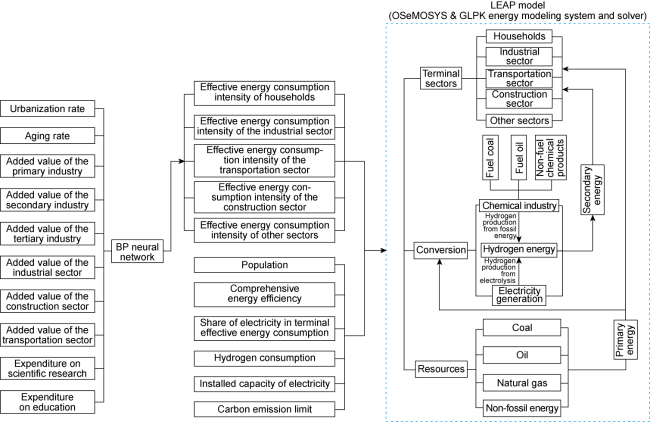
Fig. 1. Diagram of BP neural network-LEAP model. |
The terminal effective energy consumption intensities (including households, industrial sector, transportation sector, construction sector and other sectors) are influenced by many parameters including urbanization rate, aging rate, added value of the primary, the secondary, and the tertiary industries, added value of the industrial sector, added value of the construction sector, added value of the transportation sector, expenditure on scientific research, and expenditure on education. Therefore, it is necessary to collect the historical data of relevant parameters first, and then analyze the linear or non-linear relationships of these key parameters based on BP neural network to predict the effective energy consumption intensity of the five major terminal sectors. Then, the results are substituted into the LEAP model, which is used to simulate the energy supply and demand balance under different scenarios, and then predict the national energy consumption, natural gas consumption and other data.
1.2. Parameter selection and scenario assumption
All of the key parameters involved in the BP neural network-LEAP model are drawn from the data released by the National Bureau of Statistics, industry development plans or research results of authoritative institutions. The specific parameters are as follows: (1) Collecting the data published by the official website of the National Bureau of Statistics from 2001 to 2020 including population, urbanization rate, aging rate, added value of the primary, the secondary, and the tertiary industries, added value of the industrial sector, added value of the construction sector, added value of the transportation sector, expenditure on scientific research, and expenditure on education as input vectors; collecting energy consumption data of households, industrial sector, transportation sector, construction sector and other sectors [7], and convert them into terminal effective energy consumption intensity according to Eq. (2) as the expected vector. The processed input vectors and expected vectors are the training samples of BP neural network. (2) The population data from 2021 to 2060 is drawn from the data published on the website of the Chinese government and the Industrial Information network. The population is expected to reach a peak of about 14.5×10⁸ in 2030 [9] and drop to about 12.9×10⁸ in 2060. (3) GDP (Gross Domestic Product) growth rate is drawn from the reference data, with an average annual GDP growth rate of 5.0%-5.5% from 2021 to 2030, 3.0%-4.0% from 2030 to 2050, and 3.0%-3.5% from 2050 to 2060 [1]. (4) The urbanization rate and aging rate are drawn from the reference data, with an urbanization rate of 63.9% in 2020 and 75.0% in 2060, and an aging rate of 13.5% in 2020 and 28.0% in 2060 [10]. (5) China is expected to become a medium developed country in 2060, so the current data of medium developed countries such as South Korea can be taken as a reference for the structure of the three industries, and it’s expected that the added value of the primary, the secondary, and the tertiary industries in China will be adjusted to 4%, 31% and 65% of GDP in 2060. (6) From 2001 to 2020, the growth rate of the added value of the industrial sector is about 0.9 times of that of the secondary industry, the growth rate of the added value of transportation sector is about 0.8 times of that of the tertiary industry, and the growth rate of the added value of construction sector is about 4.5 times of that of the urbanization rate, therefore, the growth rates of the added value of the industrial sector, transportation sector and construction sector are assumed to be the corresponding multiples of the corresponding parameters. (7) From 2001 to 2020, the growth rate of expenditure on scientific research is about 1.5 times the growth rate of GDP, and the growth rate of expenditure on education is about 1.2 times the growth rate of GDP, so the growth rates of expenditure on scientific research and expenditure on education from 2021 to 2060 are assumed to be the corresponding multiples of the growth rate of GDP [7]. (8) The petroleum consumption of non-fuel petrochemical products refers to the base scenario data in the World Energy Outlook 2019 by CNPC Economics & Technology Research Institute [10]. (9) According to data from the references on hydrogen consumption, the hydrogen production in China will reach 1.3×10⁸ t in 2060 under the carbon neutrality scenario, including 1.0×10⁸ t of green hydrogen from non-fossil energy sources. The industrial sector will use about 7800×104 t of hydrogen, the transportation sector will use about 4100×104 t, and other sectors will use about 1200×104 t [11].
To figure out the impact of different technical conditions and policies on energy consumption and carbon emissions, three scenarios, namely the base scenario, the technical advancement scenario, and the carbon neutrality scenario (considering technical advancement and carbon emission limit) are created in this paper (Table 1 ). The technical advancement mainly includes the universal electrification of terminal energy-consuming equipment, the general improvement of the comprehensive energy efficiency of terminal energy-consuming equipment, and the extensive use of advanced power grids, hydrogen, non-fossil energy power generation techniques and gas power generation techniques. The base scenario and the technical advancement scenario do not impose any limit on carbon emissions, while the carbon neutrality scenario sets carbon emission limit in advance. The carbon emission data provided in the “four steps of carbon emission reduction” statement by academician Ding Zhongli and the carbon emission data provided in the global 2 °C temperature rise control scenario in Study on China’s Long-term Low-carbon Development Strategy and Transition Path by Tsinghua University [8,12] can be referred for the carbon emission limit data. That is to say that in 2030, 2040, 2050 and 2060, the national carbon emissions should be no more than 95×108, 65×108, 40×108 and 25×108 t respectively (the remaining carbon emissions of 25×108 t will be sequestered or buried by carbon sinks and CCUS technology to achieve the carbon neutrality target). In the base scenario and the technical advancement scenario, the future installed capacity of each type of electricity is set in advance (assumed to be a multiple of the installed capacity in 2020) [13], while the carbon neutrality scenario does not set the future installed capacity of electricity in advance, but uses the built-in OSeMOSYS open source energy modeling system and the GLPK solver to optimize the installed capacity ratio of each type of electricity automatically to meet the demand of terminal power consumption while meeting the requirements for carbon emission limit and energy cost.
Table 1. Parameters for the three energy consumption scenarios |
| Consumption scenarios | Year | Share of electricity in terminal effective energy consumption/% | Annual hydrogen consumption/108 t | Comprehensive efficiency of terminal fuel/% | Comprehensive efficiency of electricity/% | Electricity transmission loss rate/% | Installed capacity of coal power generation/ 108 kW | Installed capacity of gas power generation/ 108 kW | Installed capacity of non-fossil energy power generation/ 108 kW | Carbon emission limit/108 t |
|---|---|---|---|---|---|---|---|---|---|---|
| Baseline Year | 2020 | 45 | 0.33 | 36.00 | 34.00 | 5.60 | 10.80 | 0.98 | 9.55 | 99 |
| Base scenario | 2040 | 50 | 0.50 | 36.50 | 34.50 | 5.00 | 8.64 | 1.47 | 23.88 | |
| 2060 | 55 | 0.70 | 37.00 | 35.00 | 4.50 | 5.40 | 1.96 | 33.43 | ||
| Technical advancement scenario | 2040 | 55 | 0.63 | 37.30 | 35.30 | 4.80 | 5.40 | 1.96 | 28.65 | |
| 2060 | 65 | 1.00 | 38.50 | 36.50 | 4.00 | 3.24 | 2.45 | 42.98 | ||
| Carbon neutrality scenario | 2040 | 60 | 0.75 | 38.00 | 36.00 | 4.50 | 65 | |||
| 2060 | 75 | 1.30 | 40.00 | 38.00 | 3.50 | 25 |
1.3. Forecast results and analysis
1.3.1. Terminal effective energy consumption intensity
Before using the neural network model developed from training to predict terminal energy consumption intensity, the reliability should be verified first. The fitting results show that there is a strong correlation between the sample data, and the neural network model derived from training can accurately describe the mapping relationship between the data. The goodness-of-fit of the training set, validation set, test set and the full set are around 99% (Fig. 2 ), with very small fitting error and strong generalization, which indicates there’s no over-fitting and the neural network model is reliable. Then, the neural network model derived from training was used to predict the terminal effective energy consumption intensity from 2021 to 2060 (Table 2 ). The results show that the effective energy consumption intensity of terminal sectors will increase year after year, with the growth rate increasing more rapidly from 2021 to 2040, and slowing down and plateauing from 2040 to 2060. Among the sectors, the industrial sector has the highest effective energy consumption intensity, about 1.07 tce/person in 2060, followed by the households and the transportation sector, about 0.14 tce/person and 0.13 tce/person respectively in 2060.
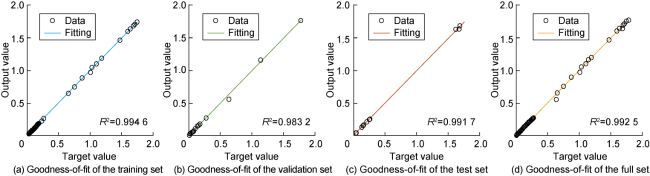
Fig. 2. Goodness-of-fit of BP neural network sample set. |
Table 2. Prediction of terminal effective energy consumption intensity for different sectors |
| Year | Terminal effective energy consumption intensity (tce/person) | ||||
|---|---|---|---|---|---|
| Households | Industrial sector | Construction sector | Transportation sector | Other sectors | |
| 2020 | 0.109 9 | 0.868 4 | 0.023 3 | 0.105 5 | 0.145 7 |
| 2025 | 0.127 4 | 0.954 7 | 0.025 5 | 0.117 9 | 0.153 0 |
| 2030 | 0.134 8 | 1.000 6 | 0.027 4 | 0.125 3 | 0.160 4 |
| 2035 | 0.138 6 | 1.028 2 | 0.028 5 | 0.130 4 | 0.164 8 |
| 2040 | 0.140 5 | 1.042 4 | 0.028 9 | 0.132 2 | 0.167 1 |
| 2045 | 0.141 5 | 1.050 4 | 0.029 1 | 0.133 2 | 0.168 4 |
| 2050 | 0.142 4 | 1.057 1 | 0.029 3 | 0.133 8 | 0.169 4 |
| 2055 | 0.143 2 | 1.062 8 | 0.029 4 | 0.134 1 | 0.170 4 |
| 2060 | 0.143 8 | 1.067 1 | 0.029 5 | 0.134 2 | 0.171 0 |
1.3.2. Total consumption of primary energy
The forecast results show that with the growth of population and terminal effective energy consumption intensity, the total consumption of primary energy in China will continue to rise from 2021 to 2035, reaching a peak of about (59.4-60.7)×108 tce by 2035 (Fig. 3 ). After 2035, with the decrease of population, the stabilization of terminal effective energy consumption intensity and the improvement of comprehensive energy efficiency, the total consumption of primary energy will decrease year after year, and it will drop to (54.1-56.7)×108 tce in 2060. Among the three scenarios, the total primary energy consumption in the carbon neutrality scenario is the lowest, because it benefits from technical advancement, increased electrification degree of terminal sectors, and improved comprehensive energy efficiency, which means that less primary energy needs to be provided for the same effective energy consumption demand at the terminal sectors, and the reduced demand for primary energy also contributes to the realization of emission reduction targets.
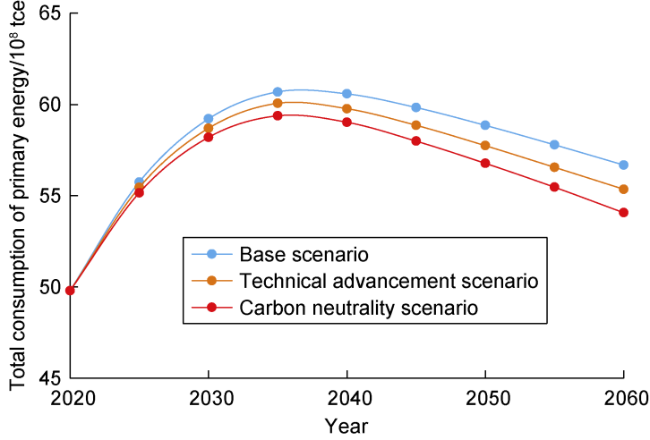
Fig. 3. Forecast of total primary energy consumption in China under different scenarios. |
In terms of energy mix, as the share of electricity and hydrogen in terminal sectors continues to increase, the share of non-fossil energy in energy consumption is also increasing, because non-fossil energy is mainly converted into electricity or hydrogen (hydrogen production through electrolysis of water with non-fossil energy) to be consumed by the terminal sectors (Figs. 4-6). Under the carbon neutrality scenario, when the carbon emissions from fossil fuel reach the limit, the model will choose non-fossil energy to fill the gap in electricity supply, so non-fossil energy will get the highest growth under the carbon neutrality scenario, and the non-fossil energy consumption will rise to 41.6×10⁸ tce in 2060 (Fig. 6 ), accounting for about 77.0% of the total primary energy consumption. The proportion of fossil energy consumption will overall continue to decrease in next decades, and coal contributes to the dramatic drop most. Coal consumption will drop to 3.3×10⁸ tce in 2060 under the carbon neutrality scenario, accounting for about 6.0% of total primary energy consumption in that year. The significant drop in coal consumption is essential for achieving the carbon emission upper limit of 25×108 t in 2060. Oil consumption grows slowly between 2021 and 2030, and shows a declining trend year by year after 2030. Oil consumption will drop to 3.5×10⁸ tce in 2060 under the carbon neutrality scenario.
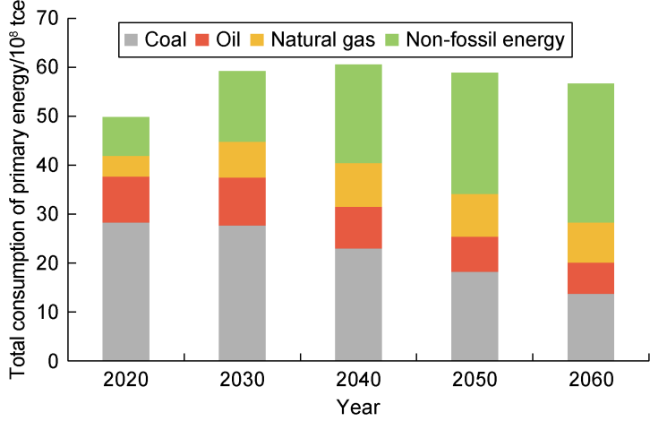
Fig. 4. Forecast of energy mix in China under the base scenario. |
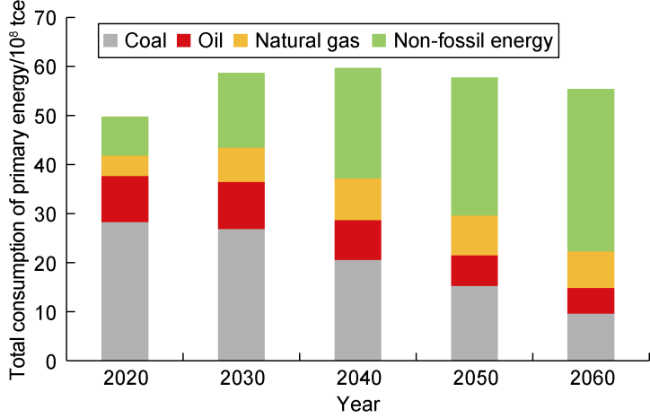
Fig. 5. Forecast of energy mix in China under the technical advancement scenario. |
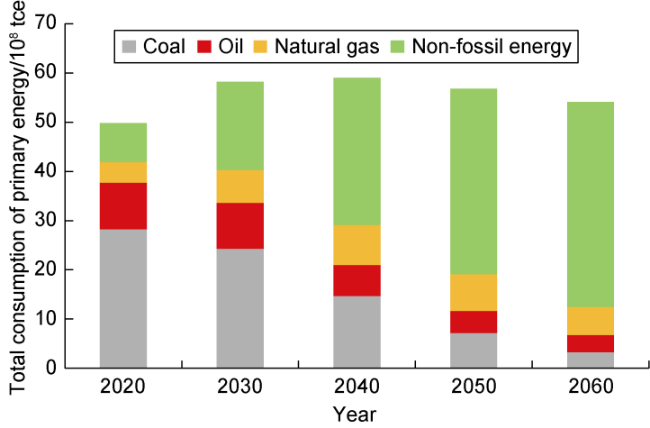
Fig. 6. Forecast of energy mix in China under the carbon neutrality scenario. |
1.3.3. Carbon emissions from energy consumption
The carbon emissions from energy consumption in China will reach a peak in 2025-2027. In the base scenario, the peak carbon emissions from energy consumption will be approximately 107.6×10⁸ t (Fig. 7 ). In the carbon neutrality scenario, because of the relatively small increase in total energy consumption and the significant increase in the share of non-fossil energy consumption, the carbon emissions from energy consumption will reach the peak sooner, about 103.4×10⁸ t in 2025. After the carbon emission peak, the share of coal and oil consumption will further drop, the share of non-fossil energy and natural gas consumption will further increase, and the carbon emissions from energy consumption will continue to decrease. By 2060, the carbon emissions in three scenarios will be reduced to 63.0×10⁸, 48.6×10⁸ and 25.0×10⁸ t respectively. The carbon emissions in both the base scenario and the technical advancement scenario will have declined significantly by 2060, but they still remain at a high level, so it’s impossible to achieve the carbon neutrality target under these two scenarios. As the carbon emission limit has been set in advance, the carbon emissions in the carbon neutrality scenario will decrease year after year strictly in accordance with the carbon emission limit. According to the assumption, the carbon emissions will be 25.0×10⁸ t in 2060, which will reach the carbon neutrality target.
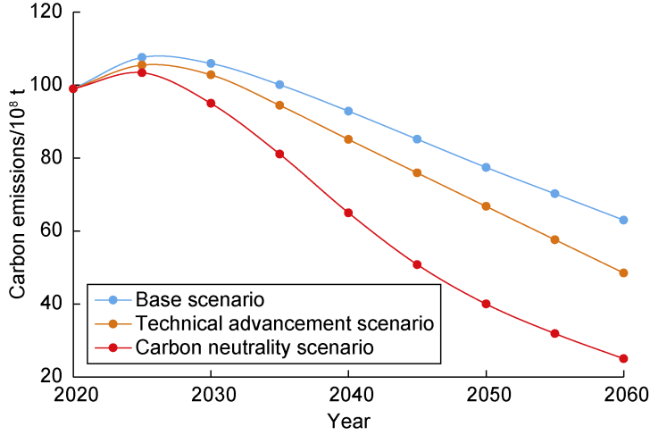
Fig. 7. Forecast of carbon emissions from energy consumption in China under different scenarios. |
In the carbon neutrality scenario, carbon emissions from energy consumption will reach the peak in 2021- 2025, during which the fossil energy consumption will keep growing and the peaking of coal consumption plays an important role in the peaking of carbon emissions from energy consumption; 2026-2035 is the initial stage of carbon emission reduction, during which it is expected that about 22×108 t of carbon dioxide will be reduced and about 28% of coal consumption will be replaced by other energies. In this stage, the growth rate of non-fossil energy consumption will not be sufficient to fully compensate for the energy shortfall caused by coal reduction, so natural gas as a clean and low-carbon energy source will see a major boom. The share of natural gas in energy consumption will rise to about 13% in 2035; 2036-2050 is the stage of in-depth emission reduction, during which it is expected that about 40×108 t of carbon dioxide will be reduced. The reduction of total energy consumption after the population peak provides favorable conditions for carbon emission reduction, and the growth of the proportion of electricity and hydrogen in terminal energy consumption and the improvement of comprehensive energy efficiency are also important stimuli of in-depth emission reduction; 2051-2060 is the crucial stage of emission reduction, during which about 15×108 t of carbon dioxide will be reduced, and eventually the goal of carbon neutrality will be achieved. In this stage, due to the further increase in the proportion of electricity and hydrogen in terminal energy consumption, which will rise to about 62% and 16% respectively, the industrial, transportation and power sectors will be fully decarbonized. Electricity and hydrogen energy are mainly produced from non-fossil energy, so it is expected that the non-fossil energy power (including the non-fossil energy power used for production of green hydrogen through electrolysis) will account for more than 80% of total power in 2060. The large-scale growth in non-fossil energy power has higher requirements for power grid, energy storage facilities, power for peak regulation and terminal electrification degree.
1.3.4. Natural gas consumption
Natural gas consumption will reach the peak value around 2040, with a peak of about 6700×108 m3 in the base scenario (Fig. 8 ), accounting for about 14.7% of total energy consumption. Due to the carbon emission limit and the relatively low total primary energy consumption, natural gas consumption under the carbon neutrality scenario is lower than that in the other two scenarios. Natural gas consumption in this scenario is expected to grow rapidly from 2021 to 2035. During this period, natural gas consumption rises sharply due to the combined effects of continuous growth in total energy consumption, a significant decrease in the share of coal in power generation, and continuous growth of domestic natural gas reserve and production, which plays an important role in bridging the energy consumption gap caused by coal reduction. The power generation sector will contribute the highest growth in natural gas consumption, with 1050×108 m3 of additional natural gas consumption during this period, accounting for about 43% of the total increase, followed by the industrial sector, which will consume about 680×108 m3 more natural gas, accounting for about 28% of the total increase. The natural gas consumption will plateau from 2036 to 2045. Since coal power will fall to a low level, non-fossil energy power will start to grow rapidly because of technology breakthroughs, and the new non-fossil energy power will be sufficient to compensate for the withdrawal of coal power during this period. Moreover, the total energy consumption will start to decrease year after year. Therefore, the growth rate of natural gas consumption will slow down and be stable at (5700-6100)×108 m3. Natural gas consumption will be declining after 2045, and the natural gas consumption market will be gradually replaced by non-fossil energy due to the carbon emission limit. To meet the carbon emission reduction target, the LEAP model replaces gas power with non-fossil energy power while optimizing the installed capacity of electricity, so that the natural gas consumption for gas power generation will continuously decrease from 2046 to 2060 by about 780×108 m3, followed by the industrial sector which will get a drop of about 440×108 m3, and the total natural gas consumption will drop to 4300×108 m3 in 2060.
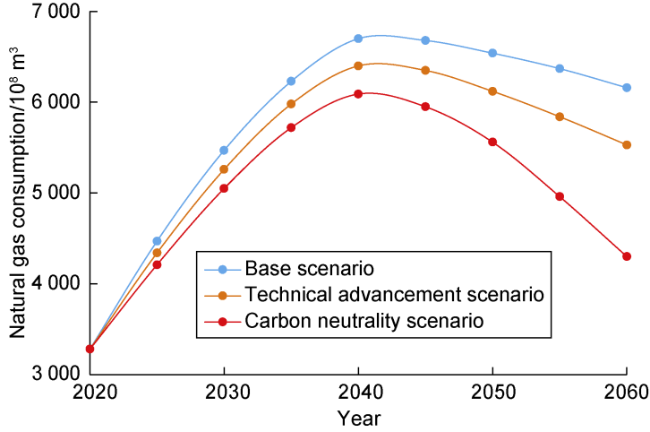
Fig. 8. Forecast of natural gas consumption in China under different scenarios. |
2. Forecast of natural gas production in China
2.1. Forecast method and scenario assumption
According to the forecast results of natural gas consumption in China, the natural gas consumption in the carbon neutrality scenario will peak at 6100×108 m3 (Fig. 8 ), and the natural gas consumption in 2060 will remain above 4000×108 m3, which is still higher than the predicted peak natural gas production in China, so the upstream natural gas production in China is not influenced by the Dual Carbon Target, and the domestic natural gas production should be as much as possible to meet the demand of natural gas consumption. The current methods for predicting natural gas production mainly include the Weng’s Model, Grey-Hubbert Model, production composition method, reserve-production ratio control method and analogy method. In this paper, the more widely used production composition method was used to forecast the natural gas production in China from 2021 to 2060.
With gas field/block as the basic unit, the production composition method is used to forecast natural gas production based on key parameters including the reserve base of different types of gas reservoirs and the production pattern of different types of gas reservoirs at different stages of development, and the production of each unit is aggregated to predict natural gas production in China [14⇓-16]. Many parameters can affect the prediction results in the production composition method, and the prediction results vary widely with different parameter settings, so three scenarios were defined in this paper, including the base scenario, the exploration and development (E&D) technical advancement scenario, and the E&D technical breakthrough scenario. The parameter settings of different scenarios are shown in Table 3 .
Table 3. Parameters for the three natural gas production forecast scenarios |
| Type of natural gas | Resources/ 1012 m3 | Current proven rate/% | Current remaining proven recoverable reserves/ 1012 m3 | Parameters for the base scenario in 2060/% | Parameters for the E&D technical advancement scenario in 2060/% | Parameters for the E&D technical breakthrough scenario in 2060/% | ||||||
|---|---|---|---|---|---|---|---|---|---|---|---|---|
| Proven rate | Reserve utilization rate | Recovery degree | Proven rate | Reserve utilization rate | Recovery degree | Proven rate | Reserve utilization rate | Recovery degree | ||||
| Conventional gas | 146.96 | 11.48 | 4.88 | 23.0 | 53.0 | 40.0-50.0 | 24.5 | 55.0 | 42.5-52.5 | 26.0 | 57.0 | 45.0-55.0 |
| Shale gas | 105.72 | 1.91 | 0.39 | 18.5 | 40.0 | 25.0 | 20.0 | 42.0 | 27.0 | 21.5 | 44.0 | 29.0 |
| CBM | 28.08 | 2.61 | 0.31 | 10.0 | 42.0 | 30.0 | 12.0 | 44.0 | 32.0 | 14.0 | 46.0 | 34.0 |
Currently, more than 540 gas fields have been developed in China, which are located in the basins including Ordos, Sichuan, Tarim, South China Sea, Qaidam, Bohai, East China Sea, Jungar and Songliao, etc. The development stages of different basins vary widely, so the gas fields are divided into developed gas fields and new exploration fields according to the proven degree of their reserves, and into conventional gas (including tight gas), shale gas and coalbed methane according to types of gas reservoirs. The new proven reserves of different types of gas reservoirs during the forecast period are drawn from the data in relevant research papers [14]. Some of the proven reserves are located in environmental protection areas, unprofitable areas, or the areas that cannot be fully utilized during the forecast period due to the productivity construction progress, so a new parameter, reserve utilization rate, is proposed. The reserve utilization rate of different types of gas reservoirs refers to the experience of gas fields (Table 3 ). For the production performance of different types of gas reservoirs, the production law of the developed gas reservoirs is taken as a reference. For example, the annual decline rate of conventional gas reservoirs is assumed to be 6%-20% (6%-12% for carbonate gas reservoirs and deep high-pressure gas reservoirs, and about 20% for tight gas reservoirs) [15], that of shale gas reservoirs is assumed to be 35%, and that of coalbed methane reservoirs is assumed to be 25%. In addition, the recovery degree of different types of gas reservoirs during the forecast period refers to the empirical recovery degree of developed gas reservoirs and cannot be higher than the maximum recovery factor of the same type of gas reservoirs specified in the petroleum industry standard Calibration Method of Recoverable Reserve [17]. For example, the recovery degree of conventional gas reservoirs is assumed to be 40%-55% (50%-55% for carbonate gas reservoirs and deep high-pressure gas reservoirs, and 40%-45% for tight gas reservoirs), 25%-29% for shale gas reservoirs, and 30%-34% for coalbed methane reservoirs.
2.2. Forecast results and analysis
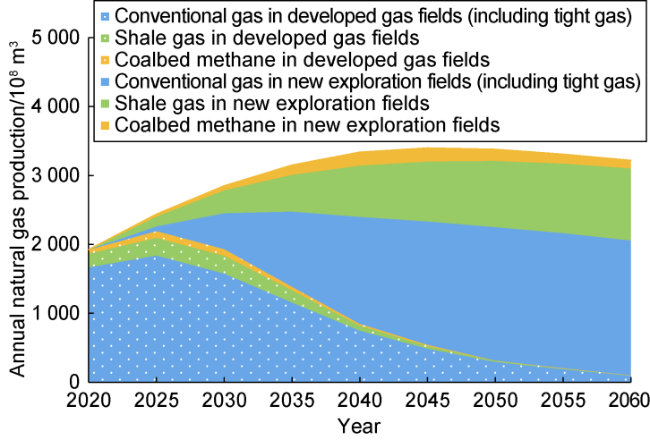
The forecast results show that the accumulative production of developed gas fields during the forecast period will reach (4.1-4.5)×1012 m3, and the accumulative production of new exploration fields will reach (5.8-8.2)×1012 m3, of which the production under the base scenario is lower than that under the other scenarios due to the lower proven rate of reserve, reserve utilization rate and the recovery degree during the forecast period. Under the base scenario, the annual gas production will peak at about 2800×108 m3 in 2035 and drop to 1550×108 m3 in 2060 (Fig. 9 ). Under the E&D technical advancement scenario, the extensive use of new technologies drives continuous growth in natural gas reserve and production, with production peaking at 3100×108 m3 in 2040 and remaining above 2300×108 m3 in 2060 (Fig. 10 ). Under the E&D technical breakthrough scenario, the technical breakthroughs in exploration lead to growth in new proven reserve to 43.7×10¹² m3, and technical breakthroughs in development field lead to growth in new utilized reserve in new exploration fields to 21.9×10¹² m3, the average recovery degree will increase to 38.1%, and the production will increase to 3400×108 m3 in 2045 (Fig. 11 ).
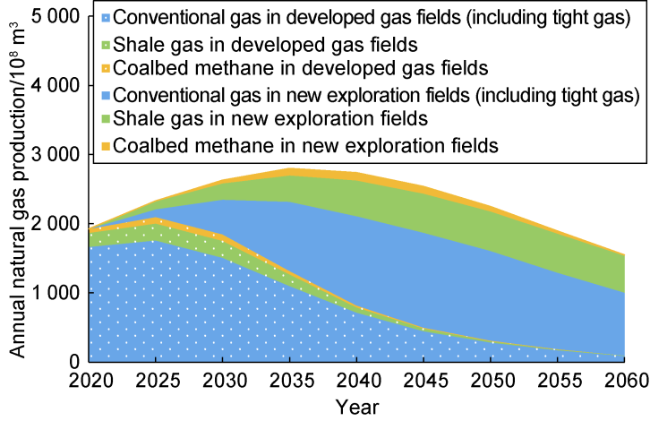
Fig. 9. Forecast of natural gas production in China under the base scenario. |
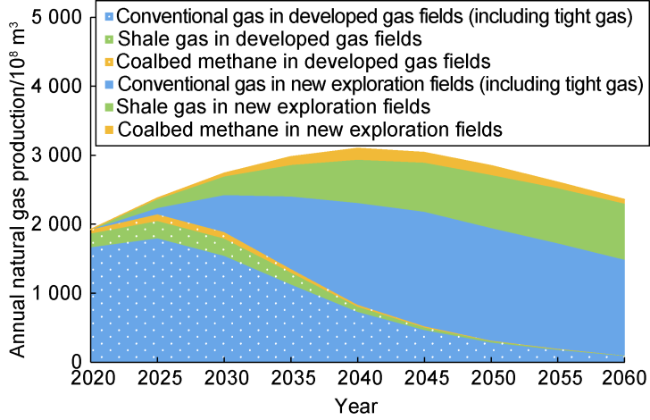
Fig. 10. Forecast of natural gas production in China under the E&D technical advancement scenario. |
Fig. 11. Forecast of natural gas production in China under the E&D technical breakthrough scenario. |
The production during the forecast period varies for different types of gas reservoirs under different forecast scenarios. The annual conventional gas production (including tight gas) peaks at (2100-2300)×108 m3, the annual shale gas production peaks at (600-1050)×108 m3, and the annual coalbed methane production peaks at (150-220)×108 m3. Conventional gas will always play a critical role in natural gas production, with a contribution rate of more than 60%, while shale gas will be the key to production growth, with new production accounting for more than 35% of the total new production when production reaches its peak. The model does not predict the production of gas hydrate, and future breakthroughs in gas hydrate exploration and development technologies are expected to further stimulate gas production growth.
3. Reflection and suggestion
3.1. Building a new energy system of “non-fossil energy + natural gas + electricity + hydrogen”
To achieve the emission reduction target, the energy mix in China has to be decarbonized. With the total primary energy consumption increasing and coal consumption decreasing significantly, it is crucial to build a new energy system of “non-fossil energy + natural gas + electricity + hydrogen”. Under the carbon neutrality scenario, non-fossil energy and natural gas are the primary energy sources with great potential of growth, which are expected to represent about 87% of the total primary energy consumption in 2060, while electricity and hydrogen is the important secondary energy, which is expected to represent about 78% of the terminal energy consumption in 2060. However, due to the limitation of materials, technology and cost, the growth of non-fossil energy consumption in the short term is not fast enough to meet the urgent need for substantial coal reduction. Wind power and photovoltaic power generation are also subject to weather and environmental factors, and their power outputs are discontinuous and unstable, while natural gas power generation is more stable and flexible. Therefore, natural gas should complement non-fossil energy sources to maximize its role of power stabilization and peak regulation. In addition, the utilization rate of non-fossil energy can be improved by converting unstable non-fossil energy into stable chemical energy in hydrogen through production of green hydrogen by water electrolysis based on non-fossil energy power. This shows that the emission reduction target has pushed the rapid growth of non-fossil energy and natural gas consumption, and the efficient utilization of non-fossil energy and natural gas at the terminal sectors has contributed to the rapid growth of electricity and hydrogen energy. These four energy sources will complement each other and become the pillars of the future energy consumption system in China.
3.2. Increasing terminal consumption of natural gas
Natural gas consumption in China is expected to continue to grow from 2021 to 2040, so it makes sense to take advantage of the critical growth period over the next 20 years to expand the share of natural gas in terminal energy consumption and enlarge the role of natural gas in reducing carbon emissions. Urban gas and industrial gas have been the main drivers of natural gas consumption growth in recent years. To continue to ex-pand the use of urban gas and industrial gas, it is still necessary to take advantage of clean heating in winter policy and coal-to-gas conversion policy in northern China to accelerate the replacement of coal boilers with gas boilers, and to replace coal with natural gas for fuels in industrial furnaces. Since the price of natural gas is higher than that of coal, financial subsidies can be provided for gas boilers and gas furnaces to drive continuous growth in demand for urban gas and industrial gas. Gas power generation is currently the third largest gas-consuming sector in China. Under the carbon neutrality scenario, new gas power will replace some of the coal power and become a new engine driving the growth of natural gas consumption in China. However, the current share of gas power in total power in China is relatively low, at 0.25×10⁸ kW•h in 2020, representing only 3.2% of the total compared to 40.6% in the U.S., 36.5% in the U.K., and 23.4% in the world by average, which is obviously a huge gap. Compared with coal power, hydro-power, and non-fossil energy power, gas power in China is at a disadvantage in terms of the installed capacity and cost, and the cost of gas power generation has remained high at 0.55-0.60 yuan/(kW•h), which has seriously inhibited the growth of gas power in China. To drive high-quality growth of gas power, a clear development plan for gas power should be formulated at the policy level, appropriate subsidies should be provided for gas power, and technical innovation should be stepped up to enable localization of core components of gas turbines so as to reduce the cost of gas power generation [18].
3.3. Driving continuous expansion of reserve and production of natural gas
Measures should be taken to accelerate sustained growth of natural gas reserve and production through theoretical and technical innovation to ensure national energy supply. To maintain high-level growth of natural gas reserve and production in China, upstream production should focus on: (1) Increasing investment in natural gas exploration and consolidating the reserve base. The overall proven rate of natural gas reserve in China is less than 10%, which is relatively low [14], and natural gas reserves still have huge potential for growth. In the future, we need to further intensify exploration of gas resources in marine carbonate formations, continental deep strata of the foreland thrust belt, lithologic oil and gas reservoirs, marine areas and unconventional gas reservoirs, and try to find new gas resources with high-quality for gas field development. (2) Stick to theoretical and technical innovation to enable effective development of gas reservoirs in deep strata, gas reservoirs in deep water areas, unconventional gas reservoirs and other complex types of gas reservoir [19⇓-21]. For deep and ultra-deep gas reservoirs, we should strengthen the research and development of ultra-deep high-precision three-dimensional seismic imaging technology, safe and rapid drilling technology, ultra-deep oil and gas layer identification technology, and ultra-deep fracturing stimulation technology; for marine gas reservoirs, marine oil and gas geophysical prospecting technology should be further developed, and development of marine drilling engineering technology and equipment should be promoted; for shale gas reservoirs, apart form steadily advancing the efficient development of marine shale gas in medium-shallow strata, new technologies for exploration and development of deep shale gas should be developed, and technological breakthroughs in rotary steering, high-precision evaluation of sweet-spot interval, and intensive and efficient fracturing of long horizontal sections should be made; for tight gas, the key is to develop recovery enhancement technologies that focus on multi-layer stereoscopic development, in-situ water prevention and control during gas production, and well-type and well-pattern optimization; for coalbed methane, the key is to strengthen technical research and development of coalbed methane in medium and low rank coal seams, fragmented soft and low-permeability coal seams, and deep coal seams. (3) Policy subsidies should be implemented in parallel with low-cost development. Adhering to low-cost development, unconventional natural gas resources with low or no economic benefits will be developed in an economical and effective manner through technical innovation, while policy subsidies will be provided to help drive sustainable development of unconventional natural gas.
3.4. Improving the production, supply, storage and marketing system for natural gas
Under the carbon neutrality scenario, the natural gas consumption in China will continue to grow. To meet the demand for natural gas, infrastructures that support the growth of natural gas consumption should be deployed in advance, and the production, supply, storage and marketing system for natural gas should be gradually improved. Specific suggestions include: (1) Improving the import capacity of the four major natural gas import routes. Currently, the three major onshore natural gas import routes (Central Asia ABC Pipeline, China-Russia Pipeline and China-Myanmar Pipeline) have not yet reached their designed transportation capacity, and in the future, the feasibility of constructing other import pipelines such as the China-Russia Western Gas Pipeline should be discussed while continuing to make up the designed transportation capacity of pipelines according to the agreement. In addition, measures should be taken to continue to expand the coastal LNG (liquefied natural gas) receiving stations and enhance the LNG receiving and offloading capacity. (2) Further integrating domestic pipeline networks, strengthening the interconnection of import pipelines, domestic trunk pipelines, regional pipeline networks, LNG receiving stations, underground gas storage and other facilities to build a “national network”. PipeChina will be responsible for natural gas coordination and dispatch across the country, and all parties should cooperate with each other to ensure the national energy supply. (3) Currently, the emergency storage capacity of natural gas in China is slightly inadequate, and the storage capacity of underground gas storage, LNG receiving stations and LNG storage tanks, and the peak regulation capacity of gas fields should be continuously improved in accordance with the requirement for natural gas emergency storage of “gas storage of no less than 10% of the annual contract sales for gas suppliers, no less than 5% of the annual gas consumption for urban gas companies, and no less than 3 d of gas consumption for local governments in their jurisdictions” as proposed in the Opinions on Accelerating Construction of Gas Storage Facilities and Improving the Market Mechanism of Gas Storage and Peak Regulation Auxiliary Services [22] issued by China Development and Reform Commission. (4) The Opinions on Promoting the Coordinated and Stable Development of Natural Gas [23] issued by the State Council states that the construction of natural gas production, supply, storage and marketing system should be accelerated to strike the balance of natural gas supply and demand. The natural gas industry should manage all aspects of production, supply, storage and marketing in a meticulous manner, and establish and improve the institutional mechanism for coordinated and stable development focusing on supply and demand forecast and early warning mechanism, comprehensive coordination mechanism, demand side management and peak regulation mechanism, and market-based price mechanism, so as to promote the healthy and orderly development of the whole industry chain.
4. Conclusions
The BP neural network-LEAP model, which is established by combining the BP neural network and the LEAP that is improved by introducing two new parameters of comprehensive energy efficiency and terminal effective energy consumption, has been proved to be a reliable model through fitting of historical data and can be used for forecasting future energy consumption. With the carbon emission limit taken into account, the prediction results are in line with the trend of natural gas consumption in the context of Dual Carbon Target.
Under the carbon neutrality scenario, the total primary energy consumption in China will peak at about 59.4×10⁸ tce around 2035, and gradually decrease after 2035, finally drop to 54.1×10⁸ tce in 2060; the carbon emissions from energy consumption in China will peak at about 103.4×10⁸ t in 2025, and drop to 25.0×10⁸ t in 2060.
The natural gas consumption in China features three stages under the carbon neutrality scenario. The period from 2021 to 2035 is the stage of rapid growth in natural gas consumption, with the power generation and industrial sectors seeing the highest growth; the period from 2035 to 2045 marks the plateauing of natural gas consumption, and after 2045, natural gas consumption will decline due to carbon emission limit.
Natural gas production in China is expected to peak around 2040 with annual gas production of about (2800- 3400)×108 m3. The conventional gas (including tight gas) is still the dominant natural gas production, and shale gas production will register the most significant growth.
Nomenclature
Etv—terminal effective energy consumption, tce;
Et—terminal energy consumption, tce;
Es—total consumption of primary energy, tce;
m—number of output vectors in output layer;
n—number of input vectors;
x—input vector, x={x1, x2, …, xn};
y—expected vector, y={y1, y2, …, ym};
$\tilde{y}$—output vector of the output layer,$\tilde{y}=\{\tilde{y}_{1},\tilde{y}_{2},\cdots, \tilde{y}_{m}\}$;
αc—share of non-fuel chemical products in terminal energy consumption, %;
αe—share of electricity in terminal energy consumption, %;
γc—share of non-fuel chemical products in terminal effective energy consumption, %;
γe—share of electricity in terminal effective energy consumption, %;
ζ—comprehensive energy efficiency, i.e., the coefficient that integrates the energy conversion efficiency and energy work efficiency, %;
ζe—comprehensive efficiency of electricity, %;
ζf—comprehensive efficiency of terminal fuels, %;
θ—transmission loss rate of the power grid, %;
λ—energy conversion efficiency, %;
λc—conversion efficiency of non-fuel chemicals, %;
ω—work efficiency after energy conversion, %;
ωe—work efficiency of electricity, %;
ωf—work efficiency of terminal fuels, %.