

Introduction
In 2020, a significant breakthrough was made in the Gulong oil shale by drilling Well GYYP1 in the Gulong Sag of the Songliao Basin. The Gulong Oil Shale was pure shale containing shale oil in the Cretaceous Qingshankou Formation, changing the perception of low gas-to-oil ratio and obtaining a high-yielding industrial oil flow of 30.5 t of oil and 13 032 m3 of gas per day [1-2]. Meanwhile, the definitions of "Gulong shale" and "Gulong shale oil" were clarified [1]. In 2021, the national demonstration area of Daqing Gulong Onshore Shale Oil passed the defence [3]. Based on the resource characteristics and the exploration and development status of Gulong shale oil, six key scientific questions have been proposed: "source of organic matter and hydrocarbon formation mechanism of Gulong shale, reservoir spatial structure and type, mineralogical evolution characteristics, mechanical properties, modification mechanism for production enhancement, shale oil production and phase, and shale oil recovery enhancement" [2]. To address the issues, many scholars have made significant research progress in controlling factors of lithology and physical properties, reservoir classification, in-situ reservoir formation mechanism, shale oil geological reserve estimation, shale oil occurrence state, mechanical properties, and hydraulic fracturing design, development plan optimization, etc. [4⇓⇓⇓-8]. These studies effectively guide the construction of a national demonstration area and assist the exploration and development of Daqing Gulong onshore shale oil.However, due to the geological complexity and heterogeneity of Gulong shale oil, problems still exist, such as the unclear mechanism of hydrocarbon generation evolution of organic matter, the unresolved genetic mechanism of pore and fracture and their distribution regularities, difficult classification evaluation of the enrichment layers, unclear control factors of shale oil production variation, all of which restrict sizable reserve increase and effective development of Gulong shale oil. To mitigate the issues, based on massive experimental analyses and field production test data, this paper systematically summarizes the last two years' study results in the Gulong shale in the following aspects: hydrocarbon evolution of organic matter and shale oil occurrence state, joint control mechanism on pore and fracture by shale diagenesis and organic matter evolution, enrichment layer classification evaluation, shale oil production characteristics and production decline regularity. Furthermore, facing the current challenges of exploration and development, we point out the directions for future research to enrich the theory of exploration and development of shale oil in China, provide necessary theoretical and technical support for the large-scale development of Gulong shale oil, and provide critical support for national energy security.
1. New progress in Gulong shale oil exploration and development
The Songliao Basin is a typical terrestrial fault-depression lake basin with an area of about 26×104 km2. Large-scale flooding in the lake occurred during the depositional period of the Upper Cretaceous Qingshankou Formation, leading to a wide distribution of semi-deep lacustrine or deep lacustrine deposits. The lithology of the deposits is mainly of shale, followed by mudstone intercalated with thin layers of dolomite, bioclastic limestone, and siltstone. The thickness of shale accounts for more than 95% of the total [2⇓-4]. Stratigraphically, the Gulong shale oil enrichment layer is mainly distributed in the lower part of the Qingshankou Formation, the first and second members of the Qingshankou Formation. They are divided into 9 oil layers (Q1-Q9) from bottom to top according to deposition cycles, lithology, mineral composition, TOC, etc. The first member of the Qingshankou Formation can be subdivided into 6 oil layers (Q1-Q6), and the lower part of the second member can be subdivided into 3 oil layers (Q7-Q9). The cumulative thickness of the Q1-Q9 oil layer is 100-150 m, with oil shown in all nine oil layers (Fig. 1 ).
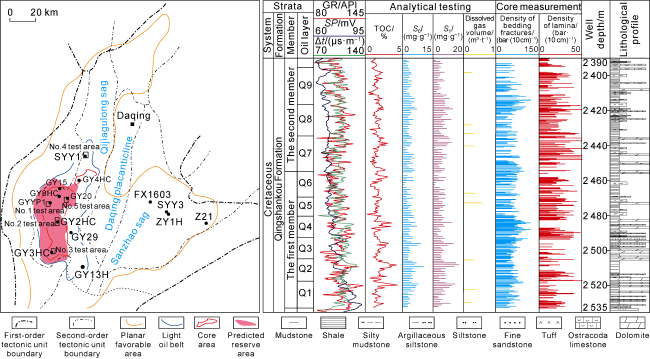
Fig. 1. (a) Map of the current status of exploration and development of Daqing Gulong shale oil and (b) comprehensive stratigraphic column. |
On the map view, the area of Gulong shale oil sweet spots is 1.46×10⁴ km2 (Ro>0.75%, TOC>1%, shale thickness larger than 60 m). The geological resources of shale oil are (100-150)×108 t. The area of light oil sweet spot is 2778 km2 (Ro>1.4%). The density of surface crude oil is less than 0.83 cm3/g (20 °C), the viscosity of surface crude oil is less than 10 mPa•s (50 °C), the gas-oil ratio is 50-450 m3/m3, and the pressure coefficient is 1.4-1.6 [9] (Fig. 1 ). In 2021, 12.68×10⁸ t of added oil geological reserves and 3159.06×108 m3 of natural gas geological reserves are predicted (Fig. 1 ). In the past two years, five groups of development test wells have been deployed in the critical area of the Gulong Sag Light Oil Belt according to the differences in geological characteristics. By extensive comparisons of oil tests and production tests, the optimal target layer is determined to be Q2-Q3 and Q9 oil layers. The reasonable development well spacing is above 400 m, the optimal horizontal section length is about 2000 m, and the well deployment method is a "two-way staggered platform and vertical W shape well network." The horizontal well drilling period was shortened from 119 d initially to only 13.77 d. Experiments are conducted to test hydraulic fracturing technologies and parameters and build learning curves, which are needed to improve oil production. Honoring the transformation concept of achieving an adequate single-cluster transformation, an enormous single-well transformation volume, and the largest single-well EUR, the Gulong Fracturing 2.0 technology is determined after two rounds of iterations. The strategy includes reverse mixing, high viscosity primary fluid, extensive particle size support, CO2 front, and fewer clusters in the horizontal sections. After deploying the new technology, comprehensive oil occurrences are observed in the straight and horizontal wells after fracturing.
At present, Well GYYP1 has been in production in the Gulong shale for more than 900 d, with the cumulative oil and gas equivalent production of 1.4×10⁴ t and an initial annual declining rate of only 14.5%. Another 10 horizontal wells are drilled in the key area of the Gulong shale oil light oil belt, with initial daily oil production of 15.6 t to 34.9 t and stable production of about 10 t/d to 15 t/d after 1 year of production. Compared with the discovery well, the Well GYYP1, the 10 horizontal wells show the characteristics of early oil appearance, low oil backflow rate, and high EUR of single well (all greater than 2.0×10⁴ t). Therefore, the wells carry better economic efficiency, achieving more effective development.
2. Hydrocarbon generation evolutionary characteristics of the Gulong shale
2.1. Definition of Gulong shale/shale oil
The Gulong shale is a deep-water fine-grained and laminated rock system with a certain degree of maturity and diagenetic evolution. The shale is located in the terrestrial strata of the Songliao Basin and is rich in organic matter. Gulong shale oil is enriched in this rock system and has economic development value after artificial modification [1].
Stratigraphically, Gulong shale oil is mainly concentrated in the Upper Cretaceous Qingshankou Formation and Nenjiang Formation, particularly in the Qingshankou Formation. Spatially, the shale oil is mainly concentrated in the Qijia-Gulong Sag, Sanzhao Depression, and the southern part of Daqing placanticline, with the Qijia-Gulong Sag as the main focus in the Gulong area recently. Lithology-wise, five major lithology types are developed: shale (bedded and laminated), mudstone, siltstone, limestone, and dolomite.
2.2. Geochemical characteristics
The Gulong shale is organic-rich shale deposited in the Late Cretaceous after large-scale lake flooding of the Songliao Basin. The carbon isotopic composition of the organic-rich shale at the bottom shows a noticeable positive deviation, with an average initial productivity of 1 243.1 g/(m2•a) [10-11]. The lake is characterized as a medium-oxygen-rich lake with a low deposition rate, paleosalinity mainly of freshwater-saline, robust reducing environment, and low sulfate content, all of which benefit the preservation of organic matter. The main TOC value is 1.81%-2.74%, the maximum value is 12.33%, and the average value is 2.64% [11]. The organic matter type is mainly type I, partly type II1. The organic matter source is mainly laminar algae, accounting for more than 85% of the organic matter composition. The carbon isotope composition of the kerogen is light, dominantly ranging from -30.5‰ to -28.1‰, with an average value of less than -28.0‰ [12]. The Ro values in the favorable areas range from 0.75% to 1.67%, with most areas of the Gulong Sag having Ro values greater than 1.0%. Therefore, the shale is at the mature-high maturity thermal evolution stage with high HI (Fig. 2 ). The infrared and maceral analysis of the kerogens on polished surfaces of entire rocks shows laminar algae's high fatty carbon content [12].
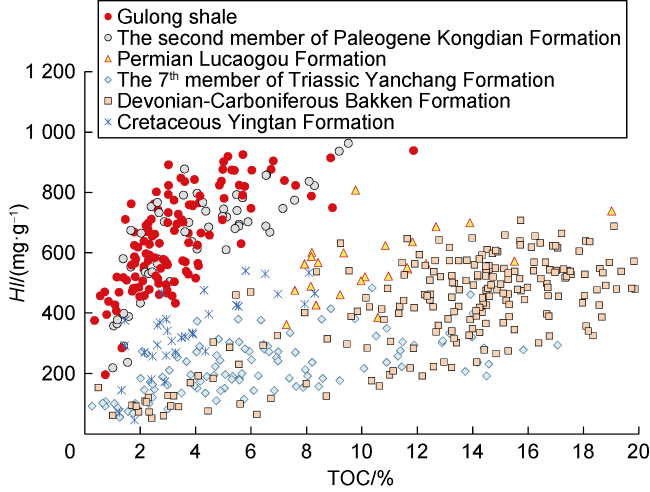
Fig. 2. Relationship between TOC and HI for Gulong shale, other shale formations. |
2.3. Hydrocarbon generation and expulsion
According to previous studies, shale has an oil expulsion efficiency of 70% during the peak oil production period and a total oil expulsion efficiency of more than 80% [13⇓-15]. In this study, the water-bearing hydrocarbon generation, discharge, and retention simulation experiment were improved by reducing the water supply, using a plunger sample, and adopting a "sandwich" structure (shale in the middle and quartz sand on the top and bottom) to make the experimental conditions closer to the subsurface hydrocarbon generation and discharge environment in the formation. The experimental results show that the Ro values in the generation, discharge, and retention windows of the Gulong shale are mainly 0.9%- 1.6% [16]. In contrast, the Ro values of the leading generation, expulsion, and retention peaks are 1.1%-1.3%. The generated oil is generally greater than 20 mg/g, peaking at 61.2 mg/g. The amount of retention oil is generally greater than 18 mg/g, with the main peak at 49 mg/g. The amount of discharge oil is generally greater than 4 mg/g, with the main peak at 12.9 mg/g. Compared with the Tissot classical oil generation model, the Gulong shale has a wide range of maturity in the oil generation, discharge, and retention windows. The shale can still generate oil when the Ro value reaches 1.9%. The generated oil is 22% of the amount at the peak oil generation. The average oil discharge efficiency during the peak oil production period under experimental conditions is only about 20%, much lower than the results of conventional water-bearing simulation experiments. Although the hydrocarbon discharge efficiency under experimental conditions cannot fully represent the hydrocarbon discharge efficiency of shale under formation conditions, it also indirectly reflects that the hydrocarbon discharge efficiency of shale under proper formation conditions is lower than previously thought.
The analysis of the chloroform bitumen "A" and oil content in the pressure-preserved cores of the Gulong shale shows that the total retained oil (free oil + adsorbed oil) of the Gulong shale can still reach up to 600 mg/g at Ro values of 1.2%-1.6%. The calculated average oil discharge efficiency is less than 50% [10]. On the other hand, by the rock pyrolysis analysis before and after chloroform extraction of Gulong shale with different maturity [6], the HI value of the extracted shale decreases significantly after entering the oil generation window, reflecting the presence of a large amount of adsorbed heavy hydrocarbons. By establishing and applying the calculation model of hydrocarbon expulsion efficiency based on the correction of light and adsorbed hydrocarbons, the results show that the hydrocarbon removal efficiency of the shale of the Qingshankou Formation increases with the increase of maturity. The maximum hydrocarbon expulsion efficiency is 49.5%, and the Ro value is 1.0% to 1.2% when the shale enters the period of massive hydrocarbon discharge. The existing studies also show that in the high maturity stage, due to the influence of hydrocarbon discharge, diagenetic evolution, and the increase of overburden pressure [17-18], the shale-containing formation tends to form a self-contained environment and no longer discharges hydrocarbons. The hydrocarbon expulsion efficiency does not change much.
2.4. Shale oil occurrence state and evolutionary pattern
The occurrence states of shale oil are mainly free and adsorbed (or mutually soluble) [19-20]. The free oil is commonly estimated by the rock pyrolysis S1 quantification method [20]. The adsorbed oil is evaluated by the difference in rock pyrolysis S2 before and after organic solvent extraction. Previous studies have shown that the difference in rock pyrolysis S2 before and after chloroform extraction of the Gulong shale is essentially the same as the difference between chloroform bitumen "A" and S1. Therefore, the adsorbed oil can also be analyzed quantitatively [21]. This study decomposed the retained oil in the hydrocarbon generation thermal simulation experiment. The peak value of free oil generation comes to at Ro of 1.3%, and the peak value of adsorbed oil generation comes to at Ro of 1.1%, indicating that the peak of free oil generation lags behind that of adsorbed oil. Based on the material balancing principle in hydrocarbon generation, most of the free oil was formed by the cracking and conversion of adsorbed oil. However, a small amount of hydrocarbon was also generated by kerogen cracking. Based on a large amount of measured S1 data and chloroform bitumen "A" data from the Gulong shale, integrated with the oil content measurement results of the pressure-preserved cores for light hydrocarbon correction, we established the oil occurrence and evolution model of the Gulong shale [22] (Fig. 3 ). The model shows three stages of evolution: (1) The initial generation stage. Ro value is less than 0.9%, and the oil is mainly produced by the kerogen. The free oil accounts for 20%-40% of the retained oil. Therefore, the occurrence state is mainly adsorbed oil. (2) The oil generation stage. The Ro value at this stage is 0.9%-1.6%, and the adsorbed oil is converted to free oil in large quantities. The free oil accounts for 40%-80% of the retained oil. (3) The cracking stage. The value of Ro in the cracking stage is greater than 1.60%,and the shale oil starts to crack into gas. By quantifying the free oil and adsorbed oil in the kerogen and mineral matrix and pores and fractures [6] respectively, applying a Ro cutoff value of 1.0%, it is found that two transformation processes of the Gulong shale oil occurrence state occur: (1) in the middle and low evolutionary stage, the shale oil transforms from mainly in the kerogen to mainly in the rock and organic pores (organic clay composite pores [11]). (2) In the middle and high evolutionary stage, the shale oil transforms from the adsorbed state to the free state.
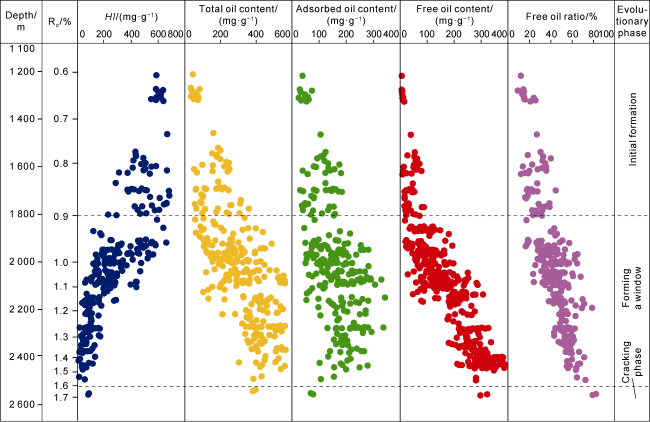
Fig. 3. Occurrence state and evolutionary pattern of Gulong shale oil (modified from the Reference [22]). |
3. Pores and fractures of the Gulong shale reservoirs
3.1. Characteristics of pores and fractures in shale reservoirs
The Gulong shale mainly comprises fine-grained detrital minerals such as quartz, clay minerals, feldspar, and a small amount of calcite with a particle size of less than 3.9 μm. The overall petrological characteristics show high clay mineral content, low carbonate, and high feldspathic mineral content. Previously, much research has been conducted on the type of reservoir space and properties. The dual reservoir space is believed to mainly consist of micron-nanometer matrix pores, bedding fractures, and microfractures [3-4]. The matrix pores include intergranular pores of clastic minerals, intergranular pores of clay minerals, organic matter pores, and dissolution pores. The nitrogen adsorption analysis and high-pressure mercury displacement show that matrix pores are mainly distributed between 10 nm and 30 nm in diameter. Shale bedding fractures, especially horizontal fractures, are developed. Based on the core observation, the spacing of fractures is 1000 to 3000 per meter. Based on the field emission scanning electron microscopy observation, the fracture spacing is more than 1000 per meter, the fracture length is 200 to 5000 nm, and the fracture width is 50 nm to 150 nm. The helium core measured porosity is 8.4% to 9.1%, of which the pore diameters of 2 to 16 nm accounted for 46.2%, pore diameters of 16 to 128 nm accounted for 27.5%, and pore diameters of 128 nm or more accounted for 26.3% (as illustrated in Fig. 4 ). The gas-measured horizontal permeability is (0.01-0.50) × 10−3 μm2, and the vertical permeability is (0.001-0.050) × 10−3 μm2. The horizontal permeability is generally about 10 times the vertical permeability.
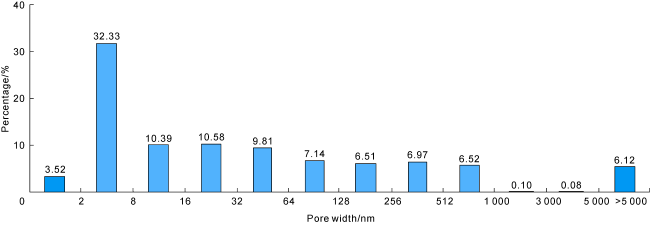
Fig. 4. Histogram of the pore size distribution of the Gulong shale oil. |
3.2. Shale reservoir pore and fracture-forming mechanism
The results of thin section analysis, X-ray diffraction analysis, and field emission scanning electron microscopy analysis were combined with TOC, Ro, and other analytical data to explore the relationship between shale diagenesis, organic matter evolution, and pore evolution in the Qingshankou Formation, and to establish a model of shale diagenesis.
The shale is immature in the early diagenetic stage, with Ro<0.5%. Intergranular pore space dominates the reservoir space and is mainly affected by mechanical compaction. The porosity decreases, accompanied by compaction drainage. The water flow within the reservoir carries a large amount of calcium and magnesium ions, causing mineral cementation. The clay minerals are mainly dominated by montmorillonite in this period, with a lean transformation to illite.
The characteristics of the reservoir evolution can be roughly divided into two stages: (1) Early hydrocarbon generation stage. Ro value is 0.50%-0.75%. Reservoir formation is still dominated by mechanical compaction and cementation. Clay minerals are mainly I/S mixed layers with a small amount of montmorillonite. (2) Large amount of hydrocarbon generation stage. Ro value is 0.75%-0.90%. Organic matter generates oil in large amounts. Organic pores are present in the organic matter. Dissolution pores are also present following the organic acid dissolution. However, since the organic matter has not reached the peak hydrocarbon production, inorganic pores such as intergranular and intergranular pores are still dominant in the reservoir. At this stage, montmorillonite is not visible. I/S mixed layer and illite are dominant. The clay minerals are gradually transformed into lamellar illite with directional arrangement and distribution as mechanical compaction is enhanced and thermal evolution increases, leading to changes in the crystal lattice. During the clay mineral transformation process, many clay intergranular pores and fractures are formed between illite and limonitic minerals (Fig. 5a ).
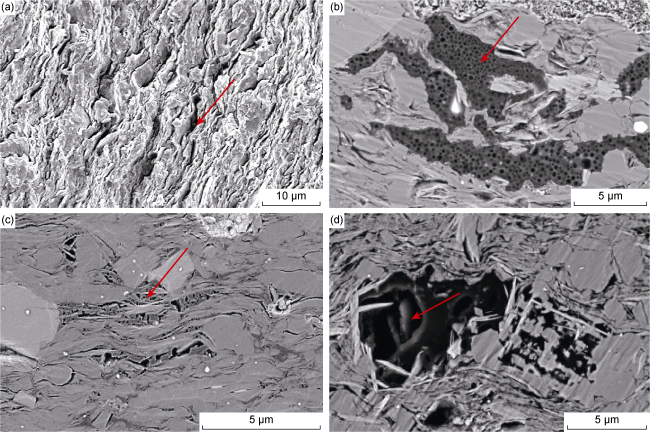
Fig. 5. Microscopic characteristics of pore space in the Cretaceous Qingshankou Formation of Gulong shale. (a) Well GY1, 2550.4 m, a large number of clay intergranular pores and fractures formed between illite and I/S mixed layers during clay mineral transformation, SEM; (b) Well GY3HC, 2374.4 m, organic matter with a large amount of honeycomb organic pores related to hydrocarbon generation, FEM; (c) Well YX58, 2107.94 m, organic pores and fractures associated with clay organic complex evolution, often are organic nanopores and fractures, field emission electron microscopy; (d) Well ZY1H, 2016.6 m, siderite was dissolved to form micron-scale dissolution pores, field emission electron microscopy. |
In the intermediate diagenetic A2 stage, the Ro value is between 0.9%-1.3%, which reaches the peak organic matter hydrocarbon generation stage. Organic matter pores are formed in large quantities. Meanwhile, the parent algal material is distributed in the shale along the layer. After being transformed into hydrocarbons in the high thermal evolution stage, it quickly becomes a mechanically weak surface and forms narrow organic hydrocarbon generation fractures. In addition, along with enhancing hydrocarbon generation, the dissolution of feldspar and carbonate minerals in the reservoir is intensified. The reservoir is mainly dominated by organic hydrocarbon-generating fractures, dissolution, and intergranular pores (Fig. 5b -5d ). While the compaction is weakened, the total porosity of shale increases and the reservoir properties improve.
In the middle diagenetic B stage, the organic matter enters the late stage of evolution. The organic acid content decreases, and dissolution pores are formed. Part of the intergranular dissolution pores is filled with authigenic minerals to decrease the dissolution pore. Following the shale oil cracking and conversion of adsorbed oil to light oil, fracture density resulting from hydrocarbon generation further increased. The fracture density observed under an electron microscope can reach 10 000/m. The fractures formed by organic matter hydrocarbon generation contribute to more than 70% of pore spaces, with the highest total porosity at 15% and the highest effective porosity at 10%.
Generally, the types of shale diagenesis in the study area mainly include mechanical compaction, clay mineral transformation, dissolution, organic matter hydrocarbon generation and cracking, cementation, etc. The evolutionary stage is in the early- to middle-diagenetic B stage (Fig. 6 ). The clay mineral transformation, dissolution, and organic hydrocarbon production can promote the formation of secondary pores, such as clay mineral intergranular pores, dissolution pores, and organic pores, which play a constructive role in the formation of reservoir space. In contrast, compaction and cementation play a destructive role in the formation of reservoir space.
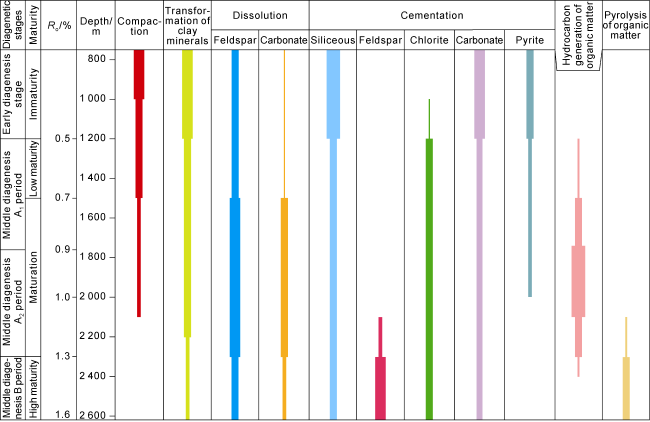
Fig. 6. Diagram of the diagenetic evolution of the Gulong shale. |
4. Evaluation and classification of the enrichment layers
The enrichment layer refers to the layer with high organic matter abundance, high content of retained hydrocarbons, high matrix porosity, high content of brittle minerals, relatively low content of clay minerals, and developed bedding fractures in the shale formation. It is the best layer for the economic development of shale oil [22-23]. Based on the analysis of the hydrocarbon evolution and reservoir characteristics of the Gulong shale described in the previous sections, it is inevitable that the oil enrichment of the Gulong shale is mainly controlled by the degree of organic matter abundance and the degree of the thermal evolution of organic matter during the original deposition period. The higher the original organic carbon content of the shale and the higher the degree of organic matter evolution, the more enriched the in-situ oil and gas. Shale oil enrichment can be characterized by the oil content evaluation parameter S1 of the shale. With increasing knowledge of the production process, we found that the more macropores in the reservoir, the better the shale oil mobility and high oil production. Based on the evaluation of oil content, NMR movable porosity parameters were introduced to characterize the shale oil mobility. The term "movable porosity" refers to the porosity provided by the pore spaces with a cutoff value greater than 8 ms in one-dimensional NMR logging. Different T2 cutoff values are usually used to characterize the variation trend of pore size of reservoir pores and thus characterize the flow capacity. Combined with the current production effects, it is found that the pore with the cutoff value greater than 8 ms has a more obvious controlling effect on the production. Meanwhile, increasing density in shale bedding fractures also dramatically enhances the shale inflow capacity. Brittle mineral content, elastic modulus, Poisson's ratio, and stress difference parameters are preferably selected to characterize the engineering properties. Based on the above geological understanding and combined with the production practice, the shale oil enrichment layer classification criteria and evaluation parameters were established. The oil enrichment layers of the shale are classified into three types: Class I, Class II, and Class III (Table 1 ).
Table 1. Evaluation criteria for the classification of oil enrichment layers in the Gulong shale |
| Type | Geological parameters | Engineering Parameters | ||||||||
|---|---|---|---|---|---|---|---|---|---|---|
| S1*/ (mg•g−1) | Movable porosity*/% | Total porosity*/% | Oil saturation/% | Lamellation density/ (Pieces•m−1) | Brittle mineral content*/% | Modulus of elasticity/GPa | Poisson's ratio | Stress difference/MPa | ||
| Class I layer | I-1 | ≥8.0 | ≥4.0 | ≥10.0 | ≥65 | ≥1000 | ≥60 | >22.5 | <0.18 | <3 |
| I-2 | 6.0-8.0 | 3.5 to 4.0 | 8.0-10.0 | 50-60 | ||||||
| Class II layer | 4.0-6.0 | 2.5 to 3.5 | 6.0-8.0 | 55-65 | 500-1000 | 40-50 | 17.5-22.5 | 0.18-0.23 | <4 | |
| Class III layer | 2.0-4.0 | <2.5 | <6.0 | <55 | <500 | <40 | <17.5 | >0.23 | <5 | |
Note: * are core indicators; others are reference indicators |
All Q1-Q9 oil layers contain oil. The lithology of the lower Q1-Q4 oil layers is pure shale with high clay mineral content and low brittle mineral content. Macropores are not common in the reservoir, while bedding fractures are developed. In particular, Q2-Q3 oil layers have the typical characteristics of high oil content and bedding fracture density, qualifying them as geological sweet spots. However, they are difficult for engineering modification. The lithology of the Q5-Q7 oil layers in the middle is shale with low dolomite and medium clay mineral content. The reservoir has limited large pores, medium development of bedding fractures, and brittle mineral content. These layers have the characteristics of medium oil content and medium engineering transformable properties. The upper Q8-Q9 oil layers are shale interbedded with thin siltstone with relatively low clay mineral content. The reservoir is developed with large pores and has high brittle mineral content. Macropores are developed. Therefore, the Q8-Q9 and Q2-Q3 oil layers are considered the best (Fig. 7 ).
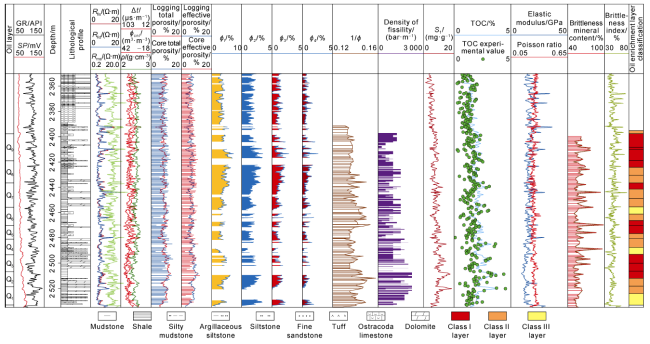
Fig. 7. Distribution of oil enrichment layers in the Gulong shale. |
5. Shale oil production
5.1. The production characteristics of horizontal wells
Currently, the testing oil production of the horizontal wells drilled in the Gulong area ranges from 4.4 t/d to 34.2 t/d, among which there are 10 wells with oil production over 20 t/d. The oil production mainly comes from Q1-Q6 and Q9 oil layers. However, differences in lateral length, fracture volume, and oil test methods among different wells affect the production characteristics of each formation.
To accurately and objectively evaluate the production characteristics and distribution patterns of different formations, the conventional calculation method of the oil production index is optimized by introducing parameters such as lateral length, fracturing fluid volume, sand volume, number of fractures, and well spacing. Meanwhile, the peak production rate of horizontal wells after achieving stable production is selected as the evaluation standard. The peak production rate is defined as the average production rate within 3-6 months after stable production. The comparison of the production capacity of the different unconventional horizontal wells under similar conditions, including lateral length, hydraulic fracturing volume and method, and production pressure difference, can be determined using the modified oil production index formula in Eq. (1).
$J=\frac{\frac{q}{{{p}_{i}}-{{p}_{wf}}}}{l}{{\left( \frac{{\bar{d}}}{d} \right)}^{{{\lambda }_{1}}}}{{\left( \frac{{\bar{n}}}{n} \right)}^{{{\lambda }_{2}}}}{{\left( \frac{{{{\bar{q}}}_{l}}}{{{q}_{l}}} \right)}^{{{\lambda }_{3}}}}{{\left( \frac{{{{\bar{q}}}_{\text{s}}}}{{{q}_{\text{s}}}} \right)}^{{{\lambda }_{4}}}}$
The normalized oil production index histogram shows that the Q9 oil layer is the primary light oil zone with the highest production capacity. The Q2-Q3 and Q4-Q6 oil layers have similar production capacities. The production capacity of horizontal wells inside the primary light oil zone is significantly higher than that of horizontal wells outside the zone (Fig. 8 ).
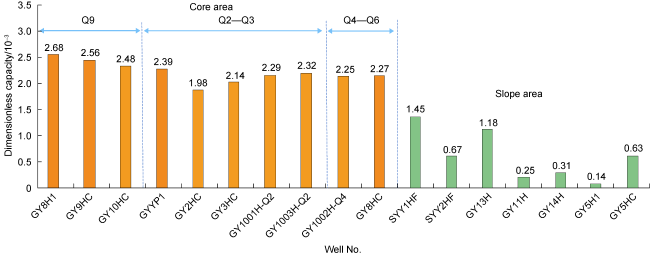
Fig. 8. Histogram of normalized oil recovery index for Gulong shale oil formations. |
Based on the production data, the target layer of high- production horizontal wells generally has the characteristics of developed bedding fractures, high porosity, high percentages of large pores, and excellent oil content. The log curves of the wells usually are characterized by high natural gamma, high resistivity, and low density (Fig. 7 ). After the hydraulic fracturing treatment, the target formations possess low oil and gas seepage resistance, making it easy to observe oil production even under low production pressure differences and backflow rates. As a result, oil and gas are continuously and effectively produced from the reservoirs, leading to long periods of natural flow and stable production. The hydrocarbon in the small pore matrix is gradually recovered with prolonged production, leading to long-term stable production under a low decline rate during formation energy gradually reduces.
The dynamic production data indicates that the wells drilled in the Q2, Q3, and Q9 oil layers generally obtained high production. Among them, the Q9 oil layer in the primary zone produced more than 20 t of oil per day in the northern Well GY8H1, central Well GY 10HC, southern Well GY9HC, and the test well group GY2-Q9-H1 wells during the initial production. The production of these wells is stable and last a long time. Oil production has lasted 265-361 d, with cumulative oil production of 2934.5- 6574.3 t and cumulative oil and gas equivalent production of 5578.5-10 082.8 t. EUR of single well is forecasted in the range of (2.0-3.1)×104 t, whereas the oil and gas equivalent EUR production is (3.2-4.3)×104 t. Based on the above evaluations, the field can be developed extensively and economically. Currently, the oilfield is actively organizing the development expansion test of the Q9 oil layer.
5.2. Oil production
The Gulong shale is characterized by a low-porosity and ultra-low-permeability unconventional reservoir with low matrix seepage. However, due to the extensive development of organic matter-related pores and fractures in the reservoir, the self-sourcing properties of the reservoir, and the development of bedding fractures, the pores are connected to form a spatial network structure.
Four cores from different layers of three typical wells were selected for the threshold pressure tests of the oil phase using the digital core technique. The threshold pressure gradient of the oil phase was determined to be 0.194 MPa/mm for tiny pores below 32 nm and 0.078 MPa/mm for large pores above 128 nm (Fig. 9 ). Theoretically, oil could be displaced from the pore space when the driving pressure difference is in the range of 0.8-2.0 MPa. In addition, the oil is primarily produced from pores larger than 128 nm during the initial production period.
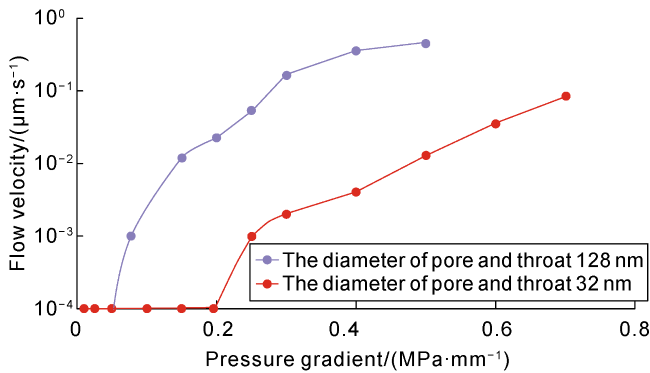
Fig. 9. Proposed threshold pressure gradient for different pores of the oil phase in the Gulong shale. |
The fluid in the reservoir can flow from the nano-scale pore space into the hydraulic fracture network under a specific pressure difference and then flow into the wellbore to be recovered. Therefore, it is necessary to create a more extensive hydraulic fracture network under the same hydraulic fracturing intensity or volume during oil production. A larger fracture volume can reduce the pressure in the fracture network and increase the driving pressure difference to achieve early oil observation at a low backflow rate.
From the results of field tests in the area, the production pressure difference for the produced oil wells is from 0.1 MPa to 5.6 MPa, most of which is 2.0 MPa (as shown in Fig. 10 ). The production performance of the horizontal wells is similar, mainly controlled by the physical conditions and the development of bedding fractures in the target layer. However, due to the different well spacing and networks, the test well group has different degrees of well interference and fluid breakthrough in other layers. Therefore, the oil pressure difference is slightly different. Oil phase tracers were applied to continuously trace the oil production contribution pattern of the different fractured sections of horizontal wells. The results show that oil was produced from only some sections of horizontal wells at the early stage of oil production (Fig. 11a ) when the production pressure difference was 2.7 MPa. However, when the production pressure difference reached 12.4 MPa (Fig. 11b ), all sections of wells produced oil, and the oil production of horizontal wells was close to the maximum. The production contribution of each section did not change when further increased pressure difference to 20.1 MPa (Fig. 11c ). Therefore, maintaining a reasonable production pressure difference is essential for achieving the high and stable production of Gulong shale oil.
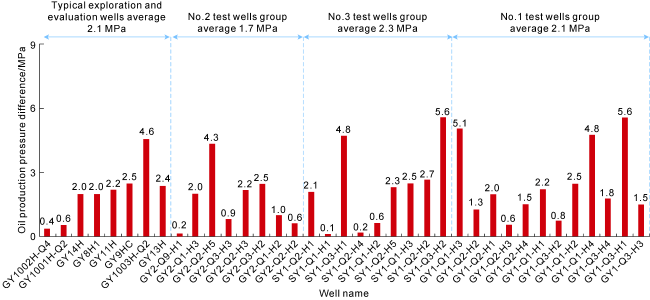
Fig. 10. Histogram of the pressure difference for oil production in typical exploratory and test well groups. |
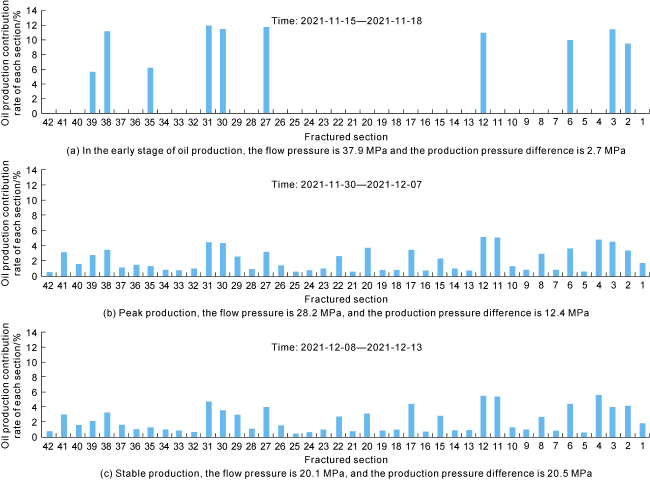
Fig. 11. Comparison of tracer at different stages in well GY1-Q1-H2. |
5.3. Production decline trend
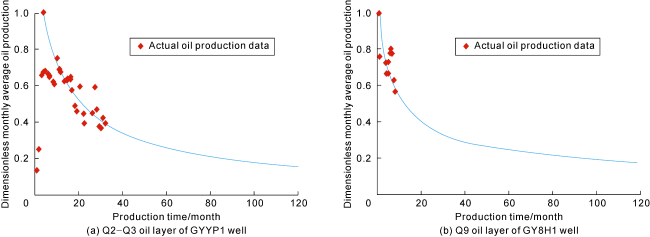
The typical well of Gulong shale oil, Well GYYP1, achieved a maximum daily test oil production of 30.5 t during the testing period. During the test production period, the capacity for stable production was determined by the fixed production rate method. Stable production is achieved when the production rate is maintained at 13-14 t/d. The stable production by natural flow lasted more than 330 d, followed by a gradual production rate decline. During the production decline period, the production rate was restored to more than 10 t through multiple methods such as tool adjustment, a wiper trip to clear the well, and repressurizing the reservoir. By fitting analysis of the production decline curves of the producing wells, the entire Gulong shale oil wells follow a hyperbolic decline pattern with a decline index of 0.85-0.95 and a first-year decline rate of 14.5%-26.5% (Fig. 12 ), confirming its great potential for commercial development.
Fig. 12. Decline rate fitting curves of the typical wells (a) Q2-Q3 oil layers of Well GYYP1 (b) Q9 oil layer of Well GY8H1. |
6. Critical issues for further research
Significant progress has been made in the exploration and development of Gulong shale oil. The production tests of horizontal wells demonstrate a long-term stable production. The development of the test area under the tiered oil price has shown certain economic benefits. However, as Gulong terrestrial pure shale-type shale oil is a brand-new field and the shale has a wide distribution and substantial heterogeneity, there are still problems such as target layer deviation in horizontal wells, sand out contamination in horizontal well sections, and wax contamination in straight well sections. The production program needs to be optimized during the production process. The next step is to strengthen the basic geological research on hydrocarbon-rich shale, which requires further research on the following items: the process of hydrocarbon generation and expulsion in Gulong shale, testing methods for shale porosity and hydrocarbon content under formation conditions, determination of boundary conditions in the enrichment zone, shale mechanical properties, and volume transformation, etc. In addition, detailed classification of the target layers, the establishment of an iterative geological model, and improvement on the drilling encountering rate of the oil layer need further investigation. To achieve large-scale and efficient development, we also need to accelerate the iterative upgrading of technical management, clarify a reasonable production pressure difference, and improve EUR.
6.1. Shale hydrocarbon generation and expulsion process
In this study, substantial progress has been made in understanding the hydrocarbon generation and expulsion mechanism of Gulong shale through the improved simulation of the process. However, there are significant differences between the experimental and actual geological conditions. In particular, the time effect in the hydrocarbon generation process needs to be considered. In addition, some relevant parameters in the calculation process also have multiple solutions. Therefore, the next step is to carry out hydrocarbon generation and expulsion experiments that keep approximating the geological conditions and obtain accurate experimental parameters to quantify the hydrocarbon generation, expulsion efficiency, and retained oil volume.
6.2. Test methods and standards for shale porosity and hydrocarbon content under formation conditions
For the analysis of the porosity and hydrocarbon content of shale, there are corresponding national or industry standards. However, the following main issues still exist in the practical research: (1) The experiment for porosity analysis is affected by many factors, such as testing time and sample size. The porosity values measured by different institutes and different testing methods vary greatly. Hence, it is urgent to establish accurate testing methods and parameter standards. (2) At present, when testing shale pore volume under compression, the porosity shows a decreasing trend if the pore pressure is kept constant and the overburden pressure is increased. In contrast, if the overburden pressure is kept constant and the pore pressure is increased, the porosity shows an increasing trend. In the actual test and analysis, the overburden pressure is often considered, and the pore pressure is neglected, especially for the nano-scale pores. The pore pressure is challenging to measure. Therefore, it is urgent to establish a reliable test method for porosity. (3) As a large number of light hydrocarbons will be dissipated after moving the core samples from the subsurface to the surface conditions, most of the current test results show heavier components in the samples after light hydrocarbon dissipation. Therefore, the test results show low oil content in shale. It is necessary to establish methods and standards for light hydrocarbon recovery correction based on the existing test tools to accurately characterize the hydrocarbon distribution under the formation conditions and oil and gas mobility during development. (4) A large number of shale bedding fractures are visible in the shale cores observed at the surface, but can the fractures remain open under the formation conditions where the near-horizontal bedding fractures are subjected to huge overburden pressure? Direct CT observation and measurement of pressure-preserved cores are needed to obtain parameters that can indicate shale oil resources and directly affect the evaluation of shale oil enrichment formations/zones and the effective development in later stages.
6.3. Boundary of shale oil enrichment zone
Gulong shale oil is mainly enriched in pure shale. Considering that the organic-rich shale has a high content of retained hydrocarbons, and the engineering properties of organic-rich and feldspathic shale containing terrestrial clastic quartz are more favorable, the Q2-Q3 oil layers and Q8-Q9 oil layers are determined to be the most favorable target oil enrichment layers. However, the question is to find the boundary conditions of the enriched area since the shale oil formation has wide and stable lateral distribution. For different lithology types, deposition facies, and thermal maturities, it is necessary to establish evaluation criteria separately to determine the boundaries.
6.4. Shale mechanical properties and volumetric modifications
The Gulong shale is a heterogeneous and stratified oil-bearing geological complex. A large amount of hydrocarbon fluids is stored in the pores and laminated fractures of the shale matrix, which significantly changes the rock mechanics of the shale. The traditional rock mechanics theory can no longer describe mechanical properties. The hydrocarbon fluids stored in cross-scale pores and fractures will interact with the rock matrix. In future research, it is necessary to consider several factors, such as pore pressure correction and evolution of physical and chemical properties in hydrocarbon-rich shale, so that the obtained equivalent mechanical parametric elements can adequately reflect the characteristics of rock mechanics, fracture failure, and seepage transport anisotropy of the porous media. The effective stress intensity criterion for pore pressure correction, hybrid mode failure, and strong intermittent coupling of materials also need to be developed. Meanwhile, hydrocarbon fluids in the shale bedding fractures induce compression-shear dislocations in the rock matrix, and fluid lubrication lowers the critical shear stress. Horizontal fractures and shale bedding fractures of variable scales cross and interact with each other to form multi-scale fracture network systems. However, the over-complicated fracture system development will consume large amounts of energy, limiting the volumetric transformation by fracturing. Therefore, it is necessary to develop alternate fracturing schemes with dynamic and quasi-static dominant fracture tips to improve the effective volume of fracturing and the overall efficiency of reservoir transformation. Meanwhile, deep penetration injection is critical to enhancing the volume transformation.
Existing fracturing techniques are applicable to the Q9 oil layer with relatively low clay mineral content and weakly developed shale bedding fractures. It is necessary to explore further personalized fracturing techniques for shale reservoirs with high clay content, rich bedding fractures, and different lithological combination characteristics to enhance the height and volume of the modified fractures effectively.
6.5. Recovery enhancement techniques
The theoretical method for recovery enhancement in conventional oil is to lower the surface tension between liquid and liquid. The following urgent problems need to be solved to improve the recovery of Gulong shale oil. The surface tension and interfacial adsorption constrained by the nano-scale effect need characterization. The characteristics of the oil and gas fluid phase and phase equilibrium mechanism in the nano-constrained space are urgently needed to understood. The mechanism of the liquid-solid interface reaction and its effect on the fluid flow behavior in the nano-scale pathways need to be determined. The stripping mechanisms of crude oil at different occurrence states in the changing injected media need to be clarified.
7. Conclusions
The Gulong shale oil is featured with medium TOC and high HI. TOC value is from 1.81% to 2.74%. The primary source of organic matter is laminar algae, with high content of fatty carbon. The Ro value mainly ranges from 0.9% to 1.6%. The maximum hydrocarbon expulsion efficiency is 49.5% during massive hydrocarbon expulsion. The HI value mostly ranges from 600 to 800 mg/g. The shale oil occurrence is mainly in a free state and adsorbed state. The value of free oil generation comes at Ro of 1.3%, and the peak value of adsorbed oil generation comes at Ro of 1.1%, indicating that the peak of free oil generation lags behind that of adsorbed oil. The peak value of free oil generation is 4.63%, and the peak value of adsorbed oil generation is 3.97%, indicating that the peak of free oil generation lags behind that of adsorbed oil.
The Gulong shale has the lithological characteristics of high clay mineral content, low carbonate mineral content, and high feldspathic mineral content. The lithogenic evolution is at the middle diagenetic B stage, with developed organic pores. The total porosity is up to 15%, and the effective porosity is 10%.
The critical parameters for classifying and evaluating the Gulong shale oil enrichment layer are free hydrocarbon content, effective porosity, total porosity, brittle mineral content, oil saturation, bedding fracture density, and stress difference. The main parameters for evaluating the enrichment area are the degree of thermal evolution, pressure coefficient, thickness proportion of class I oil layer, gas-oil ratio, crude oil density, and viscosity.
The Q8-Q9 and Q2-Q3 oil layers of the Gulong shale oil in the key area of the light oil zone have the best geological and engineering quality in the plane. After conducting many comparative tests, iterations, and technology upgrades, we have developed the Gulong Fracturing 2.0 technology. The technology is characterized by reverse mixing, high viscosity primary fluid, extensive particle size support, CO2 front, and fewer clusters in the horizontal sections. Oil shows up in all sections after fracturing. The 5 groups of development test wells and 10 exploration and evaluation horizontal wells have the characteristics of early oil production with low backflow rate, high cumulative production in the first year, and high EUR. Therefore, the wells can achieve effective development.
The production capacity of the key area of the Gulong shale light oil belt (Ro>1.4%) is significantly higher than that of the marginal slope area (Ro values of 1.2% to 1.4%). The entire well section can observe oil when the production pressure difference reaches 13-15 MPa. The decline curve displays a hyperbolic regression characteristic, with first-year regression rates of 14.5% to 26.5%, significantly lower than other shale oil domestic and abroad.
It is necessary to study further the fundamental elements such as the process of hydrocarbon generation and expulsion in Gulong shale, the test method of shale porosity and hydrocarbon-bearing properties under formation conditions, the determination of boundary conditions of the enrichment zone, the mechanical properties of shale for volume transformation, etc. The goal is to obtain detailed descriptions of the target layer, establish an iterative geological model and improve the drilling encountering rate of oil layers, accelerate the upgrading and iteration of technical management, and clarify the reasonable production pressure difference to improve EUR and achieve large-scale and efficient development.
Acknowledgments
We thank the leaders of Daqing Oilfield Company Limited, Exploration Department, and E&P Research Institute for their support, and the project team of China Petroleum Exploration and Development Research Institute for their support of the project "Collaborative Research on Significant Geological Basis and Engineering Practice of Gulong Shale Oil," as well as the Heilongjiang Province for the financial support of the project on "Gulong Shale Oil Phase, Percolation Mechanism and Geological Engineering Integration of Production Enhancement." We are grateful for the help of the academician team of Daqing Oilfield.
Nomenclature
d—calibration well development spacing, m;
$\bar{d}$—type well development spacing, m;
EUR—single well predicted recoverable reserves, t;
GR—natural gamma, API;
HI—hydrogen index, mg/g;
J—normalized oil recovery index, t/(d•MPa•m);
l—length of horizontal section, m;
n—number of fractures;
$\bar{n}$—number of fractures in type wells;
n—number of fractures in the calibration well;
pi—original formation pressure, MPa;
pwf—bottomhole flow pressure at stable production, MPa;
q—initial stable production, t/d;
${{\bar{q}}_{l}}$—c added fluid volume in hydraulic fracturing of the calibrated well, m3;
qs—volume of added sand during type well fracturing, m3;
${{\bar{q}}_{s}}$—volume of added sand during calibrated well fracturing, m3;
Rlld—deep lateral resistivity, Ω•m;
Rlls—shallow lateral resistivity, Ω•m;
Rms—microspherically focused resistivity, Ω•m;
Ro—vitrinite reflectance, %;
S0—gaseous hydrocarbon content in rock, mg/g;
S1—free hydrocarbon content in the rock, mg/g;
S2—pyrolytic hydrocarbon content in the rock, mg/g;
SP—natural potential, mV;
TOC—total organic carbon content, %;
Δt—acoustic time difference, μs/m;
ρ—density, g/cm3;
ϕ—median particle size, unfactored;
ϕ1, ϕ2, ϕ3, ϕ4—porosity at NMR T2 greater than 8, 35, 60, 100 ms, %;
ϕcnl—neutron porosity, %;
λ1, λ2, λ3, λ4—normalization coefficients, unfactored.