

Introduction
Previous studies [1⇓-3] have shown that China has rich lacustrine shale oil resources, of which the geological resources of medium to high-maturity shale oil (Ro≥0.9% and Ro≥0.8% in saline lacustrine basins) are (145-283)× 108 t, and the technically recoverable resources of low to medium maturity shale oil (Ro<0.9% and Ro<0.8% in saline lacustrine basins) are (700-900)×108 t. Both types of shale oil play a critical role in the long-term stable development of the petroleum industry and the oil and gas security of China. In recent years, breakthroughs to the exploration and development of shale oil have been achieved in several formations, including the Cretaceous Qingshankou Formation of the Gulong Sag in the Songliao Basin, the Paleogene Kongdian Formation of the Cangdong Sag in the Bohai Bay Basin, the Paleogene Shahejie Formation of the Qikou Sag and the Jiyang Sag, the 7th member of the Triassic Yanchang Formation (Chang 7 Member for short) in the Ordos Basin, and the Permian Lucaogou Formation of the Jimusaer Sag in the Junggar Basin [4⇓⇓⇓⇓⇓⇓-11]. According to the statistics released by the National Energy Administration of China, China's shale oil production reached 272.6×10⁴ t in 2021 and exceeded 300×104 t in 2022 [12]. The Chinese government has approved the construction of three lacustrine shale oil demonstration zones (the Lucaogou Formation of the Jimusaer Sag, the Qingshankou Formation of the Gulong Sag, and the Shahejie Formation of the Jiyang Sag). Assuming that technical and management innovations can significantly reduce costs and increase the single-well estimated ultimate recovery (EUR), shale oil with medium and high maturity will become an important resource for realizing stable oil production of 2×10⁸ t in China. Breakthroughs to underground in-situ conversion technology and economic development of the resources will facilitate shale oil with low and medium maturity as a key resource for supporting the large-scale growth of the oil and gas production of China. Theoretical and technological breakthroughs can lead to a profound lacustrine shale oil revolution, whose significance is comparable to the marine shale oil revolution in the USA.
In China, both exploration and trial production of lacustrine shale oil have a short history. Many fundamental scientific and technological issues related to the formation, distribution, and evaluation of the economically recoverable reserves in shale oil enrichment sections are still under exploration and development. However, present practices reveal that the evaluation of lacustrine shale oil enrichment zones/sections is different from conventional oil and tight oil. For example, oil in conventional and tight reservoirs is from source rocks to the reservoirs, and filtered by micro- and nano-pores formed by clay minerals and solid organic matter before accumulating into the reservoirs. More specifically, multiple hydrocarbon components and non-hydrocarbon components are mixed according to “the rule of the likes dissolves each other”. In general, the percentage of the movable components is high. In contrast, hydrocarbons in shale reservoirs are mainly movable hydrocarbons, heavy hydrocarbons and non-hydrocarbon substances that cannot flow out with ease. Their mobility and flow rate are much lower than those in conventional and tight oil reservoirs. In addition, lacustrine shale oil reservoirs are highly heterogeneous [13-14], the mobility of shale oil varies greatly, and high initial production does not mean economic EUR. Shale oil enrichment sections selected by only considering the amount, but not considering the quality and mobility of retained hydrocarbons, may be economically unrecoverable. In fact, not all retained hydrocarbons are movable, and the amount of movable hydrocarbons is the quintessential factor determining the economic recoverability of shale oil. To promote the steady and large-scale exploration, development and production of lacustrine shale oil in China, it's better to focus on shale oil mobility and establish the evaluation parameters and criteria for the enrichment of movable hydrocarbons in shale oil reservoirs. This is likewise the focus of this study.
The types and structural characteristics of original organic matter also vary with lacustrine basin environment. As thermal maturity (Ro) increases, both hydrocarbon generation difficulty and quantity of hydrocarbons converted from organic matter change. For instance, compared to fresh lacustrine basins, the algae growing in saline lacustrine basins are richer in fatty acid and can produce more liquid hydrocarbons at lower temperature. Taking the fourth member of the Shahejie Formation in the Jiyang Sag and the Paleogene Ganchaigou Formation in the Qaidam Basin, NW China, as examples, the average activation energy for converting original organic matters to liquid hydrocarbons is 190-210 kJ/mol (with a pre- exponential factor of 5.5×10¹⁵ s-1), and the peak oil production is at Ro of 0.6%-0.8% [15-16]. In fresh lacustrine basins, such as the Chang 73 submember in the Ordos Basin, the average activation energy is 220-230 kJ/mol (with a pre- exponential factor of 1.2×10¹⁴ s-1), and the peak oil production is at Ro>0.9% [17-18]. In this case, the percentage of organic matter that is converted to hydrocarbons is low. More specifically, when Ro is 0.9%, only 45% of organic matters is converted to hydrocarbons[19]. The mineral composition and rock structure of shales with high contents of organic matters vary greatly in different lacustrine basin environments. For example, shale in saline lacustrine basins has a high content of carbonate minerals. Its adsorbing ability to hydrocarbon and non-hydrocarbon is low, and it is very brittle, so that natural fractures are common in such shale, and it is easy to fracture. These properties have great impacts on shale oil production and EUR.
To select the most economical shale oil enrichment zones, it is crucial to consider the enrichment conditions and evaluation of movable hydrocarbons, which are guaranteed of high initial production and EUR of shale oil. The movable hydrocarbon enrichment zones evaluated based on the standard values of the enrichment factors of movable hydrocarbons are the primary production zones for large-scale and economic production, as well as the efficient development of shale oil. This study proposes 13 evaluation indexes based on the enrichment factors of movable hydrocarbons, hydrocarbon mobility and engineering-related factors, in order to promote large-scale, economic and efficient exploration and development of lacustrine shale oil in China.
1. Main types and basic characteristics of lacustrine shale oil in China
Shale oil is the petroleum hydrocarbon preserved in source rocks. It includes the hydrocarbon retained in the shale with a high content of organic matter and the oil migrating a short distance into the thin sandstone and carbonate interlayers from the source rock [19]. The concept of shale oil follows oil and gas reservoirs, but it is different from the terms such as heavy oil, thin oil, and light oil. For the classification of shale oil, special attention must be paid to the underground occurrence state and mobility of retained hydrocarbons, and the perspective of reservoirs should be considered. Based on these, lacustrine shale oil in China is classified into tight shale oil, pure shale oil, and transitional shale oil [2]. Tight shale oil is mainly deposited in tight sandstone or carbonate inside shale, and the underground occurrence state and mobility of petroleum hydrocarbons are not significantly different from those of the known tight oil reservoirs, so tight shale oil can be developed according to available tight oil development methods and technologies. Qingcheng oilfield discovered in the Chang 71+2 in the Ordos Basin is a typical tight oilfield example. Pure shale oil is mainly deposited in the micro- and nano-pores formed by clay minerals and organic matter in shale. It is an in-situ retained mixture of multiple types of petroleum hydrocarbons, non-hydrocarbons and solid organic matter. Pure shale oil is present underground in the form of light, medium, and heavy components. These components are miscible with non-hydrocarbons, resulting in a “component flow”. In other words, heavy components and non-hydrocarbons are mixed and flow with light and medium components as molecular cluster fragments, called a component flow, thus more heavy hydrocarbons and non-hydrocarbons flowing out of the reservoir. At present, no mature methods and technologies are available for developing pure shale oil. It is necessary to do basic research and trial production to make breakthrough to theory and technology. Transitional shale oil is found in tight sandstone, tight carbonate and shale with a high content of organic matter, all of which have considerable reserves. The underground occurrence state and mobility of transitional shale oil share characteristics with tight shale oil and pure shale oil, and the development methods and technologies for transitional shale oil vary according to the primary nature. If transitional shale oil is more in tight shale oil reservoirs, the development method for tight oil is used. If more in shale reservoir, use the development method for pure shale oil. Some examples are the shale oil in the Lucaogou Formation of the Jimusaer Sag in the Junggar Basin, the shale oil in the Kongdian Formation of the Cangdong Sag in the Bohai Bay Basin, and the shale oil in the S31-S42 in the Jiyang Sag.
The miscible flow characteristics, subsurface distribution, and non-homogeneous mobility of shale oil are reflected in the production performance of shale oil wells. Fig. 1 depicts the gas-phase chromatogram of crude oil taken at different production test time from Well GY 5-1-2L in the Cangdong Sag, the Bohai Bay Basin. The measured depth of the tested K2 Member of the Kongdian Formation is 3825-3903 m, the thermal maturity (Ro) of the shale oil is 0.92%, and the oil density is 0.89 g/cm3. As observed, at the beginning of production test, the petroleum hydrocarbons that first flow out have a high content of light components, suggesting that light components are easy to flow out. As time gone, light components decrease while heavy components increase (at sample points ②, ③, and ④ in Fig. 1 ). Moreover, the components of the produced crude oil vary greatly with time. High oil production generally appears with high contents of light and medium components, good miscible flow of low, medium and heavy components, and high output (see sample points ①, ②, ③, and ⑧ in Fig. 1 ). When the production pressure difference decreases or the production system changes, the miscible flow of hydrocarbon components is affected, leading to a reduced production, a significantly reduced content of light components, and decreased mobility (see sample points ④, ⑤, and ⑥ in Fig. 1 ). Furthermore, during the 9-month production test, the production of light and heavy components presents two cycles on an interval of 3-5 months. The initial production of light components is higher than that of heavy ones, and then the heavy components increase. This cyclical variation may reflect the non-homogeneous distribution of shale oil. More specifically, at some flowing pressure difference, the shale oil in the pores and throats connecting with flow channels will first enter the channels. When the movable hydrocarbon flow is exhausted, the shale oil in other pores and throats will enter the flow channels driven by the pressure difference and continue to provide movable hydrocarbons. This may explain the change in the produced hydrocarbon components with time.

Fig. 1. Shale oil production curve and chromatographic analysis results of different sampling points in the GY 5-1-2L well of the Cangdong Sag [24]. |
This study finds that the economic development of shale oil needs to meet three important conditions. First, the single-well shale oil production must be above the economic threshold. Second, the single-well EUR must be more than able to recover the investment. Third, the shale oil sweet spot reserves can support the minimum economic production and stable production period, which should reach 6 to 8 years at present. Typically, shale oil is in free and adsorbed states underground [20]. Under current technical conditions, the recoverable oil is mainly free shale oil, namely, the retained liquid hydrocarbons after removing adsorbed hydrocarbons, called movable hydrocarbons. If the movable hydrocarbons have a high content of light components, and an appropriate ratio of light, medium and heavy components and non-hydrocarbons, a miscible flow of multiple hydrocarbon components and non-hydrocarbons may appear, indicating the best mobility and the highest flow rate. In addition, formation energy field (e.g., formation overpressure and the pressure difference between formation and wellbore are driving forces) also has an important effect on the amount of movable hydrocarbons. Under the same component ratio, high formation energy can drive heavy hydrocarbons and non-hydrocarbons which are immobile originally to flow, thus increasing oil output. According to the statistics of the production test data collected in the Gulong Sag, the content of movable hydrocarbons in shale oil exhibits a strong positive correlation with the cumulative oil production index (i.e., the cumulative oil production in the first six months per kilometer of well section, calculated by normalizing the horizontal section length and production pressure difference of all producing wells). This suggests that the amount of movable hydrocarbons greatly affects the cumulative shale oil production (Fig. 2 ).

Fig. 2. Movable hydrocarbons vs. cumulative productivity index of shale oil in Gulong Sag. |
Accurate evaluation of movable hydrocarbons is a prerequisite for effective exploration and economic development of lacustrine shale oil. Currently, laboratory analysis methods can be used to obtain shale parameters such as movable hydrocarbons. For example, previous work employed an improved pyrolysis procedure to obtain the quantity of movable oil (multi-temperature phase pyrolysis hydrocarbons) [21], and saturation-centrifugal nuclear magnetic resonance tests were used to determine fluid saturation and movable fluid saturation [22]. However, light hydrocarbon loss was reported during samples were stored and before treatment, namely, from the time when the samples were taken out of the well to the time when tested and analyzed, which has a significant impact on the evaluation of movable hydrocarbons [23]. Therefore, comprehensive evaluation of oil content and mobility requires the recovery of light hydrocarbons to ensure an unbiased reflection of the oil content of a shale reservoir.
2. Enrichment factors of movable hydrocarbons in shale oil
In this study, we investigated three key factors: the material basis, mobility, and engineering-related factors, to clarify the evaluation indexes of the enrichment of movable hydrocarbons in shale oil and determine their standard values and lowest limits (Table 1 ).
Table 1. Enrichment factors and evaluation indexes of movable hydrocarbons in lacustrine shale oil, and parameters of shale oil in Gulong Sag, Songliao Basin |
| Type | Material basis | Hydrocarbon mobility | Engineering-related factors | ||||||||||
|---|---|---|---|---|---|---|---|---|---|---|---|---|---|
| TOC and organic matter type | S1/(mg·g-1) | OSI/(mg·g-1) | Porosity/% | Ro/% | GOR/ (m3·m-3) | Crude oil density/ (g·cm-3) | Hydrocarbon component | Storage conditions | Formation energy | Brittleness | Laminated structure | Shale lithofacies | |
| Enrichment zone | TOC>2%, preferably 3%-4%; Type I-II1 | >2, preferably 4-6 | >100, preferably >150 | >3%, preferably >6% | Saline lacustrine basin: >0.6%; fresh lacustrine basin: >0.9%; resource sweet spot zone: >1.2% | >80, preferably 150-300 | Pure: <0.85; Transitional: <0.9 | If Ro>0.9%, saturated hydrocarbons greater than 80% and C1-14/C15+ >0.8; if Ro=0.6%-0.9%, saturated hydrocarbons greater than 55% and C1-21/C22+ >1.0 | Caprock thickness >2-5 m, and breakthrough pressure >10 MPa | Pressure coefficient greater than 1.2 | Middle diagenesis Stage B, brittleness index greater than 50%, and clay content less than 40% | Laminated structure and high peelability | Felsic shale and biosparite carbonate shale |
| Light oil belt of the Gulong Sag | TOC of 1%-6% generally, and >2% on average; Type I | 4-15 | >200 | >4% | Mostly greater than 1.2%, locally greater than 1.4% | Mostly greater than 200 | 0.78-0.85 | Average content of saturated hydrocarbons = 90% and C1-14/C15+ = 1.0-1.5 | Average roof breakthrough pressure = 12.6 MPa | Pressure coefficient >1.4 | Middle diagenesis Stage B-late diagenesis, and average brittleness index = 60% | Laminated structure and high peelability | Laminar felsic shale |
2.1. Material basis
The amount of retained hydrocarbons in the shale with a high content of organic matter is related to two major factors. (1) Organic matters abundance. The higher the organic matter abundance, the larger the amount of retained hydrocarbons generated after the organic matter enters the “liquid window” of hydrocarbons. (2) Organic matter type. The organic matter in marine and lacustrine shale oil in China and abroad is mainly of type I-II1, i.e., mainly oil-type organic matter, which ensures the amount of movable hydrocarbons generated. Hence, organic matter abundance is a basic factor determining the amount of retained hydrocarbons. In the case of too low organic matter abundance, the total amount of petroleum hydrocarbons generated is limited, and after some hydrocarbons are expelled, the remaining become much less, and can hardly ensure high EUR, affecting the economic production of shale oil. Fig. 3 shows the correlation between the organic matter abundance and the amount of retained hydrocarbons in major lacustrine shale oil zones in China. As the abundance of organic matter increases, the amount of retained hydrocarbons increases sharply. If TOC<2%, the amount of retained hydrocarbons is generally small (less than 2 mg/g in most cases). If TOC>2%, the amount of retained hydrocarbons (S1) is typically 4-8 mg/g. If TOC>4%, the content of retained hydrocarbon remains constant as the TOC increases. This characteristic is also evident for shale oil with different maturity (Fig. 4 ). The results indicate that, to achieve the economic production of shale oil, the minimum threshold of TOC must be higher than 2% [2], and it's better to be 3%-4%. Generally, high organic matter abundance is conducive to a large amount of retained hydrocarbons, but it can lead to increased absorption to retained hydrocarbons, especially in the early to middle “liquid window” (Ro<0.9% or Ro<1.0%), where the petroleum hydrocarbons have high contents of heavy components and non-hydrocarbons [25] and the organic matter absorbs hydrocarbons in a prominent way. Additionally, although shale oil in saline lacustrine basins is generated earlier, it has a high content of paraffin [26] and poor mobility, so “engineering sweet spot zones” which are easy to fracture are necessary to achieve high economic production. Hence, to determine the effect of organic matter abundance on the amount of movable hydrocarbons, thermal maturity needs to be considered. At Ro<0.9%, the organic matter abundance should reach the minimum threshold but not be too high, so as to both ensure the amount of retained hydrocarbons and reduce adsorption. According to the threshold of organic matter abundance and optimal range, corresponding values are set for the amount of retained hydrocarbons. As shown in Fig. 3 , S1> 2 mg/g if TOC>2% and S1=4-8 mg/g if TOC=3%-4%. Additionally, according to the analysis of the oil saturation index (OSI), when TOC>2%, the frequency of OSI>100 mg/g increases significantly, especially when interlayer micro-transport happens to petroleum hydrocarbons. In this case, the OSI significantly increases. According to statistics, OSI>100 mg/g can be set to be the threshold for selection of shale oil enrichment sections, and OSI>150 mg/g corresponds to the best zone. The Qingshankou Formation shale in the Songliao Basin delivers high single-well shale oil production at S1>4 mg/g, while the high-yield wells in the Dagang oilfield are almost located in the zone with OSI>150 mg/g.
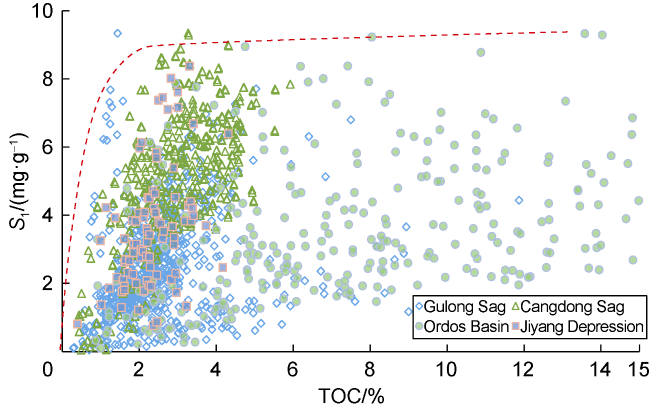
Fig. 3. Correlation of TOC with S1 of major continental shales in China. |
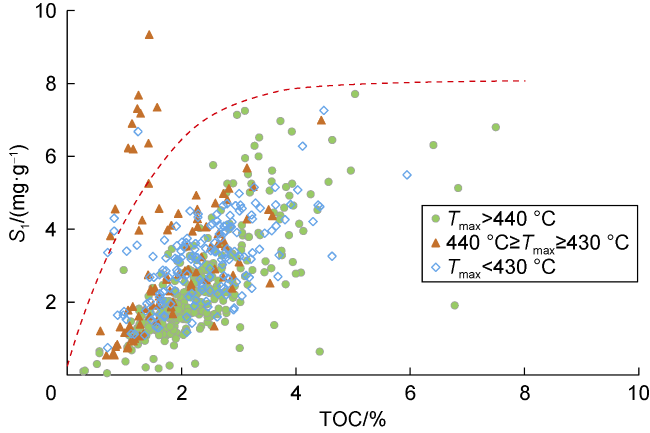
Fig. 4. Correlation of TOC with S1 of major continental shale oil zones with different maturities in China. |

Fig. 5. Correlation of TOC with cumulative oil production per well at the Kongdian Formation shale in Dagang oilfield. |
Enrichment of shale oil also requires a reservoir space large enough to accommodate sufficient retained hydrocarbons. According to the statistics of major shale oil production zones, the effective porosity must exceed 3% (preferentially higher than 6%). Requirements of reservoir porosity vary with the shale oil zones with different thermal maturity. Shale zones with high maturity have low crude oil density and viscosity, a high content of light hydrocarbons, and high mobility of retained hydrocarbons, so that low porosity is required in order to get high production. For example, the effective porosity of the Qingshankou Formation shale in the Gulong Sag in the Songliao Basin is reported 3.5%-6.9%. In contrast, shale zones with low maturity, including the second member of the Kongdian Formation in the Cangdong Sag and the Lucaogou Formation in the Jimusaer Sag, have high crude oil density and viscosity, high contents of heavy components and heavy non-hydrocarbons, and a low content of movable hydrocarbons, so high porosity is required to get high production. For example, the average effective porosity of the upper and lower sweet spot zones in the Lucaogou Formation in the Jimusaer Sag and the second member of the Kongdian Formation in the Cangdong Sag is reported 11%-13% [20] and 4%-12% [24], respectively. In addition, the mobility of shale oil increases with the connectivity of micro-and nano-pores. SEM images reveal the second member of the Kongdian Formation and the Qingshankou Formation with high-yield wells have developed bedding fractures [27-28], which contribute 14% to the reservoir space. This suggests that high porosity and good pore structures are important for the economic enrichment of shale oil.
In summary, in terms of material basis, to achieve the enrichment of retained hydrocarbons in the shale with a high content of organic matter, the organic matter abundance should not only reach the abundance threshold that can satisfy the economic enrichment of shale oil, but also not be too high. This can ensure the maximum probability of economic shale oil and avoid the excessive adsorption of hydrocarbons.
2.2. Mobility of retained hydrocarbons
The mobility of shale oil determines the recoverability of resources and the feasibility of exploration [29]. It is not only an important factor determining the economy of single-well oil production and cumulative oil production, but is also an important index in the evaluation of shale oil enrichment zones. To maintain the maximum mobility and flow rate of retained hydrocarbons, the following two factors must be considered: (1) High roof and floor sealabilities can ensure the maximum amount of movable hydrocarbons retained in shale, which requires that the roof and the floor of the shale oil enrichment zone to be stable and continuous, and without large open faults; (2) High shale maturity can ensure high contents of light and medium hydrocarbons and low contents of heavy hydrocarbons and non-hydrocarbons, thus maximizing the amount of movable hydrocarbons. Thermal maturity has an important impact on the quantity and quality of retained hydrocarbons and the economic recoverability of shale oil [30]. According to the analysis of the chloroform bitumen “A” composition of 233 shale samples from the Qingshankou Formation in the Gulong Sag, the content of saturated hydrocarbons gradually increases with maturity. When Ro>1.0%, the content of saturated hydrocarbons increases rapidly while the contents of aromatic hydrocarbon, non-hydrocarbons and asphaltene decrease. This suggests that the crude oil generated in the early stage has a high content of heavy components, which may be converted to small, saturated hydrocarbons and other light components after entering the high maturity stage, consequently enhancing the shale oil mobility. Furthermore, a large quantity of gaseous hydrocarbons also results in overpressure and facilitates the flow of shale oil out of the micro-and nano-pores.
In summary, accounting for the mobility of retained hydrocarbons for the evaluation of lacustrine shale oil enrichment zones/sections can improve the probability of economic shale oil development. The mobility of retained hydrocarbons is evaluated according to thermal maturity (Ro), gas oil ratio (GOR), crude oil density, hydrocarbon quality, storage conditions and formation energy, which can be complete with abundant production data.
2.2.1. Thermal maturity (Ro)
Ro is an important factor determining the conversion rate of organic matter and the quality of hydrocarbon product. It greatly affects the quantity, quality, and mobility of retained hydrocarbons. Shale oil enrichment can be divided into two major types: resource sweet spots and engineering sweet spots, which can be selected according to Ro. Resource sweet spot zones mainly refer to the shale zones with both high organic matter abundance and high content of retained hydrocarbons. This type of shale generally has a high content of clay minerals but not necessarily optimal reservoir physical properties and fracturability. The concept of engineering sweet spot zones is similar to shale gas zones, and mainly refer to the shale zone with good reservoir physical properties, a high content of brittle minerals, good engineering reconstruction and fracturability, and a large amount of retained hydrocarbons, but the organic matter abundance of the shale zone might not be high. Exploration practices on the shale oil in the Gulong Sag reveal that the shale with high maturity generally has a high content of movable hydrocarbons (Fig. 6 ), but adsorbed hydrocarbons decrease significantly due to the reduction in heavy hydrocarbons and heavy non-hydrocarbons. This is conducive to enhancing the mobility of shale oil.

Fig. 6. Correlation of the content of movable hydrocarbons with the maturity of shale oil in the Qingshankou Formation in the Gulong Sag, Songliao Basin. The amount of adsorbed hydrocarbon was estimated using the formula y= 88.76x−1.128 (where x means Ro) in Reference [31]. The amount of movable hydrocarbons is the difference between retained hydrocarbons and adsorbed hydrocarbons. |
The conditions for conversion of organic matter to liquid hydrocarbons are different in different lacustrine basins, so the values of Ro are different too. In (semi) saline lacustrine basins, algae with a high content of fatty acid (denoted as oilgae) is typically found. This type of algae contains a large amount of soluble organics and can be converted to liquid hydrocarbons at low temperature, such as the immature and low mature oil found in the western part of the Paleogene Qaidam Basin, with a small Ro (0.6%-0.8%) [20,32]. In saline lacustrine basins, the organic matter often has rich sulfur, and the activation energy for the conversion from kerogen to hydrocarbon is low, so the oil-producing peak in saline lacustrine basins is generally earlier than fresh lacustrine basins. Therefore, the Ro threshold of the shale oil enrichment sections in saline lacustrine basins may be 0.8% or 0.6%, but the TOC must be higher than 2%. This guarantees sufficient retained hydrocarbons and thick shale oil enrichment sections (typically greater than 20 m). Moreover, saline lacustrine basins have a high content of carbonate sediment and good rock brittleness, which are helpful to artificial modification to shale reservoir and building flow channels, to enhance the flow rate of shale oil. Although a large
amount of liquid hydrocarbons are generated at low and medium maturity stages in saline lacustrine basins, it should be noted that the hydrocarbons are almost heavy components and heavy non-hydrocarbons, with high viscosity, high density, more paraffin, and low GOR, so the mobility is poor. In the absence of induced fractures from hydrocarbon generation and natural structural fractures, it is difficult to get high EUR. This should be taken into consideration of shale oil evaluation.
In fresh lacustrine basins, the Ro value corresponding to the peak conversion of organic matter to liquid hydrocarbons is generally higher than 0.9%. The lowest limit of Ro is 0.9%, and the optimal range is 0.9%-1.2%. In fresh lacustrine basins, the petroleum hydrocarbons generated in the “liquid window” have high contents of heavy components and heavy non-hydrocarbons, and the density and viscosity are high (Fig. 7 ). In this case, regardless of the fact that the maturity has reached the main interval of the “liquid window”, the hydrocarbon mobility is not the best. Therefore, if shale oil in fresh lacustrine basins does not have a very high thermal maturity, engineering sweet spot zones (including shale zones with high contents of felsic minerals and tight sandstone) can increase the probability of obtaining high EUR. This is due to the good brittleness of the sweet spot zones, allowing them to be easily fractured, and their ability to receive hydrocarbons from neighboring zones with high TOC, which increases the amount of movable hydrocarbons and flow rate. In addition, engineering sweet spot zones typically have high porosity and large pores, which facilitate the flow of hydrocarbons.
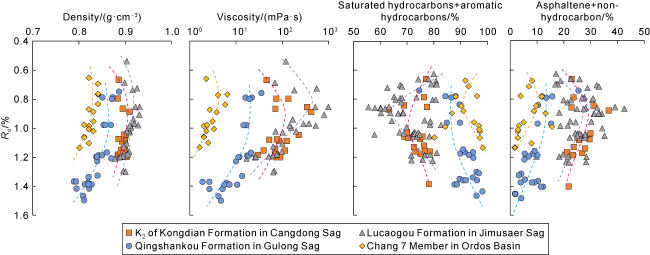
Fig. 7. Changes in the physical properties of shale oil in different liquid windows. |
When Ro>1.2%, as heavy hydrocarbons are converted to light and medium hydrocarbons, and heavy components are cracked into smaller molecular clusters, the mobility of retained hydrocarbons becomes better. In this case, although the adsorption of organic matter to hydrocarbons increases with TOC, the contribution of high TOC to retained hydrocarbons is large. High TOC makes greater contribution to the amount of retained hydrocarbons. Moreover, the increase in maturity can improve hydrocarbon mobility. Thus, the resource sweet spot zone with high TOC can deliver high EUR and is the main enrichment zone of shale oil.
2.2.2. Gas oil ratio
As an indicator of the content of movable hydrocarbons, GOR reflects the formation energy to some extent. According to the available production test data, the GOR threshold of movable hydrocarbons in lacustrine shale oil enrichment zones/sections is 80 m3/m3, and the optimal range is 150-300 m3/m3 [2]. Thermal simulation experiments were conducted on a shale section in the Qingshankou Formation in the Gulong Sag. The results reveal that when Ro>0.9%, the GOR of the hydrocarbon generated generally exceeds 80 m3/m3; when Ro>1.2%, the GOR is higher than 100 m3/m3, and the maximum value is 400 m3/m3 (Fig. 8 ). According to the statistics of shale oil production in the Gulong Sag, when GOR>80 m3/m3, the cumulative production of oil equivalent per well was over 4000 m3 by the end of 2022; when the GOR was 150-300 m3/m3 (Fig. 9 ), and the cumulative production was stable at 4000-6000 m3. The statistics of shale oil production of Bakken, Eagle Ford, and Permian shale reservoirs in the USA also demonstrate high shale oil production when GOR at 80-2000 m3/m3, and peak production happens at GOR at 150-300 m3/m3 (Fig. 9 ). High GOR means a high content of movable hydrocarbon and high formation energy, which are helpful to high single-well oil production and economic benefits.
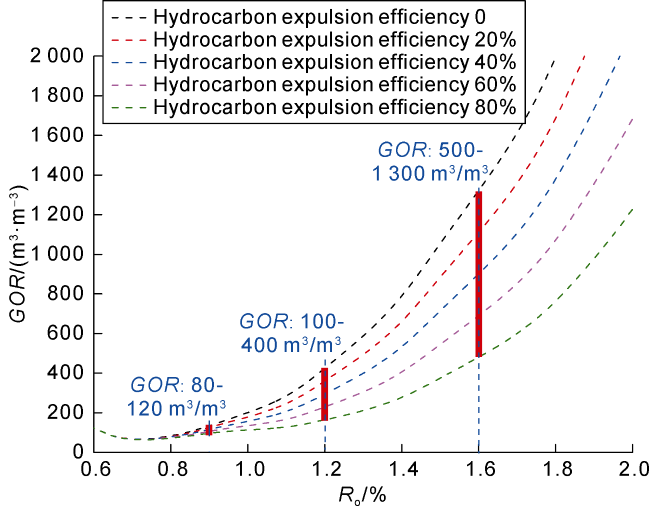
Fig. 8. Correlation between GOR and Ro for hydrocarbon production of shale in the Qingshankou Formation of the Songliao Basin (based on simulation experiments and hydrocarbon-producing kinetics). |

Fig. 9. Correlation between GOR and oil production in (a) Gulong Sag and (b) important shale oil production areas in the United States. |
2.2.3. Density of crude oil
The density of crude oil is an important indicator of the mobility and flow rate of shale oil in micro-and nano-pores. In particular, low density means high contents of light and medium hydrocarbons and low contents of heavy hydrocarbons and heavy non-hydrocarbons. This study sets the standard according to shale oil occurrence environment and reservoir porosity and permeability. According to the correlation between single-well shale oil production and shale oil density of the Qingshankou Formation in the Gulong Sag, the upper limit of the density of pure shale oil is 0.85 g/cm3. The lower the density, the more favorable for oil production (better less than 0.82 g/cm3). Resource sweet spots are possible in high maturity (Ro>1.2%) zones. Transitional shale oil in saline lacustrine basins appears earlier, and the mobility is poor, but the shale has a high content of carbonate minerals and good brittleness, so it is easily fractured to induce good flow channels. In addition, it is easy to have structural fractures and pressured fractures induced by hydrocarbon generation, so the porosity and permeability are high, and the lower limit of density may be 0.89-0.90 g/cm3. For example, shale oil in the Lucaogou Formation, S3 and S4 members, and K2 Member show the above characteristics.
2.2.4. Hydrocarbon composition
Hydrocarbon composition is an indicator of the content of light and heavy components in shale oil and can reflect the mobility of retained hydrocarbons. It can be divided into two stages, namely, the medium-high maturity stage and the low-medium maturity stage. For shale oil with medium and high maturity and Ro>0.9%, the group composition can be expressed as the content of saturated hydrocarbons or content of (saturated hydrocarbons + aromatic hydrocarbons), and the n-alkane composition can be expressed as C1-14/C15+. According to statistics, the content of saturated hydrocarbons of the shale oil with medium and high maturity exceeds 80%, the content of (saturated hydrocarbons + aromatic hydrocarbons) exceeds 90%, and C1-14/C15+ exceeds 0.8. For the shale oil in the Qingshankou Formation in the Gulong Sag and the Chang 73 in the Ordos Basin, the content of saturated hydrocarbons higher than 80% and C1-14/C15+ ranges from 0.8 to 1.5. For shale oil with low and medium maturity and Ro between 0.6% and 0.9%, C1-21/C22+ can be used to denote mobility and as an evaluation parameter. Based on this, the lower limit of the content of saturated hydrocarbons is 55%, the content of (saturated hydrocarbons + aromatic hydrocarbons) greater than 75%, and C1-21/C22+>1.0 (Fig. 10 ).

Fig. 10. Correlation between density and hydrocarbon composition of shale oil in the Lucaogou Formation in Jimusaer Sag and the second member of the Kongdian Formation in Cangdong Sag. |
2.2.5. Storage conditions and formation energy
Storage conditions refer to the confining effect formed by the breakthrough pressure, stability, and integrity of the roof and floor of the shale zone with a high content of organic matter. They play an important role in ensuring the maximum retention of light and medium components, and increasing movable hydrocarbons in the shale. The storage conditions of the shale oil in the Gulong Sag were evaluated in terms of caprock thickness, breakthrough pressure, and integrity. In the shale oil enrichment zone delivering high oil production, the lowest limit of caprock thickness is 2-5 m, the breakthrough pressure is higher than 10 MPa (preferentially higher than 15 MPa), and no obvious open faults in the roof and floor. Two shale oil wells with significantly different storage conditions in the Gulong Sag were selected to investigate the difference in the ratio of saturated hydrocarbons to aromatic hydrocarbons, in order to verify the effects of storage conditions on the retention of movable hydrocarbons. Wells Y47 and G851 were drilled into high-maturity zones with Ro>1.2%. The target layers in the two wells are comparable, and the key indicators of their shale oil enrichment zones are similar. No obvious faults are observed around Y47, but faults are present in the seismic section around G851. The shale extract from the middle and lower parts of the first member of the Qingshankou Formation in Y47 is measured that the content ratio of saturated hydrocarbons to aromatic hydrocarbons is 22, indicating a high content of movable hydrocarbons. The shale extract from the corresponding section in G851 has a content ratio of saturated hydrocarbons to aromatic hydrocarbons of only 15, suggesting that more saturated hydrocarbons are lost than aromatic hydrocarbons.
Formation energy is an important condition for good mobility and flow rate of shale oil. It can be characterized by formation pressure coefficient. According to the available production test data, the shale oil enrichment zone where wells can deliver high initial production and high EUR is usually over-pressurized, with a pressure coefficient greater than 1.2 (preferentially 1.3-1.5), although higher pressure inevitably leads to serious engineering risks. The existing shale oil wells with high production and EUR in the Gulong Sag are all located in the light oil belt with a pressure coefficient greater than 1.2, and the area with a pressure coefficient greater than 1.4 has higher EUR. Platforms 1, 2, and 5 delivering high shale oil production from the second member of the Kongdian Formation in the Cangdong Sag in the Bohai Bay Basin have formation pressure coefficients between 1.2 and 1.5.
2.3. Engineering-related factors
Engineering-related factors of shale oil refer to the geological factors and production system that can affect artificial stimulation performance and cumulative shale oil production, including shale brittleness, laminated structure, and lithofacies. These factors not only affect shale fracturing treatment performance [33-34] but also exert a great impact on hydrocarbon adsorption and mobility. In terms of shale brittleness, attention should be paid not only to the content of brittle minerals but also to the diagenesis stages. For shale with Ro<0.9%, the diagenesis stage is typically Stage A or earlier, the clay minerals exhibit a high montmorillonite content, and the rock has a strong plasticity and absorption performance. A high brittle mineral content is required to improve modifiability (greater than 60%). As mentioned above, only the shale in saline lacustrine basins can meet the conditions. In addition, the TOC cannot be too low, or the quantity of retained hydrocarbons and formation energy cannot fully ensure high EUR. For the shale with Ro>0.9%, the diagenesis stage is usually stage B or later, and a large amount of montmorillonite is converted to illite, and silica is separated out, which increases the shale brittleness. Therefore, the threshold of the content of brittle minerals can be lowered. The content of brittle minerals must be higher than 50%, and the content of clay minerals (mainly illite and chlorite) must be less than 40%. Shale oil production exhibits an increasing trend if the shale in the Qingshankou Formation in the Gulong Sag has a brittle mineral content greater than 50%.
Laminated structure refers to the lamellar occurrence frequency and lamellar peelability of shale. It can be characterized by the percentage of peelable laminae. Lamina structures are widely developed in lacustrine shale intervals. Some laminae fit well with bedding and are easily peeled. They not only provide space for shale oil enrichment but also advantageous channels for shale oil to flow. According to the statistics of the enrichment sections of shale oil in the Songliao Basin and the Junggar Basin, the bedding fracture density is positively correlated with the porosity and the total hydrocarbon content. For example, in the first member of the Qingshankou Formation in the Gulong Sag, when the bedding fracture density exceeds 1 500 fractures/m, the shale porosity is higher than 12% (Fig. 11 ).
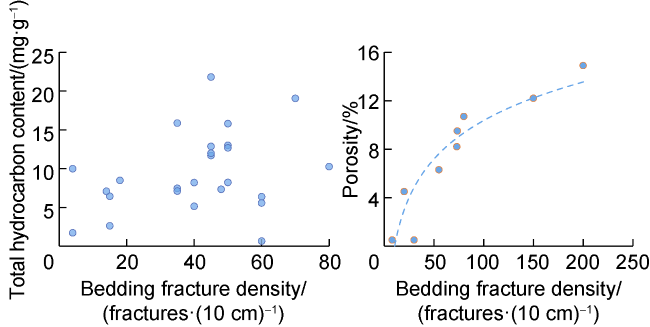
Fig. 11. Correlation between bedding fracture density and the content of retained hydrocarbon and porosity of the Qingshankou Formation shale in the Gulong Sag, Songliao Basin. |
Shale lithofacies refers to the lithofacies types classified according to the composition of rock-forming minerals. Numerous types of lacustrine shale lithofacies have been reported. Among them, laminated felsic shale and laminated biosparite (aphanite) marl shale are the most favorable lithofacies for the enrichment of movable hydrocarbons in shale oil with medium and high maturity due to their large reservoir space and well-developed matrix pores. The laminated felsic shale in the second member of the Kongdian Formation in the Cangdong Sag has the highest content of oil, and its percentage of movable hydrocarbons reaches 46.7%. The laminated biosparite marl shale with a high content of organic matter and the laminated aphanite marl shale with a high content of organic matter in the fourth member of the Shahejie Formation in the Jiyang Sag has good porosity and a high oil content.
A reasonable production system can help good mixing of multiple hydrocarbon components in the micro- and nano-pores in shale and thus has an important impact on cumulative shale oil production. As a development issue, it is also a concern for geological evaluation in terms of resource economics and recoverable reserves. A reasonable production system involves controlling pressure to maximize the flow of shale oil, providing the adequate mixing of hydrocarbon components, and allowing for an appropriate nozzle and pressure drop for stable component flow. Moreover, once relatively stable production and minimum pressure drop are determined, the production system cannot be randomly changed and should remain stable for a long time. A reasonable production system can help keep a stable flow of mixed hydrocarbons, and facilitate the flow of heavy hydrocarbons and heavy non-hydrocarbons out of the reservoir, thus greatly enhancing shale oil production and economic benefits.
3. Enrichment features of movable hydrocarbon and exploration value of shale oil in Gulong Sag
Shale oil in the Gulong Sag is developed in the Upper Cretaceous Qingshankou Formation, mainly enriched in members 1 and 2, and divided into nine sweet spot zones (Q1-Q9) from bottom upward, totally 80-130 m. The lithology is dominated by shale, with a few thin layers of shell limestone and siltstone. The shale oil belongs to pure shale oil. The organic matter has high abundance, good types, high thermal evolution, high GOR, large pressure coefficient, and good storage conditions [35] (Table 1 , Fig. 12 ). According to the evaluation criteria proposed in this study, the shale oil in the Gulong Sag is the most potential to make a breakthrough and large-scale production increase in all lacustrine shale oil types in China, so it is worthy of expectation [36].
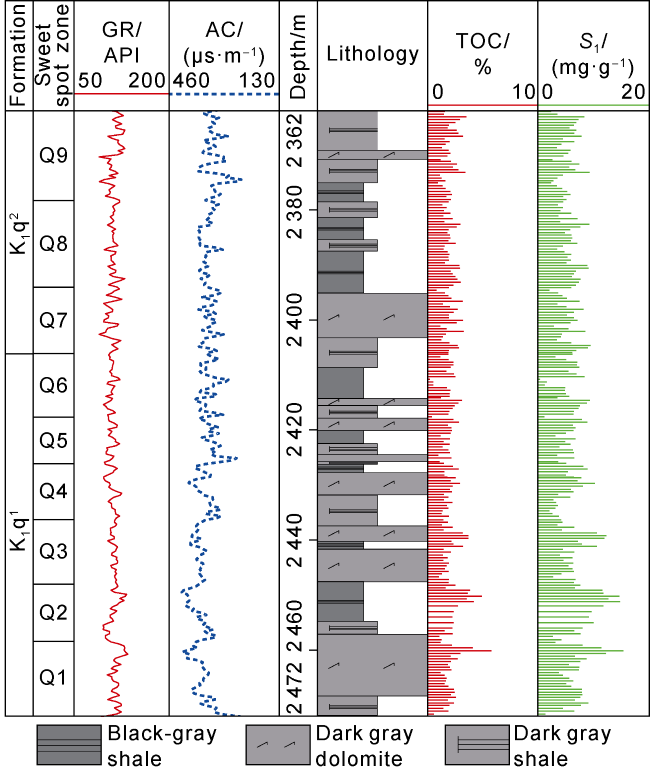
Fig. 12. Lithology and geochemical features of the Qingshankou Formation in Well 8HC in Gulong Sag, Songliao Basin. |
3.1. Enrichment features of movable hydrocarbon
The shale oil in the Gulong Sag has an excellent material basis, outstanding conditions and favorable engineering-related factors for enrichment. More specifically, as typical pure shale oil, the shale oil in the Gulong Sag has high abundance of organic matter, good type, high retained hydrocarbons content, high movable hydrocarbon index, and good pore space. The shale in the first and second members of the Qingshankou Formation have TOC of 1%-6% (avg. greater than 2%), types I-II1 kerogen, retained hydrocarbon S1 at 4-15 mg/g (avg. greater than 7 mg/g), and OSI>200 mg/g. The effective porosity is 4%-6%. It is a favorable value and allows for the retainment of a sufficient amount of petroleum hydrocarbons in the shale reservoir, providing abundant shale oil resources.
In addition, the shale oil exhibits a good hydrocarbon mobility, with Ro ranging within 1.2%-1.4% (max. 1.6%), GOR>100 m3/m3, saturated hydrocarbon content greater than 80%, ΣC1-14/ΣC15+>0.8, crude oil density less than 0.85 g/cm3 (mainly 0.78-0.82 g/cm3), and pressure coefficient greater than 1.2 (mainly greater than 1.4). This suggests that the shale oil in the Gulong Sag has a high content of light components and favorable storage conditions in the major enrichment sections, and can help achieve high EUR and support large-scale production [4].
In terms of favorable engineering-related factors, the shale in the first and second members of the Qingshankou Formation is at the diagenesis stage B [37]. The clay minerals are mainly illite, so the shale has good brittleness, laminated structures, high peelability, and strong anisotropy. In particular, the tensile strength and fracture toughness along the direction parallel to the laminar are lower than those along the vertical direction, and the fractures induced by artificial reconstruction tend to extend along the laminar. The lithofacies are mainly laminated felsic shale with good reservoir space and an interconnected micro- and nano-pore system. The pores are 10-30 nm and the throats are 4-7 nm.
In summary, the shale oil in the Gulong Sag has numerous advantageous properties, including an excellent material basis, high hydrocarbon mobility, and a large amount of movable hydrocarbons. However, the disadvantageous include small pores and throats and complex structures. Therefore, the primary target enrichment sections need to be selected carefully, with the establishment of an appropriate production system. Great breakthroughs to commercial development can be achieved given the development of a stable component flow.
3.2. Exploration potential
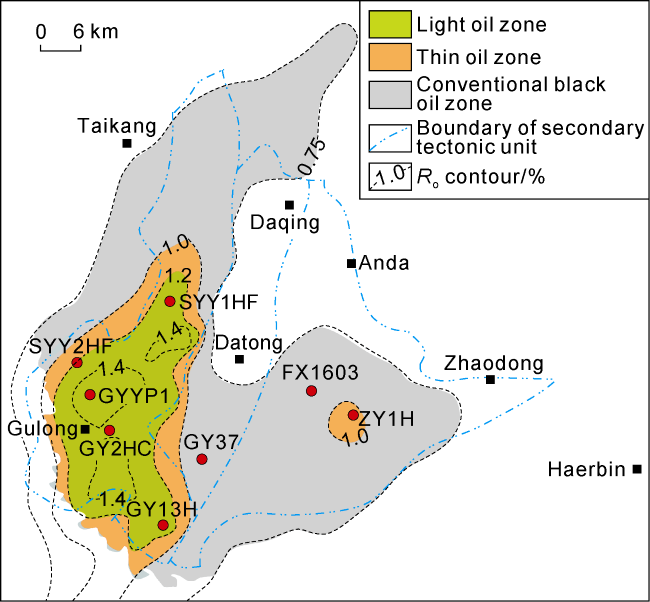
The shale oil in the Gulong Sag has a high content of movable hydrocarbons and can support large-scale production and improve economic benefits. According to the geological conditions, the Daqing oil field is divided into light, thin, and black oil belts. Following the classification conditions of the Daqing oil field and the criteria proposed in this study, the indexes of the enrichment of movable hydrocarbons in the light oil belt are as follows: Ro>1.2%, TOC>2%, S1>6 mg/g, pressure coefficient greater than 1.4, crude oil density less than 0.82 g/cm3, GOR>100 m3/m3. The total area is 2326 km2, the amount of the resource calculated by the volumetric method is approximately 20.8×10⁸ t, and the predicted geological reserves are 12.68× 10⁸ t. The light oil belt is not only a resource sweet spot and favorable enrichment zone but also a key belt for large-scale shale oil production. The thin oil belt is located in the zone with 1.2%>Ro≥1.0%, TOC>2%, S1>4 mg/g, pressure coefficient of 1.2-1.4, crude oil density of 0.82- 0.85 g/cm3, and GOR of 50-100 m3/m3. The favorable area is 4 863 km2, and the resource amount is 32.5×10⁸ t. The hydrocarbon mobility in the thin oil belt is lower than the light oil belt, so the focus of exploration should be on the “engineering sweet spot zone” with high porosity and permeability, good brittleness, and receiving hydrocarbons from neighboring zones. The black oil belt is located in the zone with 1.00%>Ro>0.75%, TOC>2%, S1>3 mg/g, pressure coefficient of 1.1-1.2, crude oil density greater than 0.85 g/cm3, and GOR<50 m3/m3. The resources are 98×108 t. Tight shale oil is found in the black oil belt (Fig. 13 ).
Fig. 13. Zones of shale oil types in the Qingshankou Formation in the Songliao Basin. |
In order to promote the large-scale production of shale oil in the Gulong Sag, it is recommended to organize shale oil exploration and production test at two scales. First, taking Q2-Q3 and Q9 with high organic matter abundance, high reservoir porosity, and high content of oil as targets, conduct exploration and production test, develop a reasonable and feasible development system, and actively promote production construction, and thus achieving large-scale production and high economic benefits as soon as possible. Second, take the other enrichment zones and the thin and black oil belts with Ro<1.2% as targets. Due to low organic matter abundance and maturity, the content of heavy hydrocarbons is high and the mobility is poor, resulting in unstable production performances. Considering that a reasonable production system has not been established, it is suggested to reduce drilling operation, conduct more studies and find successive zones after the primary enrichment zones. The exploration should be organized according to resource sweet spot zones, engineering sweet spot zones, and tight oil sweet spot zones. For the light oil belt with Ro≥1.2%, the material basis, oil mobility, and engineering-related factors are all favorable, and focus should be placed on the selection of resource sweet spot zones. For the thin oil belt with 1.0%≤Ro<1.2%, engineering sweet spot zones with favorable reservoir physical features and engineering-related factors should be selected. For the black oil belt with Ro of 0.75%-1.00%, due to the low conversion rate of organic matter caused by low maturity, the shale has a high content of illite and smectite mixed layers, strong absorption, a low content of movable hydrocarbons, poor mobility, and low brittleness, so focus should be placed on the tight shale oil in sandstone or carbonate interlayers, in order to reduce unnecessary investments. Furthermore, deepening the basic research on hydrocarbon adsorption and the flow mechanisms of pure shale oil is necessary to provide a basis for the comprehensive evaluation of total available resources and reserve calculation in the Gulong Sag.
4. Conclusions
The amount of movable hydrocarbons is a key factor influencing the economic development of shale oil in enrichment zones/sections, and evaluating the enrichment factors of movable hydrocarbons is an important part of shale oil evaluation. The evaluation of the enrichment of movable hydrocarbons in shale oil should initially focus on controlling the material basis. More specifically, the TOC value can be determined according to the thermal maturity and lacustrine basin environment, with the threshold greater than 2% (3%-4% is preferred). Shale with high maturity and TOC is favorable for the formation of resource sweet spots. The mobility of retained hydrocarbons can be evaluated in terms of Ro, storage conditions, crude oil density, hydrocarbon composition, and GOR. Different criteria are selected according to Ro and shale lithofacies types. For the pure shale in fresh lacustrine basins, the optimal index values are as follows: Ro>1.2%, GOR>100 m3/m3, saturated hydrocarbons content higher than 80%, C1-14/ΣC15+>0.8, crude oil density less than 0.82 g/cm3, and pressure coefficient greater than 1.2. For the shale in saline lacustrine basins, the optimal index values are as follows: Ro>0.6%, GOR of 50-80 m3/m3, crude oil density less than 0.9 g/cm3, saturated hydrocarbons content greater than 55%, (saturated hydrocarbons + aromatic hydrocarbons) greater than 75%, and C1—21/C22+>1.0. The engineering-related factors should be conducive to the establishment of favorable artificial flow channels, as well as high cumulative oil production. In addition, shale brittleness, laminated structure, and shale lithofacies should be included in the evaluation of enrichment sections. Production system has a great impact on the ability of shale oil to achieve the maximum EUR. Maintaining a stable underground component flow is a prerequisite for pressure control, nozzle selection, and production system selection.
With favorable enrichment conditions and large exploration potential for movable hydrocarbons, the shale oil in the Gulong Sag of the Songliao Basin is the best among lacustrine shale oil types in China to achieve scale exploration breakthrough and production construction. Considering the differences in amount and mobility, exploration types should be selected according to the resource sweet spot zones, engineering sweet spot zones, and tight oil sweet spot zones. This can help achieve commercial development and construct the Gulong Sag as a national demonstration for effective exploration and development of shale oil.
Acknowledgments
We would like to thank Academician Liu He, Professor Zhang Shuichang and Professor Zhu Rukai from the CNPC Research Institute of Petroleum Exploration and Development for their kind guidance and advice on this paper.
Nomenclature
EUR—estimated ultimate recovery, t;
GOR—gas-to-oil ratio, m3/m3;
OSI—oil saturation index, mg/g;
S1—amount of retained hydrocarbons, mg/g.