

Introduction
The exploration and development of continental tight oil in China have made positive progress in recent years, and it shows enormous resource potentials and good development prospects [1⇓⇓⇓-5]. Continental tight oil has become a realistic unconventional petroleum resource in China, and it is an essential supplement to the increase of oil reserves and production [6].
Continental tight oil in China is widely developed in basins of Ordos, Songliao, Junggar, Santanghu, Bohai Bay, Qaidam and Sichuan, which cover the eastern, central, and western regions of China [6]. The tight oil-bearing strata include the Permian Lucaogou Formation, the Permian Tiaohu Formation, the Triassic Yanchang Formation, the Da'anzhai section of the Jurassic Ziliujing Formation, the Cretaceous Qingshankou and Quantou formations, the Paleogene Shahejie Formation, and the Paleogene Lower Ganchaigou Formation [7⇓⇓⇓⇓⇓-13]. Different basins and strata have formed a variety of lithological tight reservoirs, including tight sandstones, mixed rocks, tuffs and carbonate rocks [6]. Many systematic studies were carried out on the development areas of different types of continental tight oil reservoirs, together with the formation conditions and distribution characteristics. For the distribution law, it has been clear that tight oil is distributed continuously over a large area. However, the degree of enrichment varies greatly, and it is symbiotic with high-quality source rocks [1,14 -15]. In terms of formation, migration and accumulation mechanisms, the core mechanism for tight oil is revealed as “near-source accumulation” [14-15] without experiencing large-scale and long-distance migration [16], and driven by pressure induced by hydrocarbon generation and expulsion [17]; differential pressure charging as well as local rapid migration of oil along the dominant channel of longitudinal and transverse fractures, large-area unbalanced migration in pore-throat network, and concentrated accumulation in the intersection areas of vertical and horizontal fractures are studied [18]. In terms of the main controlling factors of tight oil enrichment, more than a dozen control factors such as structural background, high-quality source rocks (near hydrocarbon source centers), reservoir sweet spots, including physical properties, thickness, and favorable reservoir facies, hydrocarbon generation and expulsion pressurization, good source-reservoir combination, natural fractures, formation pressure coefficient, oil saturation, crude oil viscosity et al. were sorted out [6,15,18⇓ -20]. In addition to the studies focusing on the entire continental tight oil reservoirs, some scholars have carried out specific studies on the tight oil of each sedimentary basin, and further clarified the geological characteristics and unique accumulation mechanisms of different tight oil areas. For example, the Triassic Yanchang Formation of the Ordos Basin, the Cretaceous Qingshankou and Quantou formations of the Songliao Basin, the Permian Lucaogou Formation of the Junggar Basin, the Permian Tiaohu Formation of the Santanghu Basin, the Jurassic Da'anzhai Section of the Sichuan Basin, the Paleogene Sha 4 Member of Leijia area of Liaoxi and the Paleogene lower Ganchaigou Formation in the Zahaquan area of the Qaidam Basin were elaborated [7⇓⇓⇓⇓⇓-13].
Comprehensive studies on the basin-scale tight oil accumulation revealed the formation and distribution characteristics of continental tight oil in China and provided a solid theoretical foundation for the exploration and development of tight oil in China [21⇓-23]. However, due to the different sedimentary environments, hydrocarbon source qualities, reservoir physical properties, and source-reservoir configurations, the processes of tight oil migration within the reservoirs are unclear. It is necessary to analyze the microscopic migration and accumulation mechanism of tight oil and then determine the main controlling factors of tight oil enrichment to provide theoretical support for further improving the evaluation index system, evaluating the optimal tight oil enrichment area, and selecting effective sweet spot area (segment). This paper reveals the charging, migration, and accumulation mechanisms of tight oil by physical and numerical simulations and taking tight oil in major continental lake basins as cases, analyzes the factors affecting tight oil enrichment, with the intent to provide technical supports for efficient exploration and development of tight oil in China.
1. Experimental methods and samples
Simulation for crude oil charging, migration, and accumulation can be conducted by physical and numerical methods. Physical simulation methods include segmented constant pressure, computed tomography (CT) displacement, and nuclear magnetic resonance coupling displacement (NMR-DP) measurements. The segmented constant pressure method cannot reflect the distribution of fluids in different pore sizes, and the CT displacement method cannot solve the contradiction between the field of view and resolution [24]. So far, NMR-DP method is considered the most suitable physical simulation for tight oil charging [24]. The numerical simulation builds a pore-throat model or reconstructs a three-dimensional digital core model based on CT, focused ion beam scanning electron microscopy (FIB-SEM) and other experiment data, and uses Lattice Boltzmann, molecular dynamics, or other methods to simulate microscopic fluid migration and accumulation. However, the tight oil charging simulation in a simple pore-throat model cannot reflect the flow complexity in rock. Therefore, reconstructing a three-dimensional digital core model is a more effective method for numerical simulation of the tight oil charging process. NMR-DP physical simulation reflects tight oil charging process by analyzing the nuclear magnetic signals collected during the displacement. This experiment uses fluorine oil (fluoride liquid, Type FC-40) without the hydrogen signal to displace formation water in the rock core. Since the formation water has hydrogen signals, the standard brine with 8500 mg/L salinity was prepared according to the formation water data. The volume of water detected in the NMR lateral relaxation time (T2) spectra during the flooding process continuously reduces, and the signal amplitude consecutively decreases, reflecting the process that fluorine oil constantly displaces the formation water in the pores. The specific steps are as follows: (1) Before the experiment, the sample was washed with oil, dried, and weighed. Measure the porosity and permeability with gas and test the NMR response of the dry sample; (2) Vacuum and pressurize to 15 MPa, saturate with formation water, weigh, and test the NMR response of the saturated sample; (3) First displace at a constant velocity (0.05 mL/min), and measure T2 spectra every 10 min to observe the change. When the signal amplitude of T2 spectra changes significantly, it means the displacement has begun. Keep displacing at constant pressure; (4) When the signal amplitudes of two consecutive T2 spectra do not change significantly, increase the inlet pressure. Stop displacing until the T2 spectra keep stable at higher pressure. For experimental instruments, experimental procedures, conditional parameters, and data processing, please refer to Reference [24]. The Lattice Boltzmann numerical simulation adopts the D3Q27 model to simulate the effects of charging pressure, wettability, and microfractures (fracture direction, opening, length) on the charging results of tight oil, where “3” represents the dimension of the lattice model and “27” represents the number of lattice velocity vectors. The solid boundary adopts the rebounce model in the Lattice Boltzmann model. The simulated physical space step is 1×10⁻⁷ m, the physical time step is 1×10⁻⁹ s, and the physical characteristic velocity is 1×10⁻³ m/s. Before the simulation, the ZEISS CT 3DX ray microscope is used to scan the sample with a scanning resolution of 100 μm and a scanning field of view of 1747 μm. The CT scan image is then encrypted, filtered, threshold segmented, and binarized to obtain a three-dimensional digital core of the tight sandstone sample. To reduce the simulation time, a model of 210 μm× 80 μm×40 μm is extracted from the reconstructed 3D digital core as a simulation platform for oil-flooding-water, with a simulation pixel accuracy of 0.1 μm and an interval of 0.1 s between the output results during simulation. The model parameters are as follows: the simulated temperature is 100 °C, the pressure is 19 MPa, the simulated formation water viscosity is 1.0 mPa·s, the simulated formation crude oil viscosity is 1.45 mPa·s, the simulated aqueous phase density is 1.00 g/cm3, and the simulated crude oil density is 0.78 g/cm3. During the numerical simulation, the effects of charging pressure, wettability, and microfractures (fracture direction, opening, length) on the charging results of tight oil were tested. The model and simulation conditions used in the Lattice Boltzmann numerical simulation refer to references [25-26].
To reflect the charging characteristics of different types of tight oil, siltstone of the Cretaceous Qingshankou Formation in the Songliao Basin, tuff of the Permian Tiaohu Formation in the Santanghu Basin, basalt and mixed rock of the Permian Lucaogou Formation were selected for simulation experiments (Table 1 ). The samples of the Qingshankou Formation in the Songliao Basin for NMR-DP experiments are siltstone, but their physical properties and fracture development are different. The samples from the Santanghu Basin used for NMR-DP simulation are different too. Two tuff samples have impenetrable fractures (M56-3, M56H-4), one has penetrating fractures (M702-3), a basalt sample (T25-1) has underdeveloped fractures, and one sample is mixed rock (M56-6).
Table 1. Sample parameters for NMR-DP physical simulation |
| Basin | Well | Sample No. | Depth/ m | Formation | Length/ cm | Lithology | Diameter/ cm | Porosity/ % | Permeability/ 10−3 μm2 | Fracture development |
|---|---|---|---|---|---|---|---|---|---|---|
| Qijia-Longhupao areas in the Songliao Basin | G708 | G708-B | 1989.50 | Qingshankou Formation | 3.010 | Siltstone | 2.50± 0.02 | 13.66 | 0.040 0 | Undeveloped |
| G72 | G72-B | 2017.50 | 3.571 | 18.03 | 15.858 0 | Penetrating fractures developed | ||||
| G93 | G93-A | 2052.66 | 3.096 | 10.48 | 0.086 8 | Relatively developed | ||||
| J37 | J37-A | 1852.61 | 4.150 | 17.00 | 3.280 0 | Developed | ||||
| J44 | J44-B | 2147.75 | 2.540 | 9.40 | 0.911 4 | Developed | ||||
| G921 | G921-D | 1909.81 | 3.600 | 10.95 | 1.154 4 | Developed | ||||
| J392 | J392-C | 1824.70 | 3.681 | 13.71 | 0.060 2 | Undeveloped | ||||
| J393 | J393-D | 1950.35 | 4.216 | 4.41 | 0.016 5 | Undeveloped | ||||
| J191 | J191-E | 1838.11 | 3.240 | 6.45 | 0.022 5 | Undeveloped | ||||
| T234 | T234-A | 1772.30 | 3.590 | 16.26 | 1.830 0 | Developed | ||||
| T234 | T234-B | 1771.18 | 3.927 | 11.88 | 0.214 9 | Relatively developed | ||||
| L29 | L29-B | 1918.92 | 3.050 | 14.46 | 0.066 6 | Underdeveloped | ||||
| L23 | L23-B | 1882.00 | 3.244 | 9.41 | 0.067 7 | Underdeveloped | ||||
| Santanghu Basin | Ma56 | M56-3 | 2142.80 | Tiaohu Formation | 5.575 | Tuff | 2.50± 0.02 | 27.62 | 0.184 5 | Impenetrable |
| Ma56-12H | M56H-4 | 2130.82 | Tiaohu Formation | 3.127 | Tuff | 14.74 | 0.141 0 | Impenetrable | ||
| Ma702 | M702-3 | 1818.80 | Tiaohu Formation | 3.836 | Tuff | 9.25 | 13.190 0 | Penetrating fractures developed | ||
| Tiao25 | T25-1 | 1157.48 | Tiaohu Formation | 2.240 | Basalt | 9.11 | 0.028 5 | Underdeveloped | ||
| Ma56 | M56-6 | 2668.50 | Lucaogou Formation | 3.853 | Mixed rock | 4.54 | 0.034 2 | Underdeveloped |
2. Tight oil charging, migration and accumulation in continental lake basins
The study of tight oil charging and migration and accumulation mechanisms is mainly to find the accumulation process and control factors. The charging power and resistance of crude oil control the charging and accumulation process and determine the degree of enrichment of tight oil. This study simulates the charging process, and reveals the charging and accumulation mechanism to analyze the enrichment factors and select favorable tight oil reservoirs.
2.1. The dynamic forces driving hydrocarbon generation and expulsion of high-quality source rocks are the foundational power that determines the charging efficiency and accumulation of tight oil
The charging power formed by pressure and expansion induced by hydrocarbon generation and expulsion of source rock promotes tight oil charging, migration and accumulation. The results of the NMR-DP simulation showed that the fluorine oil (simulating crude oil), when flooding saturated water in different types of tight reservoir samples, had quite different starting pressure gradients, charging processes, pressure gradients at the end of the charge, and final oil saturations. However, with the increase of the displacement pressure, the oil saturation increased to varying degrees. Taking Santanghu tuff as an example, the starting pressure gradient was low, not exceeding 0.25 MPa/cm, and the oil saturation increased almost linearly during the flooding process. The final oil saturation was stable at about 65% (Fig. 1a ). The Lattice Boltzmann numerical simulation results are similar (Fig. 1b ) to the numerical simulation results, but the latter show oil saturation changes with pressure and time in details. At constant pressure, the oil saturation shows rapid growth and relatively smooth buffer stages.
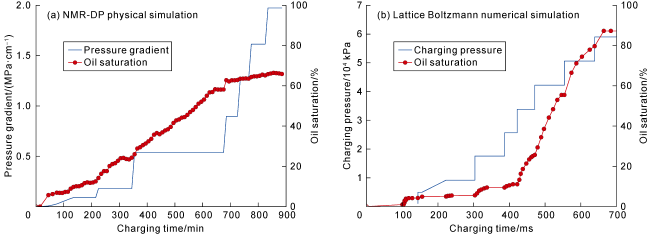
Fig. 1. Effect of charging power on tight oil charging, migration and accumulation (sample number: M56H-4). |
2.2. Oil migration resistance is a crucial factor affecting the charging efficiency and accumulation effect of tight oil
The tight oil migration resistance occurs in the reservoir caused by the capillary pressure of the fine pores and throats in the reservoir. In contrast, the conventional oil migration resistance comes from the cover and the lateral trap block. The pore structure, microfracture development and oil-water interfacial force control the migration resistance of crude oil in the rock. Taking the siltstone samples collected from the Cretaceous Qingshankou Formation in the Songliao Basin as a case, as displacement time and pressure increased, the right peak of the NMR spectra of the sample with good pore structures first shifted downward, followed by the left peak (Fig. 2a ), and the NMR signal significantly reduced. However, only the NMR signal of the main peak of the latter slightly reduced, indicating that large pores are more prone to be charged. The final charging results show that the reservoir with good physical properties could be filled with oil saturation up to 50% (Fig. 2b ). Oil is mainly charged in the pores with relaxation time greater than 1 ms, while water mainly in the pores with relaxation time of less than 10 ms (Fig. 2c ). In the tight reservoir with poor pore structures, the NMR curve moves down directly (Fig. 2d ), the final oil saturation is only about 20% (Fig. 2e ), and oil and water occupy the pores with relaxation time shorter than 10 ms (Fig. 2f ). The starting pressure gradient (less than 0.2 MPa/cm) and the pressure gradient (1.5 MPa/cm) at the end of charging of reservoirs with good physical properties and pore structures are lower than the starting pressure gradient (1.5 MPa/cm) and the corresponding pressure gradient (2.7 MPa/cm) at the end of charging of reservoirs with poor physical properties and pore structures. The above experiments show that the better the physical properties and pore structure of the tight siltstone reservoir, the lower the starting pressure gradient and the pressure gradient corresponding to the end of the charge, and the higher the final oil saturation.
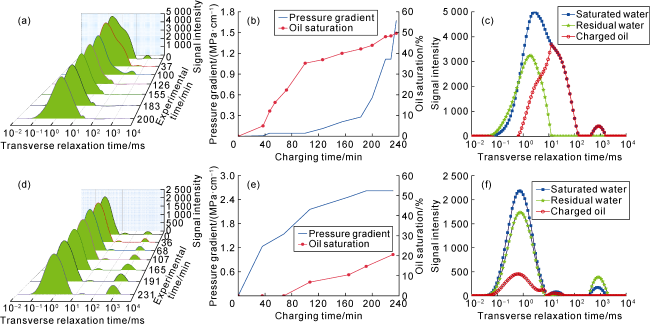
Fig. 2. Physical simulation of the effect of pore structure on tight oil charging and accumulation. (a) Nuclear magnetic signal change during the displacement of signaled formation water with non-signaled fluorine oil, sample T234-A; (b) Changes of oil saturation and pressure gradient during charging, sample T234-A; (c) Distribution of initial saturated water, bound water and charged oil (saturated water-bound water) after charging, sample T234-A; (d) Nuclear magnetic signal change during the displacement of signaled formation water with non-signaled fluorine oil, sample L23-B; (e) Changes of oil saturation and pressure gradient during charging, sample L23-B; (f) Distribution characteristics of initial saturated water, bound water and charged oil (saturated water-bound water) after charging, sample L23-B. |
The three-dimensional pore space and pore-throat connecting space characterized by micro-CT shows that, compared with the tight reservoir of the Qingshankou Formation in the Songliao Basin, the tight reservoir of the Lucaogou Formation in the Santanghu Basin has more micropores (Fig. 3a , 3d) and more connected micropore space (Fig. 3b , 3e). Lattice Boltzmann numerical simulation shows that the seepage channels of the tight reservoirs of the Qingshankou Formation in the Songliao Basin and the Lucaogou Formation in the Santanghu Basin are very narrow. However, the seepage channels of the tight reservoirs in the Lucaogou Formation are denser. Many seepage channels distribute in clusters, which are well connected, and the final oil saturation of charging is high (Fig. 3c , 3f).
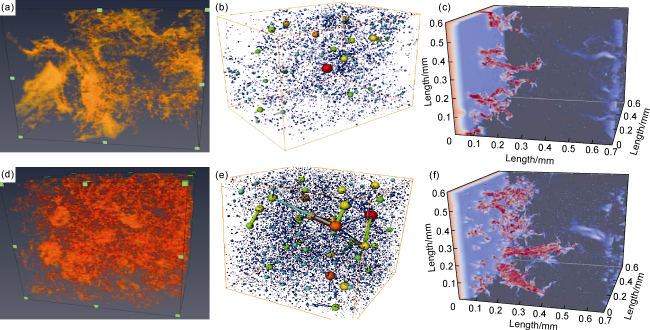
Fig. 3. Influence of pore structure on tight oil charging and accumulation by Lattice Boltzmann physical simulation. (a) Three-dimensional pore characterization by micro-CT, sample T234-A; (b) Three-dimensional pore-throat connection, sample T234-A; (c) Simulated charging process of tight oil, sample T234-A; (d) Three-dimensional pore characterization by micro-CT, sample M56-6; (e) Three-dimensional pore-throat connection, sample M56-6; (f) Simulated charging process of tight reservoir oil, sample M56-6. |
The matrix pore structure determines the difficulty of tight oil charging and accumulation into reservoirs. Micro-fractures provide advantageous migration channels and affect the charging and accumulation process and results of tight oil. Taking the tuff from the Santanghu Basin as an example, the results of NMR-DP physical simulation show similar tight oil charging characteristics between sample M56-3 with developing fractures (fractures not penetrating) perpendicular to the charging direction and tuff sample M56H-4 without fractures, but apparently different from the tight oil charging characteristics of sample M702-3 with penetrating fractures. The NMR signal of the sample with impenetrable fractures gradually decreased with the increase of displacement time and pressure, indicating formation water was displaced. However, the sample with penetrating fractures only has apparent changes in the NMR signal of the right peak, but the NMR signals of the left peak and the center peak did not change, indicating that the penetrating fractures as high-speed channels make it difficult for oil to enter more pores. The results show that with the gradual increases of displacement time and pressure, the oil saturation of M56-3 and M56H-4 gradually increased and could reach above 60%. The comparison of the oil saturations of the two samples shows that the permeability is the main controlling factor of oil saturation. Although the porosity of the two samples is different, their permeability is close (0.184 5×10⁻³ μm2 and 0.141 0× 10−3 μm2, respectively), so the final oil saturation is close. M702-3 sample develops fractures perpendicular to the bedding direction, so the permeability is as high as 13.19×10⁻³ μm2, and the final oil saturation is only about 20% due to the development of penetrating fractures parallel to the direction of charging power. Compared with the tight reservoir of the Qingshankou Formation in the Songliao Basin, the starting pressure gradient of the three samples is very low, not exceeding 0.25 MPa/cm. However, the pressure gradient is different when the charging is completed, among which the final pressure gradient of sample M56-3 is about 2.0 MPa/cm, and that of M56H-4 is about 3.5 MPa/cm, indicating that the lower the permeability, the higher the charging resistance (Fig. 4 ). The Lattice Boltzmann numerical simulation results also show that the final oil saturation of the sample with fractures perpendicular to the charging direction, smaller in opening and shorter is similar to the final oil-gas saturation of reservoir without fractures by numerical simulation results. This is consistent with the physical simulation results of samples M56-3 and M56H-4. The final oil saturation of the sample with fractures parallel to the oil charging direction, opening larger and longer is low, which is consistent with the physical simulation result of sample M702-3.
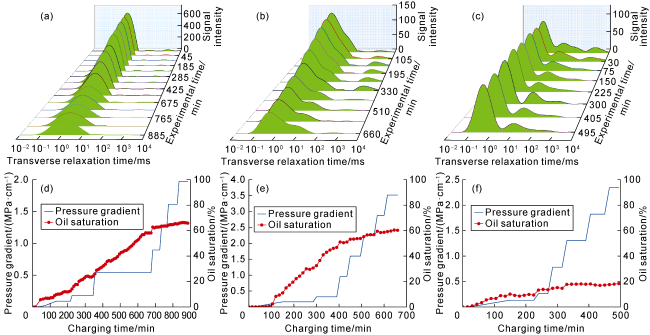
Fig. 4. Effect of micro-fractures on tight oil charging and accumulation by physical simulation on tuff samples of Tiaohu Formation in the Santanghu Basin. (a) Nuclear magnetic signal change during the displacement of signaled formation water with non-signaled fluorine oil, sample M56-3, microfractures perpendicular to the direction of charge; (b) Nuclear magnetic signal change during the displacement of signaled formation water with non-signaled fluorine oil, sample M56H-4, without microfractures; (c) Nuclear magnetic signal change during the displacement of signaled formation water with non-signaled fluorine oil, sample M702-3, microfractures parallel to the direction of charge; (d) Changes of oil saturation and pressure gradient during charging of fluorine oil, sample M56-3 ; (e) Changes in oil saturation and pressure gradient during charging of fluorine oil, sample M56H-4; (f) Changes in oil saturation and pressure gradient during charging of fluorine oil, sample M702-3. |
The oil-rock interfacial force also affects the charging process of tight oil [25]. The Lattice Boltzmann numerical simulation results show that the more oleophilic the reservoir, the closer the oil charging distance is at the same time, and the higher the final oil saturation; the higher the oil viscosity, the lower the final oil saturation.
2.3. The coupling effect of charging force and pore throat resistance of tight reservoir controls tight oil accumulation and sweet spot enrichment
The physical and numerical simulation results show that under the condition of good oil sources, that is, strong oil generation and charging power of source rock, physical properties of the reservoir control the final oil saturation However, the oil saturation varies with reservoir porosity and permeability differently (Fig. 5 ). The relationship between porosity and oil saturation is in three-section distribution. In the first section, the porosity is less than 7%, and the oil saturation slowly increases to about 10% with the porosity. In the second section, when the porosity is 7%-16%, the oil saturation increases sharply to about 65% with the increase of porosity. In the third section, the porosity is greater than 16%, and the oil saturation no longer changes with the increase of porosity and remains at about 65% (Fig. 5a ).
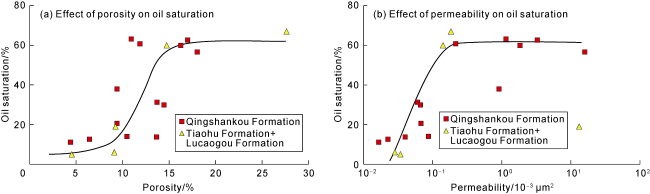
Fig. 5. Effect of reservoir physical properties on oil saturation. |
The relationship between permeability and oil saturation is in two-section distribution. In the first section, when the permeability is less than 0.2×10⁻³ μm2, the oil saturation increases sharply with the increase of permeability, indicating that permeability is the main controlling factor on oil saturation in tight reservoirs. In the second section, when the permeability is above 0.2×10⁻³ μm2, the oil saturation no longer changes with the increase of permeability, indicating that permeability is no longer a controlling factor (Fig. 5b ). Therefore, in the tight oil area with good oil sources, the tight oil sweet spot zone is the sweet spot zone of reservoir physical properties. The boundary is vaguer than conventional oil reservoirs. The reservoir interval corresponding to porosity above 16% and permeability above 0.2×10⁻³ μm2 is a high-quality sweet spot interval, which means the lowest permeability limit of the high-quality sweet spot interval is 0.2×10⁻³ μm2. The reservoir interval corresponding to porosity of 7%-16% and permeability less than 0.2×10⁻³ μm2 is a secondary sweet spot, and the reservoir corresponding to porosity less than 7% and permeability less than 0.2×10⁻³ μm2 is a prospective interval. In the tight oil area with insufficient oil source, the tight oil saturation is controlled not only by the reservoir physical properties but also by the oil source conditions. High-quality reservoirs adjacent to source rocks are the primary targets for sweet spot zones. The distance from the source rock is the first screening criterion, and reservoir quality is the second screening criterion. In addition, in the tight oil areas with extensive fault development, the high-quality reservoirs adjacent to faults are tight oil sweet spot zones.
Through the forgoing analysis, the coupling effect of charging power and resistance control tight oil charging, migration, and accumulation. The pore structure, microfractures and oil-water interfacial force of the reservoir determine tight oil charging and accumulation. Oil source supply, reservoir physical properties and structure control the change of oil saturation. The charging dynamics mechanism, tight oil migration and accumulation efficiency, that is, oil saturation and enrichment, are controlled by three mechanical and medium conditions: the coupling effect of charging force and resistance (charging force depends on the quality of source rock, the amount of hydrocarbon generated and the pressure induced by hydrocarbon expulsion), effective migration system (fault and fracture development determines the seepage mechanism and flow rate of Darcy or non-Darcy flow), and good oil storage and accumulation space (porosity and permeability determine charging resistance, reservoir space, oil accumulation efficiency and oil volume). The analysis of tight oil charging and migration and accumulation mechanisms shows that charging power, reservoir physical properties, structural heterogeneity and fractures control the charging efficiency and accumulation of tight oil (oil saturation). Furthermore, the oil saturation and enrichment of tight oil in continental lake basins are controlled by four factors: hydrocarbon source, reservoir pores, anisotropy, and fractures.
3. Controlling factors on tight oil enrichment in continental lake basins
The previous section about tight oil charging, migration, and accumulation mechanisms shows that charging force, migration resistance, and the coupling effect of the two control tight oil charging efficiency and migration and accumulation effects (oil saturation). The charging force depends on the quality of source rock. Migration resistance depends on the physical properties of reservoir, especially the sizes of pores and throats and their connectivity (permeability). The coupling relationship between the two depends on the source-reservoir configuration, internal structure and heterogeneity, fractures, and other factors.
3.1. High-quality source rocks control the near-source distribution of tight oil
The migration and seepage mechanism and power source of tight oil determine the characteristics of near-source accumulation and apparent “source control”. According to tight oil distribution and the location of source rock, the area of high-quality hydrocarbon source controls the distribution of tight oil. Fig. 6 shows the superimposed map of total hydrocarbon generation strength and tight oil wells from the Jurassic source rocks in the Sichuan Basin. Most of the tight oil wells fall within the range of hydrocarbon generation intensity higher than 40×104 t/km2. Only a few wells are in the area below this hydrocarbon generation intensity.
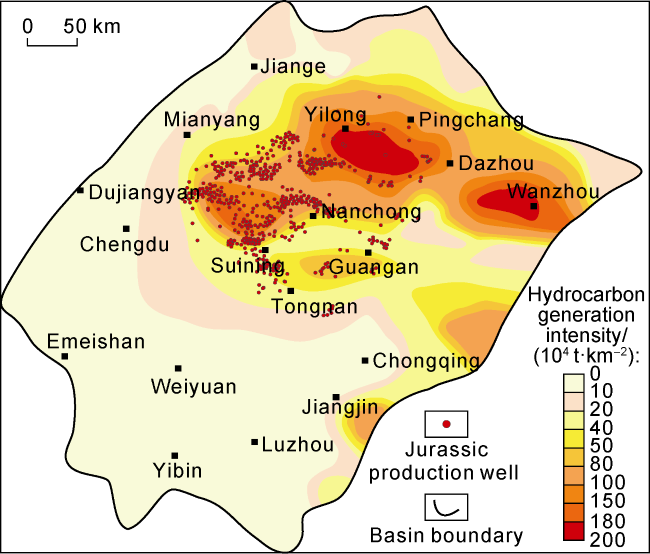
Fig. 6. Hydrocarbon generation intensity and distribution of oil wells sourced from Jurassic source rocks in the Sichuan Basin. |
The source control law of tight oil distribution and enrichment also shows vertical near-source distribution,and vertical source-reservoir combination controls vertical distribution pattern of the oil layer. The main hydrocarbon source layer controls the vertical near-source distribution of oil layers. The relationship between source rock thickness and production shows a positive correlation between source rock thickness with oil production and oil layer proportion. The relationship between the annual production of single wells and the thickness of source rocks from the Da'anzhai member of central Sichuan Basin (Fig. 7 ) indicates that the thicker the source rock, the higher the average annual production of single wells. The boundary of the source rocks controls the distribution of tight oil. However, it is not entirely consistent or parallel to the boundary of the source rock because the secondary migration of tight oil occurs in a short distance. The reservoir sweet spot zone does not fully coincide with the source sweet spot zone.
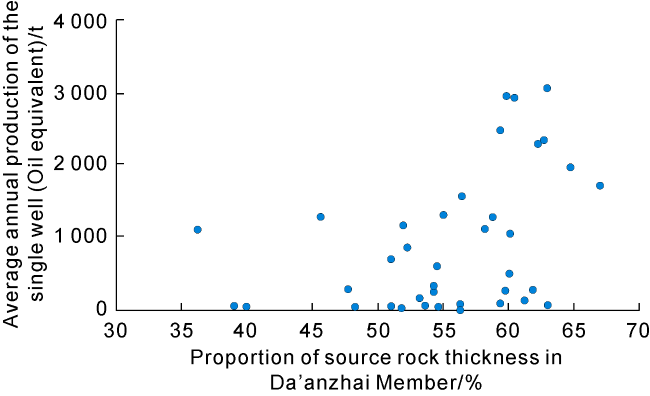
Fig. 7. Relationship between annual production of the single well and source rock thickness in Jurassic Da'anzhai Member in the Sichuan Basin. |
3.2. The physical properties and pore size of reservoir are positively correlated with the degree of tight oil enrichment
When considering the degree of tight oil enrichment, the physical properties and pore-throat size of reservoir are essential controlling factors, which are shown in two aspects: (1) Large pores and throats can hold more hydrocarbons to form rich sweet spot zones; (2) As advantageous migration channels, large pores and throats can promote the migration of tight oil. Under the control of the two factors, the more developed the reservoir, the higher the production of tight oil per well. Fig. 8 reveals the relationship between the degree of oil enrichment, migration efficiency, and physical characteristics of different reservoirs by migration simulation experiments. From the aspect of charging resistance, the starting pressure gradient and critical pressure gradient have an apparent negative power function with permeability (Fig. 8a ) and a more complex relationship with porosity, which is generally negatively correlated (Fig. 8b ). The four anomalies in the upper right corner of Fig. 8b are samples with large pores and small throats. The starting and critical pressure gradients are high. From the aspect of oil saturation, the porosity and permeability are generally linearly and positively correlated with oil saturation. The oil saturation increases significantly as the porosity and permeability increase (Fig. 8c , 8d).
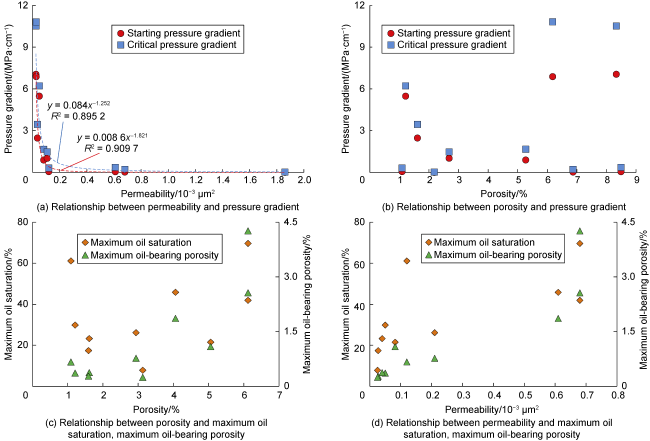
Fig. 8. Relationship between reservoir physical properties and flow characteristic parameters and oil saturation. |
The control effect of reservoir physical properties and pore and throat sizes is shown by the permeability and pore volume proportional to oil saturation (Table 2 ). The mechanism is that bound water is mainly in small pores and throats, so that the higher the proportion of the small pores and throats, the lower the oil saturation. NMR results show that the reservoir with large pores and throats has abundant tight oil.
Table 2. Saturation of samples with different physical properties |
| Sample | Porosity/ % | Permeability/ 10−3 μm2 | Pore volume/cm3 | Saturation/ % |
|---|---|---|---|---|
| B | 11.80 | 0.040 | 1.34 | 62 |
| D | 12.92 | 0.012 | 1.47 | 41 |
| E | 10.20 | 0.010 | 1.16 | 26 |
Experiments have proved that tight oil is more prone to be in the pores and throats larger than 100 nm in radius. Chloroform “A” and pore size characterization reveals the relationship between the chloroform “A” content of the tight reservoir of the Qingshankou Formation and the porosity of different pore sizes. The higher the porosity of macropores or mesopores, the higher the asphalt content in the reservoir.
3.3. The anisotropy of reservoir structure reveals that the parallel migration rate is the highest
Tight reservoirs, especially clastic reservoirs, have anisotropic permeability in bedding and massive tight sandstones. For example, the average permeability of the layered argillaceous siltstone in the 7th member of the Yanchang Formation in Well Yan 56 in the Ordos Basin is 300×10−9 μm2 parallel to the bedding and 100×10−9 μm2 perpendicular to the bedding. The average permeability of the blocky fine sandstone is 0.229×10⁻³ μm2 parallel to the bedding, and 0.114×10⁻³ μm2 perpendicular to the bedding. The anisotropy of reservoir structure controls oil migration direction and efficiency. The resistance parallel is significantly smaller than that perpendicular to the bedding, so tight oil first migrates along the bedding. The laminated siltstone cores parallel and perpendicular to the bedding are taken from the same location in the 7th member of the Yanchang Formation (Chang 7 Member for short) in Well Hu 261. The starting pressure gradient of the core parallel to the bedding is 2.16 MPa/cm, and that perpendicular to the bedding is 8.74 MPa/cm. The apparent difference in the pressure gradient determines the significant difference in the migration resistance and rate of tight oil in different directions. In the direction parallel to bedding, the migration resistance is small, and the migration rate is higher (Fig. 9 ).
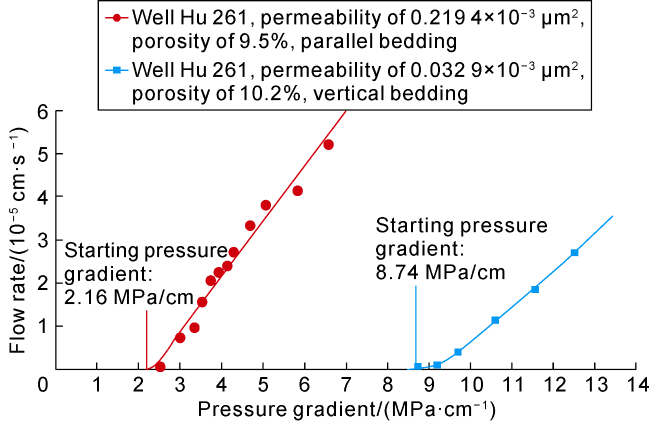
Fig. 9. Relationship between starting pressure gradient and flow rate in laminated fine sandstone samples of the Chang 7 Member, Ordos Basin. |
3.4. Fractures in the layer improve the migration and accumulation efficiency and oil saturation
Fractures in tight oil reservoirs significantly improve the migration and accumulation efficiency and enrichment degree. They can reduce the migration resistance and increase the oil saturation of the tight reservoirs. The correlation between charging pressure and oil saturation in the tight reservoir of the Qingshankou Formation in Songliao Basin indicates the oil saturation of the samples with developed fractures is significantly higher (Fig. 10 ).
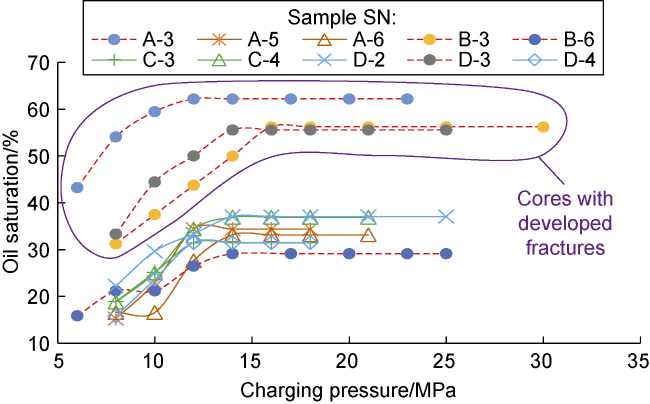
Fig. 10. Relationship between charging pressure and oil saturation of the tight reservoir in the Qingshankou Formation in the Songliao Basin. |
The controlling effect and influence of fractures are shown in two aspects: (1) Fractures are dominant channels and can communicate more matrix pores, improve the overall oil saturation of the reservoir and local enrichment of tight oil in the area with developed fractures. (2) Fractures are advantageous channels for oil flow,improving the oil production rate, and increase producing oil reserves, resulting in high initial and cumulative oil production.
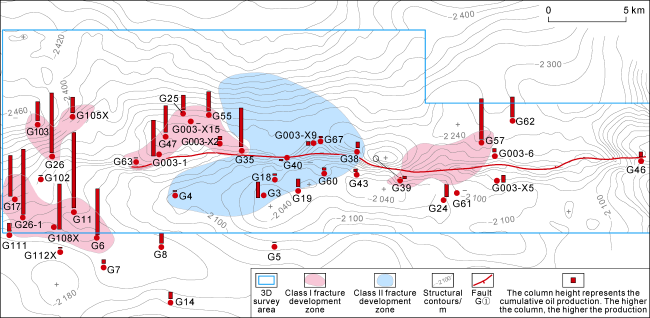
During tight oil development, fractures often lead to high yield [27]. In the previous exploration of the Jurassic in central Sichuan, fractures significantly impacted the productivity of oil wells, and fracture development areas often provided high yield. Production performances show that tight oil reservoirs in the Jurassic in central Sichuan have typical dual-porosity seepage characteristics, and fractures are the controlling factor on high production in the early stage [28]. Based on the previous experience [9], the single-well production in G oilfield was superimposed on the fracture porosity chart (Fig. 11 ), indicating that most of the high-yield wells in this field are located in the zone with higher fracture porosity.
Fig. 11. Relationship between cumulative production and fracture development of single oil wells in G oilfield (according to Ref. [9]). |
4. Conclusions
The mechanisms of tight oil charging, migration and accumulation in continental lake basins have three characteristics: (1) The power of hydrocarbon generation and expulsion from high-quality source rocks is the dynamic foundation that determines the efficiency of charging and accumulation effect of tight oil. (2) The oil migration resistance is the critical factor that influences the efficiency of charging and accumulation of tight oil. (3) The coupling of charging force and pore-throat resistance controls the sweet spot accumulation of tight oil.
The dynamic mechanisms of charging, migration efficiency and accumulation effect of tight oil, that is, oil saturation and enrichment, are controlled by three factors: the coupling of charging power and resistance, effective migration system, and good storage and accumulation space. The charging power is from hydrocarbon generation and expulsion pressurization. The resistance is related to reservoir porosity and permeability which also controls reservoir space, oil accumulation and oil volume.
Tight oil enrichment and saturation in continental lake basins are controlled by source rock, reservoir pore and throat sizes, structural anisotropy and fractures: (1) High quality source rocks control tight oil distribution near source; (2) Reservoir physical properties and pore and throat sizes are in positive correlation with tight oil enrichment degree; (3) Anisotropy of reservoir structure reveals that the parallel migration rate is the highest; (4) Intralayer fractures improve oil migration and accumulation efficiency and the oil saturation.
Acknowledgments
We thank Zheng Min, Wang Xiaoqi, Wu Songtao, Wang Lan, Meng Yuanlin, Liu Hongyuan, Xiao Lihua and other experts for their help during the writing of this paper.