

Introduction
The Fukang fault zone is a foreland thrust belt in the east of the southern margin of the Junggar Basin, NW China [1], where thick high-quality source rock of the Middle Permian Lucaogou Formation are widely developed, with a huge potential for oil and gas resources [2]. Oil and gas exploration started in the Fukang fault zone as early as the 1950s, and several small- and medium-sized oil and gas fields such as Santai and Ganhe have been discovered in its western section. In recent years, comprehensive geological research and oil and gas exploration efforts have been strengthened. Not only a Permian hydrocarbon generation sag (Jinan Sag) was discovered in the footwall of the eastern section of the Fukang fault zone, but also a breakthrough was made in the oil and gas exploration of the Middle Permian Jingjingzigou Formation. In 2021, a wildcat well Satan-1 obtained an oil flow of daily production of 26.3 m3 in production test [3]. Before that, low-yield oil flow or oil and gas shows were found in the Carboniferous, Upper Permian Wutonggou Formation, Triassic and Jurassic, but it's the first time to obtain high-yield oil flow from the Jingjingzigou Formation under the Lucaogou Formation source rock. This indicates that not only hydrocarbons can accumulate under the source rock (referred to as sub-source for short), but also large-scale hydrocarbon accumulation can occur, which is of great significance for exploration.
However, as a new petroliferous zone discovered in recent years, the exploration degree and research level in the Jinan Sag are both low, as most researches focus on its adjacent Fukang Sag and Jimsar Sag [4-5]. Among them, the sub-source Jingjingzigou Formation in the Jimsar Sag develops oil reservoir with “new source rock and old reservoir”. Overpressure from hydrocarbon generation drove hydrocarbons to migrate and accumulate downward along the vertical faults, mainly forming structural-lithological oil reservoirs [5]. In the Bogda piedmont thrust belt, the Lucaogou Formation is dominated by tight oil and shale oil reservoirs which are generally characterized by continuous and extensive distribution [6]. It is worth noting that due to the superimposed transformation of multiple tectonic movements (such as Hercynian, Indosinian, Yanshan and Himalayan) in the Jinan Sag [7], the strata are more broken and the structural deformation is stronger, which makes it more difficult to understand the geological characteristics and hydrocarbon accumulation mechanism of the oil reservoirs in this zone. In addition, the source-reservoir communication mode, hydrocarbon accumulation conditions, and oil reservoir types in different areas of the Jinan Sag are quite different, and the hydrocarbon distribution law is not completely clear. Based on the latest exploration progress and research results of our team, by analysis of the Permian hydrocarbon geological conditions in the Jinan Sag and dissection of typical oil reservoirs, this paper focuses on the characteristics and patterns of sub-source hydrocarbon accumulation of Permian reservoirs, and discusses the significance and enlightenment for exploration, with a view to promoting hydrocarbon exploration in this zone and other zones with similar geological conditions.
1. Overview of geological exploration
The Fukang fault zone in the eastern part of the southern margin of the Junggar Basin is divided into three segments. The arc crest of the northern margin of the Bogda Mountain is the middle segment, and the two wings are western and eastern segments respectively [7]. The Yanshan-Himalayan tectonic activity formed the thrust zone at the hanging wall and the overthrust zone at the foot wall in the north-south direction in the eastern segment of the Fukang fault zone [3]. The Jinan Sag is a small sedimentary sag located in the overthrust zone at the foot wall. It is adjacent to the Guxi bulge in the east, Santai bulge in the west, Jimsar Sag in the north and bounded by Jinan bulge, and the hanging wall of the eastern segment of the Fukang fault zone in the south, with an exploration area of about 600 km2. Compared with the hanging wall of the fault zone, the structure of the Jinan Sag is relatively stable, and the strata are relatively intact. Two groups of faults (NW-SE trending thrust faults and NE-SW strike-slip faults) are mainly developed. The NW-SE trending thrust faults divide the Jinan Sag into a southern overriding nose-uplift belt and a northern low-lying-slope belt. The NW-SW strike-slip faults further divide the northern low-lying-slope belt into multiple fault blocks (Fig. 1a , 1b).
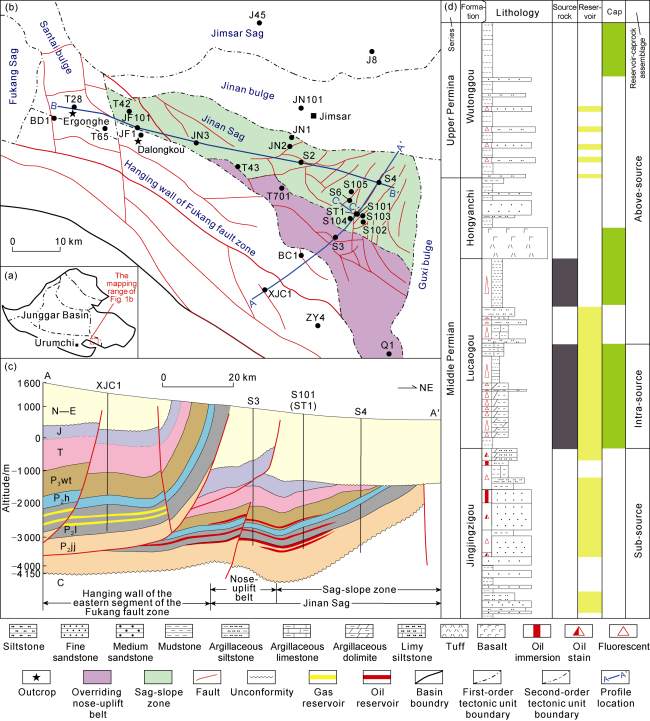
Fig. 1. Tectonic unit division and stratigraphy of the eastern segment of Fukang fault zone. (a) Location of the study area in Junggar Basin; (b) Planar structural map of the study area; (c) SN-trending section of the eastern segment of Fukang fault zone; (d) Composite stratigraphic column of the study area. N—Neogene; E—Paleogene; J—Jurassic; T—Triassic; P3wt— Upper Permian Wutonggou Formation; P2h—Middle Permian Hongyanchi Formation; P2l—Middle Permian Lucaogou Formation; P2jj—Middle Permian Jingjingzigou Formation |
The eastern part of the Junggar Basin (Eastern Junggar for short) was in an extensional tectonic system during the Permian period as a whole, and the tectonic subsidence in the piedmont of the Bogda Mountain was large, and the northward subsidence gradually decreased [8]. During this period, the Jinan Sag was located in the main subsidence area, with a large sedimentary thickness of the Permian system. In this context, except for locally denuded Lower Permian strata, the remaining Permian system was better preserved [9]. During the Indosinian-Yanshanian period, the Eastern Junggar region was in a large depression basin as a whole, and experienced multiple stages of tectonic compression activities, and the Upper Triassic, Upper Jurassic and Upper Cretaceous strata were strongly denuded [2,10] (Fig. 1c ). During the Himalayan period, under a strong SN-trending compressive stress, the Bogda Mountain was strongly uplifted, and the hanging wall of the Fukang fault zone developed thrust nappe structure and a series of south-dipping thrust faults which involved the strongly deformed Mesozoic and Cenozoic strata, while the overthrust zone at the foot wall did not change significantly [11]. Drilling results reveal that the Permian in the Jinan Sag is divided into the Jingjingzigou Formation, Lucaogou Formation, Hongyanchi Formation and Wutonggou Formation from bottom to top. The Jingjingzigou Formation is mainly delta sandstone, which is a good-quality reservoir. The Lucaogou Formation is mainly composed of continuous thick grey-black shale, which acts as a set of high-quality source rocks. Fan delta sandstone reservoir is developed in the lower part of the Wutonggou Formation, and thick mudstone is developed in the upper part of the Wutonggou Formation, which acts as good caprock [3]. The Hongyanchi Formation is locally distributed, with the lower part of basalt interbedded with tuff of variable thickness, and upper part of brown mudstone interbedded with siltstone (Fig. 1d ).
The exploration degree in the eastern segment of the Fukang fault zone is low. In the past, exploration was concentrated around the Santai bulge and the Jinan bulge, but the strata under the Wutonggou Formation were not revealed. In 2017, China Geological Survey drilled Well Xinjican-1 in the hanging wall, and obtained hydrocarbon show from the Lucaogou Formation [12]. In 2021, Tuha Oilfield drilled Well Satan-1 in the Jinan Sag, and obtained high-yield commercial oil flow (at 26.3 m3/d) in the Jingjingzigou Formation, which opened up a new domain of the Permian oil and gas exploration in the Jinan Sag. In the past two years, this zone has been intensively explored, showing a hundred-million-ton exploration scenario, and becomes a key zone for increasing reserves and production.
2. Basic geological conditions of hydrocarbon accumulation
2.1. Source rock
Huge-thick and extensive source rocks of the Lucaogou Formation are developed in the Bogda Mountain and its periphery [2,12]. The thickness of the source rock in the hanging wall of the Fukang fault zone and the Jinan Sag in the piedmont of the Bogda Mountain is significantly greater than that in the Jimsar Sag (Table 1 ). The source rock in the Jinan Sag has TOC of 1.93%-6.80%, hydrocarbon generation potential (sum of S1 and S2) of 37.6-45.7 mg/g, the mass fraction of chloroform bitumen “A” of 0.06%-0.60%, HI of 341-379 mg/g, and dominant organic matter of Type II1. It is comprehensively evaluated as high-quality source rock. The thickness, TOC, hydrocarbon generation potential, and HI of the source rock in the Jinan Sag are relatively high (Table 1 ), and the scale and quality of the source rock are superior to that in the Jimsar Sag, so it is recognized as a high-quality source rock with a great resource potential [13]. Based on the maturity of the source rock, the eastern segment of the Fukang fault zone is divided into three hydrocarbon generation parts, namely, the hanging wall of the fault zone, the south-west of the Jinan Sag, and the north-east of the Jinan Sag. Hereinto, the hanging wall has high mature source rock, while that in the Jinan Sag is generally in a low mature to mature stage. The source rock in the west and south of the sag is relatively deep, and its maturity is higher than that in the east and north. The measured Ro value of the source rock in Well Zhunye-2 in the south of the sag is 0.65%-0.90%, and the Tmax value of dark mudstone in the Ergonghe section is 447-449 °C, which is in the mature stage. However, the Tmax value of the mudstone in Well Satan-1 in the north is 436-445 °C, and the Ro value is 0.60%-0.75% (Table 1 ). The area with the source rock thickness of the Lucaogou Formation in the Jinan Sag more than 200 m reaches 370 km2 [3]. Although the overall maturity is lower than that of the Jimsar Sag, most source rocks have reached the oil generation threshold and has rich resources.
Table 1. Geochemical parameters of the source rock in Permian Lucaogou Formation in southeast margin of Eastern Junggar region |
| Structural Zone | Well/ Outcrop | Depth | TOC/% | S1+S2/ (mg·g−1) | Chloroform bitumen “A”/‰ | HI/ (mg·g−1) | Type | Tmax /°C | Ro/% |
|---|---|---|---|---|---|---|---|---|---|
| Hanging wall of the Fukang fault zone | XJC1 | 410-650* | 1.93* | 28.00* | 0.06* | 463.0* | I, II1 (mainly Type II1) | 460-480 | 1.71 |
| ZY4 | 0.94 | ||||||||
| Dalongkou | 17.83 | 113.50 | 463.0 | 440 | 0.60-0.70 | ||||
| Santai uplift | Ergonghe | 11.17 | 94.50 | 840.0 | 447-449 | ||||
| Jinan Sag | ZY2 | 170-478 | 1.93* | 0.06* | 0.65-0.90* | ||||
| BC1 | 432-452* | ||||||||
| ST1 | 5.20 | 37.60 | 0.60 | 379.0 | II1 | 436-445 | 0.60-0.75 | ||
| S101 | 6.80 | 45.70 | 341.0 | II1 | |||||
| Jimsar Sag | J3301 | 150-330 | 3.82 | 20.00 | 1.15 | 391.0 | II1 | 418-447 | 0.91 |
| J35 | 2.03 | 7.10 | 7.10 | 287.0 | II2 | 428-454 | |||
| J174 | 6.11 | 15.23 | 0.16 | 313.7 | II1 | 436-460 | 0.87 |
Note: *Data sourced from Reference [14]. |
2.2. Reservoirs
Two types of reservoirs are developed in the Jinan Sag. The first type is clastic reservoirs controlled by delta sediments, including reservoirs of the Jingjingzigou Formation and Wutonggou Formation. The second type is shale reservoirs of the Lucaogou Formation. The reservoirs of the Jingjingzigou Formation are mainly feldspathic lithic sandstone and lithic sandstone, with volcanic debris as the dominant lithic composition of (Fig. 2a ). The porosity is 2.7%-15.5%, with an average value of 9.9%. Samples with porosity larger than 8% account for 66.5%. The permeability is (0.01-1.69)×10−3 μm2, and averaged 0.30×10⁻³ μm2. Samples with permeability higher than 1.00×10⁻³ μm2 only account for 7%. The reservoirs are of medium-low porosity and permeability. The reservoir space is mainly secondary dissolution pores which mainly occur in feldspar, lithic and zeolite cements, etc., and a small amount of residual intergranular pores, but the pores are mostly filled with clay minerals such as chlorite (Fig. 2b , 2c). With obvious large pores, the reservoirs are better connected [3]. It is worth noting that effective reservoirs are developed in the Jingjingzigou Formation at a depth of nearly 3500 m. Compaction and cementation worsened the physical properties of the reservoirs, and resulted in point-line contact between particles, so that most primary pores were not preserved (Fig. 2d ). Reservoir pores are mostly filled with ferroan calcite cements which make the reservoir densified. Since the ferroan calcite cements were not corroded, it is concluded that this type of calcite cement occurred relatively late (Fig. 2e ). However, feldspar, zeolite, lithic and other components corroded strongly induced dissolution pores as main reservoir space. In addition, crude oil generally occupies the pores in the reservoirs (Fig. 2f ). Hydrocarbons charging into the pores inhibits secondary overgrowth of quartz [15-16], and it is beneficial for pore preservation. Chlorite film can separate formation water from mineral particles and effectively inhibit the secondary overgrowth of minerals such as quartz and feldspar [17]. As a result, in the zones with high development degree of chlorite film, secondary overgrowth of minerals is not serious in the Permian reservoir in the study area (Fig. 2c ). Moreover, hydrocarbons had entered the reservoir before it densified by late cementation of ferroan calcite, so it is more conducive to the effective accumulation of crude oil.

Fig. 2. Microscopic characteristics of casting thin sections of Permian reservoir in Jinan Sag. (a) Well Sa-101, 3043.6 m, Jingjingzigou Formation, feldspathic lithic sandstone, mainly composed of volcanic debris under plane-polarizerd light (the same below); (b) Well Sa-4, 2399.6 m, Jingjingzigou Formation, secondary dissolution pores of feldspar, lithic and zeolite cements; (c) Well Sa-4, 2399.6 m, Jingjingzigou Formation, dissolution pores are filled with chlorite; (d) Well Sa-104, 3432.7 m, Jingjingzigou Formation, particles are mainly in point-line contact; (e) Well Sa-104, 3435.7 m, Jingjingzigou Formation, pores are filled with ferroan calcite cements; (f) Well Sa-103, 3356.2 m, Jingjingzigou Formation, crude oil disseminates chlorite and lithic dissolution pores; (g) Well Tai-701, 3090.4 m, Wutonggou Formation, dominated by glutenite and medium-fine grained lithic sandstone, with intergranular pores and intragranular dissolution pores; (h) Well Tai-701, 3090.4 m, Wutonggou Formation, structural cracks; (i) Well Sa-3, 3326.3 m, Lucaogou Formation, structural cracks. |
A reservoir interval is 9-36 m thick in the lower member of the Wutonggou Formation in the Jinan Sag, which is mainly composed of glutenite and medium-fine lithic sandstone. The pore space is mainly intergranular pores and intragranular dissolution pores, with uneven pore distribution and poor connectivity (Fig. 2g ). The development of structural fractures can significantly improve the physical properties of the reservoir (Fig. 2h ). The porosity of the reservoir is 4.0% to 22.3% and averaged 15.8% [3]. The permeability is (0.25-17.00)×10−3 μm2 and averaged 3.02×10⁻³ μm2. The reservoir is of medium porosity and low permeability.
The oil reservoir of the Lucaogou Formation of the Jinan Sag is a typical "self-source and self-reservoir" shale oil reservoir. The reservoir rock is mainly laminated limy siltstone and dolomitic siltstone (Fig. 1d ), with porosity of 3%-6%. The physical properties of the reservoir in the zones with well-developed fractures are significantly improved. The zone where Well Sa-3 was drilled is a typical intra-source fractured siltstone reservoir (Fig. 2i ), with average porosity of 13.6% and average oil saturation of 50.2%.
2.3. Caprock
Mudstone of the Lucaogou Formation is widely distributed, with a thickness of 170-478 m, and over 200 m in most zones. The caprock of the Lucaogou Formation is mainly mudstone and silty mudstone, with permeability generally lower than 0.05×10⁻³ μm2. In addition, drilling and well logging results show that overpressure is prevalent in the Lucaogou Formation, and the residual pressure is 5-20 MPa, which can significantly increase the displacement pressure of the caprock and enhance its sealing ability [18]. Lake transgressive mudstone in the upper member of the Wutonggou Formation is also widely distributed, with a total thickness of more than 150 m and permeability of lower than 0.5×10⁻³ μm2. Because of tight lithology, it can act as an effective regional seal. The volcanic rock of the Hongyanchi Formation is mainly distributed in the northeast of the Jinan Sag, and the lower basalt interbedded with the volcanic rock directly overlies the Lucaogou Formation (Fig. 3 ), totally 64-222 m and averaged 134 m. Previous studies show that the volcanic seal has a certain sealing capacity for natural gas reservoirs [19], and its collaborative sealing with the mudstone of the Lucaogou Formation is one of the important factors for the preservation and enrichment of sub-source oil reservoirs in the Satan-1 block.
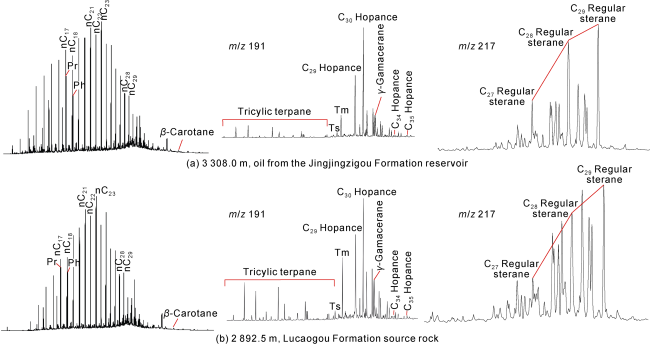
Fig. 3. Chromatograph-mass spectrogram of crude oil in Jingjingzigou Formation and source rock in Lucaogou Formation in Well Satan-1. |
2.4. Source-reservoir-caprock assemblage
According to the spatial configuration of source-reservoir-caprock, the Permian system can be divided into three sets of source-reservoir-caprock assemblages, namely, sub-source, intra-source, and above-source. Good oil and gas shows have been obtained in all the three sets of assemblages (Fig. 1d ). For the above-source assemblage, the reservoir is bedded sand bodies in braided channel facies or fan delta front facies in the Wutonggou Formation, and the caprock is tight mudstone in lacustrine facies and plain facies widely distributed in the upper member of the Wutonggou Formation. For the intra-source assemblage, similar to the Jimusar Sag, it is a typical self-source and self-reservoir shale oil reservoir. For the sub-source assemblage, the main reservoir is the sand bodies in delta front facies of the Jingjingzigou Formation, and the overlying dark mudstone of the Lucaogou Formation is both a good source rock and a high-quality regional seal.
3. Sub-source hydrocarbon accumulation
3.1. Source of oil and gas
There are two different types of source rocks developed in the Upper Paleozoic in the Eastern Junggar region, of which the Carboniferous system was developed in a transitional sedimentary environment [20], and the source rock of the Middle Permian Lucaogou Formation was developed in a continental salified lake basin [12]. According to the measurements, the carbon isotope composition of crude oil in the Jingjingzigou Formation in the Jinan Sag is relatively light, mainly ranging from −32.60‰ to −32.36‰ (Table 2 ). The carbon isotope value of Carboniferous crude oil in the Fukang fault zone and its surrounding areas is generally heavier than −28.10‰ [21], with significant differences between the two. The Pr/Ph value of crude oil in the Jingjingzigou Formation in the Jinan Sag is slightly greater than 1, and the content of β-carotane is lower (Table 2 ), which reflects that the parent material was formed in a weakly oxidized lake basin. The crude oil has high gammacerane content and contains almost no 4-methylsterane (Fig. 4a ), while 4-methylsterane is mainly derived from 4-methylsterols in dinoflagellates that thrive in freshwater, indicating that the parent material for hydrocarbon generation originates from saline water [22]. In addition, C21 and C22 n-alkanes in the crude oil and source rock of the Jingjingzigou Formation in the Jinan Sag have significant advantages over C28 and C29 n-alkanes (Table 2 ), and there is a certain amount of tricyclic terpane (Fig. 4 ). It is concluded that the parent material that generates hydrocarbon is rich in lipids and closely related to algae. The crude oil and source rock have high C30 hopane content and low C34 and C35 hopane contents, and C27-C28-C29 regular sterane exhibit an “ascending” distribution (Fig. 4 ). The biomarkers of the source rock are consistent with those of large lacustrine shale in western China [23]. The above parameters indicate that the Permian crude oil in the Jinan Sag is originated from the salified lacustrine source rock of the Middle Permian Lucaogou Formation.
Table 2. Geochemical parameters of crude oil and source rock in Jinan Sag |
| Well | Formation | Sample | δ13C/ ‰ | Pr/Ph | (C21+C22)/ (C28+C29) |
|---|---|---|---|---|---|
| ST1 | P2jj | Crude oil | −32.36 | 1.26 | 2.55 |
| S101 | P2jj | Oil-soaked fine sandstone | −32.60 | 1.31 | 4.02 |
| ST1 | P2l | Grey-black mudstone | −29.80 | 1.02 | 2.86 |
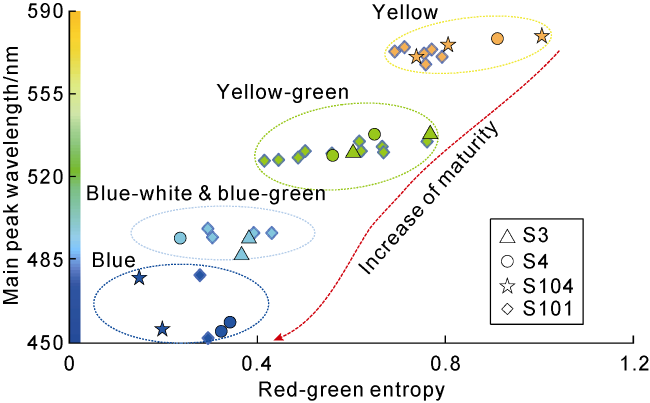
Fig. 4. Relationship between dominant peak wavelength and red-green entropy of Permian oil inclusions in Jinan Sag. |
3.2. Fluid inclusions in reservoirs and hydrocarbon accumulation stages
There are liquid hydrocarbon inclusions, gas-liquid two-phase inclusions, gas inclusions, hydrocarbon-bearing brine inclusions, and brine inclusions in the reservoir of the Jingjingzigou Formation. The abundance of oil inclusions ranges from 0.4% to 8.9%, with an average value of 5.9%. They are mainly distributed sporadically or in groups in quartz diagenetic cracks, quartz particle surfaces, quartz overgrowth edges, and calcite cements, and display blue, blue-green, yellow-green, and yellow under UV fluorescence, with corresponding dominant peak wavelengths of about 452, 493, 535 and 568 nm, respectively (Figs. 4 and 5 ). With the increase of maturity, the fluorescence color of hydrocarbons changes according to the rule of red→orange→yellow→green→blue, which is called a blue shift phenomenon [24]. The capture of oil inclusions with multiple fluorescence colors in the reservoir reveals the charging of crude oil with different maturity values. In addition, there are many gas inclusions in the reservoir, but few methane characteristic peaks in laser Raman spectroscopy test results, indicating that crude oil charging is the major in the the study area.
The microscopic temperature measurement results of brine inclusions associated with oil inclusions show that the capture temperatures of the brine inclusions in the reservoir of the Permian Jingjingzigou Formation can be roughly divided into three intervals, which are 50.1-71.9 °C, 76.0-86.8 °C and 89.9-98.7 °C, respectively, and the corresponding salinity also has significant differences (Table 3 ). The brine inclusions associated with blue-green fluorescent oil inclusions generally have lower homogenization temperatures (50.1-71.9 °C, Fig. 5e ). The brine inclusions associated with yellow and blue fluorescent oil inclusions have homogenization temperatures of 76.0-86.8 °C (Fig. 5f , 5g). The brine inclusions associated with yellow-green fluorescent oil inclusions have the highest homogenization temperature, generally exceeding 90 °C (Fig. 5h ). The paleopressure recovery results of oil inclusions show that the average capture pressure of oil inclusions associated with brine inclusions at temperature ranging from 50.1 °C to 71.9 °C is 12.4 MPa, that at temperature ranging from 76.0 °C to 86.8 °C is 29.2 MPa, and that above 90 °C is 32.6 MPa (Table 3 ). The above results reveal three stages of crude oil charging, but at least four types of crude oil with different maturity values were captured in the reservoir. The interpretation is as follows: during the first stage of charging, the formation temperature was about 50.1-71.9 °C, and the reservoir mainly captured blue-green oil inclusions; during the second stage, the formation temperature was about 76.0-86.8 °C, and the reservoir mainly captured blue and yellow oil inclusions; during the third stage, the formation temperature exceeded 90 °C, and the reservoir mainly captured yellow-green oil inclusions. Combining the homogenization temperature of inclusions and the burial-geothermal history of strata, it is considered that the first stage of oil charging occurred during the Middle and Late Permian, the second stage occurred during the Middle and Late Jurassic periods, and the third stage occurred during the Late Neogene (Fig. 6 ).
Table 3. Capture pressure of oil inclusions and homogenization temperature and salinity of associated brine inclusions in Jingjingzigou Formation, Jinan Sag |
| Well | Inclusion type | Host mineral | Homogenization temperature/°C | Freezing point/°C | Salinity/ % | Capture pressure/MPa | Stage |
|---|---|---|---|---|---|---|---|
| Sa-4, Sa-101, Sa-103, Sa-104 | Brine inclusion associated with oil inclusion | Quartz overgrowth edge and quartz crack | 50.1-71.9 | −4.8 | 7.9 | 12.4 | I |
| −5.0 | 7.6 | ||||||
| Quartz crack and calcite cement | 76.0-86.8 | −8.5 | 12.3 | 29.2 | II | ||
| −6.8 | 10.2 | ||||||
| Quartz crack and calcite cement | 89.9-98.7 | −0.3 | 0.5 | 32.6 | Ⅲ |
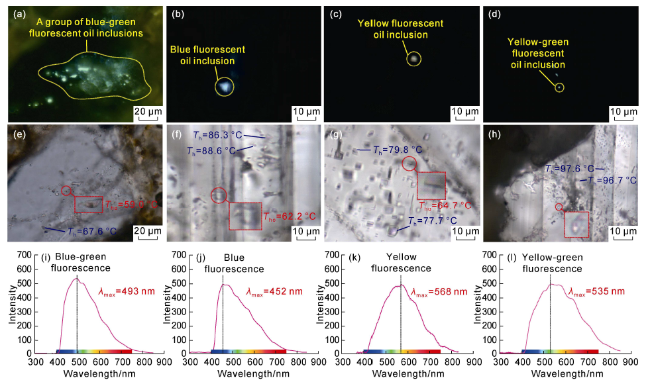
Fig. 5. Microphotos, homogenization temperature and fluorescence spectra of inclusions in Jingjingzigou Formation in Jinan Sag. (a) Well Sa-101, 3255.9 m, showing a group of blue-green oil inclusions under fluorescence; (b) Well Sa-4, 3221.3 m, showing blue oil inclusions under fluorescence; (c) Well Sa-4, 3221.3 m, showing yellow oil inclusions under fluorescence; (d) Well Sa-4, 3221.3 m, showing yellow-green oil inclusions under fluorescence; (e) Well Sa-101, 3255.9 m. The homogenization temperature of oil inclusions is 59.0 °C, and that of brine inclusions is 67.6 °C; (f) Well Sa-4, 3221.3 m, the homogenization temperature of oil inclusions is 62.2 °C, and that of brine inclusions is 86.3 °C and 88.6 °C, respectively; (g) Well Sa-4, 3221.3 m, the homogenization temperature of oil inclusions is 64.1 °C, and that of brine inclusions is 77.7 °C and 79.8 °C, respectively; (h) Well Sa-4, 3221.3 m, the homogenization temperature of brine inclusions is 96.7 °C and 97.6 °C, respectively; (i) Well Sa-101, 3255.9 m, the main peak wavelength of the blue-green fluorescent oil inclusion is 493 nm; (j) Well Sa-4, 3221.3 m, the main peak wavelength of the blue fluorescent oil inclusion is 452 nm; (k) Well Sa-4, 3221.3 m, the main peak wavelength of the yellow fluorescent oil inclusion is 568 nm; (l) Well Sa-4, 3221.3 m, the main peak wavelength of the yellow-green fluorescent oil inclusion is 535 nm. |
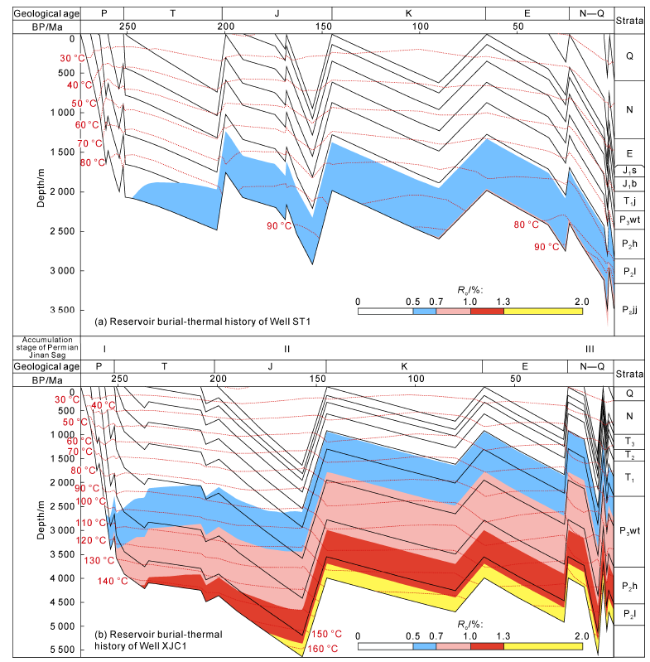
Fig. 6. Reservoir burial-thermal histories and hydrocarbon accumulation stages in Well Satan-1 and Well Xinjican-1. J1s—Lower Jurassic Sangonghe Formation; J1b—Lower Jurassic Badaowan Formation; T3—Upper Triassic; T2—Middle Triassic; T1—Lower Triassic; T1j—Lower Triassic Jiucaiyuan Formation. |
3.3. Hydrocarbon charging, migration and accumulation
3.3.1. Direction of oil migration and accumulation during key hydrocarbon accumulation stages
The crude oil of the key hydrocarbon accumulation stages in the Permian of the Jinan Sag is originated from three source kitchens: the ancient Bogda rift valley (present Bogda Mountain and its periphery, including the hanging wall of the Fukang fault zone), the central-western part of the Jinan Sag, and the northeast part of the Jinan Sag. The primary hydrocarbon supplying periods of the ancient Bogda rift valley were the Middle-Late Permian and Middle-Late Jurassic. During the Middle-Late Permian, the source rock in the Jinan Sag was immature (Fig. 6a ). However, the reservoir of the Jingjingzigou Formation captured blue-green fluorescent oil inclusions with a main peak wavelength of about 490 nm and with associated low-temperature brine inclusions (Fig. 5a , 5e, 5i), revealing that crude oil had charged during that period and had entered mature stage[25]. However, in the Fukang fault zone and its periphery, only the ancient Bogda rift valley was deeply buried and the source rock of the Lucaogou Formation was mature (Fig. 6b ). During the Middle-Late Jurassic, the homogenization temperature of the blue fluorescent oil inclusions (with a main peak wavelength of about 450 nm) captured in the Jingjingzigou Formation reservoir and the associated brine inclusions indicate that the high mature crude oil was charged during the second stage (Fig. 5f ). At that time, the source rock of the ancient Bogda rift valley became highly mature (Fig. 6b ), and may act as a source kitchen. In addition, during the Middle-Late Permian and Middle-Late Jurassic, the ancient Bogda rift valley was located low, while the Jinan region was at high region [3], providing favorable geological conditions for crude oil migration and accumulation.
The hydrocarbon supply period of the source kitchen in the Jinan Sag was the Middle-Late Jurassic and Late Neogene, dominated by the source kitchen in the central and western parts of the Jinan Sag. During Middle-Late Jurassic, the brine inclusions associated with yellow (λmax is about 570 nm) and blue (λmax is about 450 nm) fluorescent oil inclusions in the reservoir of the Jingjingzigou Formation have similar homogenization temperatures (Fig. 5f , 5g), and they were captured simultaneously. During this period, the source rock in the Jinan Sag evolved to a low-mature stage, while the source rock in the ancient Bogda rift valley evolved to a high-mature stage (Fig. 6 ). Based on this, it is inferred that the high-mature crude oil from the Bogda rift valley and the low-mature crude oil from the Jinan region were mixed into the reservoir of the Jingjingzigou Formation in the Jinan Sag.
During the Late Neogene, the uplift of the hanging wall of the fault zone ceased hydrocarbon generation, while the source rock in the Jinan region continued to generate hydrocarbons (Fig. 6 ). During this period, only the source rock in the Jinan region had the conditions to supply hydrocarbons. The sub-source reservoir of the Jinan Sag mainly captured yellow-green fluorescent oil inclusions (λmax is about 530 nm), and the temperature of the associated brine inclusion is 89.9-98.7 °C (Fig. 5d , 5h, 5l), which is the result of stage Ⅲ crude oil charging. However, the maturity of sub-source crude oil in Well Satan-1 does not match the maturity of its overlying source rock. As shown in Table 4 , the Ro of mudstone in the Lucaogou Formation in Well Satan-1 is 0.60%-0.75%, the average Tmax is 436.00 °C, and the maturity index Ts/(Ts+Tm) is 0.07. The Ts/(Ts+Tm) of the sub-source crude oil in the Jingjingzigou Formation in Well Satan-1 is 0.22, and its maturity is higher than that of the hydrocarbon of the overlying Lucaogou Formation. Correspondingly, the maturity of the source rock and crude oil in the central and western parts of the Jinan Sag is relatively high. The average Tmax of the mudstone in the Lucaogou Formation in the Ergonghe region in the western part is 448.00 °C. The measured Ro and Ts/(Ts+Tm) of the source rock in Well Tai-701 in the central part are 0.82% and 0.20, respectively. The Ts/(Ts+Tm) of Permian crude oil in Well Jinan-1 and Well Tai-701 is 0.25 and 0.18, respectively. Therefore, it is inferred that crude oil generated in more mature source kitchens in the central and western parts of the Jinan Sag contributes more to present oil reservoirs.
Table 4. Maturity of source rock in the Lucaogou Formation and Permian crude oil in Jinan region |
| Location | Profile/ Well | Source rock | Ts/(Ts+Tm) of crude oil | ||
|---|---|---|---|---|---|
| Ro/% | Tmax/ °C | Ts/ (Ts+Tm) | |||
| Central and western parts | Ergonghe profile | 447- 449 | |||
| Well JN1 | 0.25 | ||||
| Well T701 | 0.82 | 442 | 0.20 | 0.18 | |
| NE part | Well ST1 | 0.60-0.75 | 436 | 0.07 | 0.22 |
3.3.2. Driving force for oil charging
Early hydrocarbon accumulation under the source rock in the Jinan Sag mainly relied on the long-distance migration and accumulation of mature to high mature crude oil from the ancient Bogda rift valley. The dominant driving force for lateral migration and accumulation of crude oil was buoyancy. At present, in the medium-porosity and low-permeability sub-source reservoir in the Jinan Sag, it is very difficult for buoyancy to be the effective driving force for hydrocarbon migration [26]. In addition, the hydrocarbon migration “from top source to bottom reservoir” requires enough source-reservoir pressure difference as the driving force [27]. According to the maximum possible condition of buoyancy, the maximum height of the oil column was calculated. Based on NMR oil saturation and high-pressure mercury penetration experiment results, the porosity and permeability of the reservoir samples at the depth of 3255.89 m in the upper member of the Jingjingzigou Formation in Satan-1 block are 10.5% and 0.533×10⁻³ μm2 respectively, and the corresponding oil saturation is 64.5%. In combination with the results of high-pressure mercury penetration experiments, it is concluded that under this oil saturation, the capillary radius that needs to break through is 0.017 1 μm (Fig. 7 ).
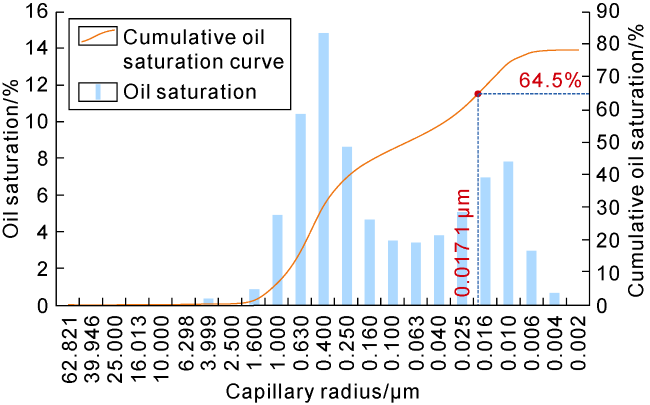
Fig. 7. Relationships between oil saturation and capillary radius of Jingjingzigou reservoir in Jinan Sag. |
As shown in Eq. (1) [28], when the capillary radius is 0.017 1 μm, the corresponding charging pressure of crude oil is 1.4 MPa, and the required oil column height is 827.8 m. However, the maximum oil column height that can be reached in the Jingjingzigou reservoir in Satan-1 block is about 600 m. This indicates that in the case of bearing oil in the entire Jingjingzigou Formation, buoyancy alone is not sufficient to form the condition with the oil saturation at the top of the current reservoir, and there must be other driving forces for hydrocarbon accumulation.
$\rho gh=p=\frac{2\delta \cos \theta }{r}$
The formation pressures in the Lucaogou Formation and Jingjingzigou Formation were calculated using acoustic transit time method. The results show that overpressure commonly exists in the Lucaogou Formation in the study area. The formation pressure is 3-45 MPa, the residual pressure is 5-20 MPa, and the pressure coefficient is 1.10-1.50. The pressure difference between the Lucaogou Formation and the Jingjingzigou Formation is 1-12 MPa. Comprehensive analysis shows that the driving force for early hydrocarbon accumulation in the Jinan region was mainly buoyancy, but at present, it is buoyancy and source-reservoir pressure difference that jointly act as the driving force for oil accumulation.
3.3.3. Pathways for oil migration
Early hydrocarbon accumulation under the source rock in the Jinan Sag mainly depended on long-distance lateral migration of crude oil. The physical properties of sand bodies are better when buried shallow. Crude oil can migrate from high to low potential areas along faults and sand bodies. Current seismic sections show that there are two patterns to connect source rock with reservoir in the Jingjingzigou Formation, namely, “source-reservoir lateral docking” and “top source and bottom reservoir”. Small faults allow the source rock of the Lucaogou Formation to laterally connect with the source rock of the Jingjingzigou Formation, making a hydrocarbon supply window of tens of meters. In addition, it is believed that crude oil can migrate downward through faults driven by a huge source-reservoir pressure difference. Although the source-reservoir pressure difference is another important driving force for hydrocarbon accumulation, considering the difficulty of oil and gas migrating downward under the action of buoyancy [29], this paper concludes that the source-reservoir pressure difference drives the downward migration of crude oil to a limited distance, and more importantly, it allows crude oil to efficiently enter the “source-reservoir lateral docking” window, and then laterally migrate and accumulate in the structure highs of the Jingjingzigou Formation in the Jinan Sag.
Numerous microfractures can be seen under microscope in the reservoir of the Jingjingzigou Formation in the Jinan Sag. A large number of yellow fluorescent oil inclusions can be observed in the fractures through quartz, and represent the charging of low-mature crude oil (Fig. 8a , 8b). Moreover, linear distribution of blue fluorescent oil inclusions can also be observed in cracks crossing quartz, representing the charging of high-mature crude oil (Fig. 8c , 8d). The above phenomena indicate that microfractures are important channels for efficient oil flow in different hydrocarbon accumulation stages, and important channels for continuous hydrocarbon charging during the hydrocarbon accumulation stages.
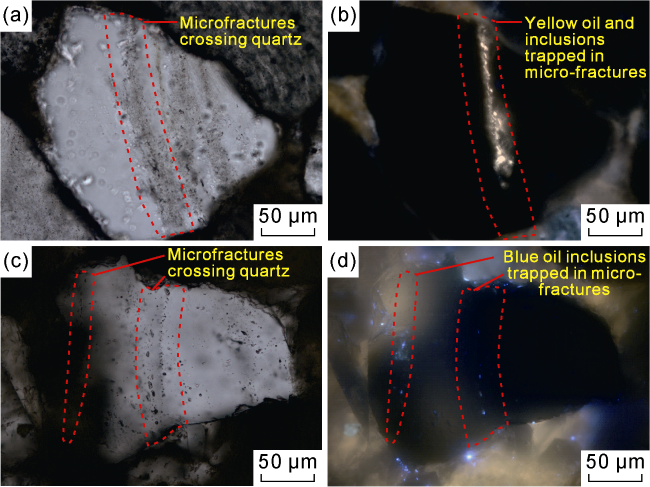
Fig. 8. Microfractures and oil inclusions captured inside of Jingjingzigou Formation reservoir. (a) Well Sa-104, 3437.9 m, cracks crossing quartz can be observed under plane-polarized light; (b) Well Sa-104, 3437.9 m, a large amount of yellow oil inclusions can be observed in cracks crossing quartz under fluorescence; (c) Well Sa-4, 2399.6 m, cracks crossing quartz can be observed under lane-polarized light; (d) Well Sa-4, 2399.6 m, a large amount of blue oil inclusions can be observed in cracks crossing quartz under fluorescence. |
3.4. Evolution and models of hydrocarbon accumulation
3.4.1. Evolution of hydrocarbon accumulation
3.4.1.1. Early hydrocarbon accumulation through long-distance migration
The periphery of the Bogda Mountain was an intracontinental rift during the Middle Permian period. Then in the Late Permian period, as the entire Eastern Junggar region subsided [2], the ancient Bogda rift valley subsided significantly, and the source rock of the Lucaogou Formation subsided rapidly and evolved to a mature stage (Fig. 6b ). In comparison, the subsidence amplitude in the Jinan region was small, and the source rock did not enter the hydrocarbon generation threshold (Fig. 6a ). The mature crude oil from the Bogda rift valley migrated laterally and remotely to the Jinan region, and accumulated into ancient oil reservoirs in the Jingjingzigou Formation (Fig. 9a ). The thick mudstone of the Lucaogou Formation acted as both high-quality hydrocarbon supply layer and good regional seal, preventing upward migration and dissipation of crude oil.
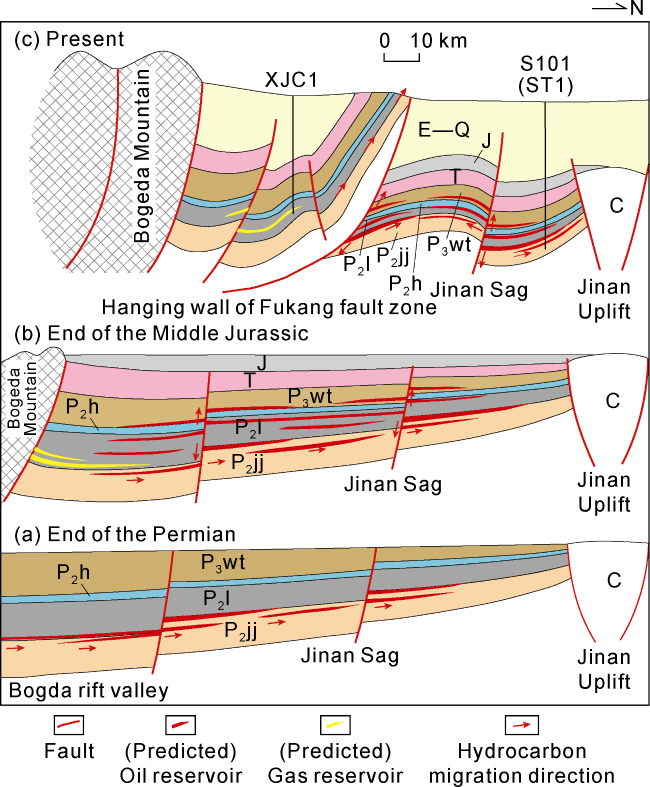
Fig. 9. Schematic diagram of hydrocarbon accumulation and evolution in Jinan sag. |
3.4.1.2. Middle hydrocarbon accumulation by mixing crude oil charging
Under the extensional tectonic background in the Eastern Junggar region during the Early-Middle Jurassic period, the source rocks around the Bogda Mountain (i.e., the hanging wall of the current Fukang fault zone) were deeply buried and evolved to the high-mature stage during this period, while the source rocks in the Jinan region evolved to the low-mature to mature stage (Fig. 6 ). Before the Early Yanshan Movement during the Late Jurassic period, the Bogda Mountain had not yet been significantly uplifted [18], and the hanging wall of the Fukang fault zone was not separated from the Jinan Sag, so high mature crude oil could continue migrating laterally and remotely to the Jinan region. Meanwhile, low to mature crude oil also gradually migrated and accumulated into the Jinan region (Fig. 9b ). As a result, the ancient oil reservoirs of the Jingjingzigou Formation contain both high-mature crude oil (Fig. 5b ) and low-mature crude oil (Fig. 5c ), showing obvious “mixing charging” characteristics. In addition, brine inclusions associated with low- mature oil at homogenization temperature of 74.6-89.6 °C were discovered in the reservoir of the Wutonggou Formation above the source rock, which is the crude oil charged in the second stage. This confirms that the source rock of the Lucaogou Formation in the Jinan region had generated hydrocarbons and migrated upward during that period. However, after intense Yanshan and Himalayan movements, it is inevitable that the ancient oil reservoirs would be transformed, and crude oil could escape or be adjusted to form secondary oil reservoirs.
3.4.1.3. Late hydrocarbon enrichment in structural highs by short-distance charging
The multiple uplifts of the Bogda Mountain during the Yanshanian and Himalayan periods resulted in a significant uplift of the hanging wall of the Fukang fault zone, and consequently stagnant hydrocarbon generation of the source rock (Fig. 6b ). The Jinan Sag is located in the shielding belt of the foot wall of the fault zone (Fig. 1c ), and the source rock was continuously and deeply buried and evolved to a mature stage during the Cenozoic era (Fig. 6a ). The Lucaogou Formation on the hanging wall of the Fukang fault zone was no longer able to supply hydrocarbons during this period. The evidence of fluid inclusions in the Jingjingzigou Formation in the Jinan Sag also indicates that there was no high-mature crude oil charging during the late stage of hydrocarbon accumulation. During the late stage of hydrocarbon accumulation, the crude oil generated by the source rock in the Jinan Sag converged towards the high points in the east and north (Fig. 9c ). Reservoirs developed by late hydrocarbon accumulation were not damaged by intense tectonic activities.
3.4.2. Models of hydrocarbon accumulation
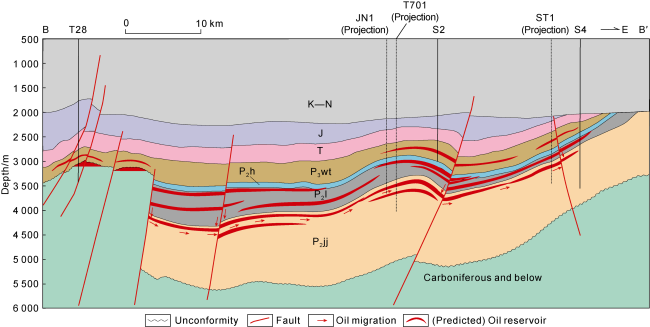
The mature to high-mature crude oil from the Lucaogou Formation originated from the ancient Bogda rift valley and the low-mature crude oil from the Jinan Sag jointly formed the early and middle ancient oil reservoirs in the Jinan Sag. The mature to high-mature crude oil migrating to the Jinan region was mainly driven by buoyancy along transport channels (fault or sand body), while the local low-mature crude oil in the Jinan Sag was mainly driven to migrate downward by overpressure from hydrocarbon generation. The tectonic movements during the Late Yanshanian and Himalayan periods fractured the formations in the Fukang fault zone. Although the Jinan Sag was located in the overthrust zone of the foot wall, strong tectonic movements still caused some adjustment or dissipation of oil reservoirs. As shown in Fig. 10 , the current oil reservoirs were mainly sourced from source kitchens in the central and western parts of the Jinan Sag. Driven by the source-reservoir pressure difference, the crude oil of the Lucaogou Formation could migrate vertically along faults or laterally to the reservoirs of the Jingjingzigou Formation through the source-reservoir lateral docking window. In addition, after crude oil entered the reservoir under the source rock, it gradually migrated through sand bodies or faults by buoyancy and accumulated in the structural highs. Regardless of the nose uplift belt or low-lying-slope belt, locally developed small forward structures are dominant areas for hydrocarbon accumulation. Faults are good pathways for vertical migration of crude oil in the Jinan Sag. Two groups of faults, namely NW-SE thrust faults and NE-SW strike-slip faults, are mainly developed in the Jinan Sag (Fig. 1b ). The thrust fault creates a good source-reservoir lateral connection pathway, and many strike-slip faults well connect source rock and reservoir. At present, the oil reservoirs discovered are mainly concentrated in the parts with NE-SW strike-slip faults in the northern low-lying-slope belts (Fig. 1b ). It is concluded that the faults have improved the physical properties of the reservoir to a certain extent, and made the oil-bearing property of the reservoir better. In addition, the joint sealing of the thick tight mudstone of the Wutonggou Formation and Lucaogou Formation and the volcanic rock of the Hongyanchi Formation has well preserved the reservoirs and formed the enrichment of sub-source reservoirs. In general, sub-source oil reservoirs are mainly lithologic or structural-lithologic, reservoirs in low-lying-slope settings contain oil generally, and faults control the enrichment of crude oil to a certain extent.
Fig. 10. Sub-source hydrocarbon accumulation model in EW direction in Jinan Sag. |
4. Significance for exploration
Under the superimposed transformation of multiple tectonic movements, large-scale thrust structures were developed in the Fukang fault zone. As most strata at the hanging wall of the fault zone were exposed to the surface, the conditions for preserving oil and gas reservoirs became poor. However, located in the overthrust zone at the foot wall of the Fukang fault zone (Fig. 1c ), the Jinan Sag was not damaged, and the original source-reservoir- caprock assemblages were well preserved. It is worth noting that previous studies generally believe that the thrust zone is dominated by structural oil and gas reservoirs. However, the extensive development of lithologic reservoirs under the slope background in the Jinan Sag has proved that it's possible to form large lithologic reservoirs in the thrust belt.
With relatively harsh hydrocarbon accumulation conditions for the “top source and bottom reservoir” play, it is relatively rare among the discovered oil reservoirs in China. The Jingjingzigou Formation in the Eastern Junggar region was not previously regarded as a primary exploration target layer. Since the discovery of an oil field with 100-million-ton reserves in the Jingjingzigou Formation in the Jinan Sag, it's been believed that large oil fields can be formed under the source rock. The key factors for hydrocarbon accumulation and enrichment are as follows: (1) Thick and high-quality source rock of the Lucaogou Formation provides a strong resource base; (2) Locally preserved ancient oil reservoirs formed by early lateral large-scale migration and accumulation are important components of current oil reservoirs; (3) The source-reservoir lateral docking provides an efficient pathway for crude oil migration and accumulation; (4) A sufficiently high source-reservoir pressure difference is an important driving force for downward migration of crude oil; (5) The oil reservoirs were not strongly damaged by faults, and the joint sealing of the overlying Lucaogou Formation mudstone, the Hongyanchi Formation volcanic rock and the upper Wutonggou Formation mudstone creates good preservation conditions.
Although the overall preservation conditions in the thrust belt are poor, the structural deformation on the flanks of the thrust arcs is generally weaker, so the preservation conditions are relatively better. Even if the source rocks in the overthrust belt are buried deep, they are still connected with upper and lower reservoirs by faults. Therefore, it is necessary to strengthen comprehensive research and re-understanding of the foreland thrust belts which are less explored in central and western China. The weakly deformed regions on the flanks of the thrust arcs may be broken through to exploration, and the sub-source oil and gas reservoirs are important targets for future exploration.
5. Conclusions
The extensive, thick and high-quality source rocks of the Lucaogou Formation in salified lake basin facies in Jinan Sag provide a solid resource foundation for large- scale hydrocarbon accumulation. The Jingjingzigou Formation, the Wutonggou Formation and the Lucaogou Formation all develop large-scale reservoirs. Of them, the Jingjingzigou Formation is a primary conventional pay zone. Dissolution, hydrocarbon charging for pore preservation and the presence of chlorite film improve the reservoir performance. The characteristics of crude oil charging before reservoir compaction improve the effectiveness of hydrocarbon accumulation. The thick mudstone of the Jingjingzigou Formation and Wutonggou Formation and the volcanic rock of the Hongyanchi Formation are good regional seals in the northeast of the sag. The source-reservoir-caprock configuration is good, and there are three types of hydrocarbon accumulation assemblages (sub-source, intra-source and above-source).
Buoyancy and source-reservoir pressure difference jointly constitute the driving force for hydrocarbon accumulation in the Jingjingzigou Formation. Faulting causes lateral docking between the source rock and the underlying reservoir of the Jingjingzigou Formation, which enables efficient migration and accumulation of crude oil driven by the source-reservoir pressure difference. Microfractures are pathways for efficient flow and continuous charging of crude oil at different hydrocarbon accumulation stages.
The oil reservoirs in the Jinan Sag have three stages of hydrocarbon accumulation: early hydrocarbon accumulation by long-distance migration, middle hydrocarbon accumulation by mixing crude oil charging, and late hydrocarbon enrichment in structural highs by short-distance charging. The first stage of hydrocarbon accumulation occurred during the Middle-Late Permian period, when the crude oil around the Bogda Mountain migrated and accumulated into the Jinan region through a long distance. The second stage of oil charging occurred during the Middle-Late Jurassic period, when the “mixing charging” of high-mature crude oil around the Bogda Mountain and local low-mature crude oil occurred in the Jinan region. The third stage of oil charging occurred during the Late Neogene period, when the local mature crude oil in the Jinan Sag converged from the west and south to the high points in the east and north. After the second stage of hydrocarbon accumulation, the ancient oil reservoirs were damaged or reformed. The residual high-mature ancient oil reservoirs mixed with the low-mature to mature oil reservoirs developed in the third stage and became the current oil reservoirs, but the main part of the oil reservoirs were originated from the third stage.
The exploration breakthrough in the Jinan Sag demonstrates that thrust belts can not only form structural oil and gas reservoirs, but also form extensive lithologic oil reservoirs. In addition, it indicates that large oil fields can be formed under the source rock. Weakly deformed zones on the flanks of the thrust arcs in central and western China have potentials to make exploration breakthrough, and dub-source oil and gas reservoirs are important exploration targets in the future.
Nomenclature
g—acceleration of gravity, 9.8 m/s2;
h—oil column height, m;
HI—hydrogen index, mg/g;
p—oil charging pressure, MPa;
r—capillary radius, μm;
Ro—vitrinite reflectance, %;
S1—free hydrocarbon content, mg/g;
S2—pyrolytic hydrocarbon content, mg/g;
Tmax—max pyrolysis temperature, °C;
Th—homogenization temperature of brine inclusion, °C;
Tho—homogenization temperature of oil inclusion, °C;
TOC—total organic carbon content, %;
θ—OWC angle, set to 0°;
ρ—formation water density, set to 1.01 g/cm3;
λmax—dominant peak wavelength of fluorescence spectrum of oil inclusion, nm;
δ—oil-water interfacial tension, set to 0.012 N/m at about 3000 m and 95 °C.