

Introduction
Carbonate reservoir is a key field for oil and gas exploration and development [1-2]. The joint development of pores, dissolved vugs, and fractures makes the pore structure complex in carbonate reservoirs. The strong heterogeneity of pore structure controls hydrocarbon accumulation and migration and affects the oil and gas reserves and production. Porosity, permeability, and capillary pressure curve are key parameters to describe the physical properties and pore structure of reservoirs, and directly affect evaluation of reservoir effectiveness [3-4].
Reservoir porosity, permeability, and capillary pressure curve can be obtained through experiments. Nevertheless, there are limited cores collected from local well section, and it is difficult to realize continuous quantitative char-acterization of reservoir physical properties and pore structure [5]. Previously, nuclear magnetic resonance (NMR) logging was applied in continuous and quantitative evaluation of physical properties and pore structure of clastic reservoirs [6⇓⇓-9]. However, there are following overcomings: (1) NMR is not applicable for reservoirs with fracture width larger than 2 mm [10-11]; (2) The shape and amplitude of NMR T2 spectrum are affected by hydrocarbons, thus NMR cannot reflect the physical properties and pore structure of the hydrocarbon-bearing reservoirs [12-13]; (3) The vertical resolution of NMR logging is low (15.24-22.86 cm), thus the strong vertical heterogeneity of the reservoir is hardly evaluated by NMR [14-15]; (4) NMR logging in carbonate reservoirs is affected by "coupling effect", thus the application of NMR T2 spectrum is limited in application [13,16].
Formation micro-resistivity image (FMI) is a logging method that measures the resistivity of borehole wall by current. The FMI instrument has the sampling interval of 0.25 cm (0.1 in) in depth and circumferential direction, with the instrument resolution of 0.5 cm (0.2 in). The FMI log is used to qualitatively identify the geological features (e.g. bedding, fractures, and dissolved pores/vugs) of the strata around the borehole wall. Based on FMI processing technology, parameters such as fracture porosity, opening degree, the linear density of fractures, the plane porosity of dissolved pores/vugs, and other parameters of the reservoirs can be quantified [17⇓-19]. Any one of these parameters is a comprehensive response to reservoir heterogeneity at a specific measuring depth. Newsberry et al. [20] and Akbar et al. [21] calculated the porosity within the measurement range of microelectrodes based on Archie's equation, and displayed the heterogeneity of reservoir porosity in the measured interval by using a two-dimensional porosity spectrum, thus expanding the application of FMI in reservoir evaluation. Based on the distribution of porosity spectrum, the primary and secondary porosities and their distribution in carbonate reservoirs can be characterized [22-23], and the correlation between them and oil and gas production data is reflected [24-25]. Li et al. [26] classified the reservoirs and evaluated the distribution of favorable reservoirs according to the mean and variance of porosity spectrum, together with oil test data, and proposed that this method has advantages in the division of reservoir productivity and delineation of payzone range. However, porosity spectrum can only enable qualitative evaluation of reservoir effectiveness but not quantitative evaluation of the pore structure of reservoir. Capillary pressure curve is the most direct and effective option for quantitative evaluation of pore structure. Xiao et al. [27] correlated the porosity spectrum with the capillary pressure curve for classified reservoirs and then plotted the capillary pressure curve from the FMI porosity spectrum. Xiao et al. proposed that compared with T2 spectrum of NMR logging, FMI is conducive to constructing capillary pressure curve and evaluating reservoir pore structure for three reasons. (1) FMI measures the shallow detection depth, and the FMI porosity spectrum is not affected by fluid properties in the pore. (2) FMI is applicable for reservoirs with fracture width more than 2 mm. (3) the FMI porosity spectrum has a higher vertical resolution than the NMR T2 spectrum, and thus a higher accuracy of pore structure evaluation [27]. Nevertheless, FMI still faces problems as follows. First, it requires a classification of reservoirs based on the actual capillary pressure curve shape, but the classification of highly heterogeneous reservoirs is difficult. Second, the plotted capillary pressure curve is not universal, since it is only applicable to the reservoir types classified by the actual capillary pressure curve. Third, the porosity component calculated by calibrating the conductivity or resistivity measured by microelectrode with Archie's equation is dimensionless, and there is no theoretical basis for converting dimensionless porosity component into pore size component with length dimension, i.e. the porosity component is not equivalent to the pore size component, so it is theoretically impossible to convert porosity into capillary pressure through calibration. The previous studies attempted to establish porosity spectrum and capillary pressure curve to expand the application of FMI in characterization of physical properties and pore structure, but did not propose the approach or idea of using FMI to characterize reservoir permeability and permeability spectrum [28-29].
Analysis of above literatures shows that the application of FMI in quantitative evaluation of reservoir physical properties and pore structure faces the challenges as follows: (1) There is no appropriate method to characterize permeability by FMI; (2) The method of using FMI to construct the capillary pressure curve to evaluate reservoir pore structure proposed by Xiao et al. [27] has limited applicability, and there is no theoretical basis for establishment of the model. This paper aims to establish an equivalent capillary model for FMI based on the capillary pressure theory, propose a method to construct porosity spectrum, permeability spectrum, and capillary pressure curve, and promote the application of FMI logging in characterization of reservoir physical properties and pore structure.
1. FMI-based theoretical models of main reservoir parameters
1.1. Equivalent capillary model of borehole wall rock
The FMI instrument consists of 4 flat plates and 8 polar plates with 192 button electrodes [30]. The borehole wall consists of rock skeleton and pore-throat extending deep. According to the capillary theory, the equivalent capillary model of borehole wall rock detected by electrodes is established (Fig. 1a ). The model has the length Lh and the cross section area A, and N capillary pore-throats with the radius r and the length L.
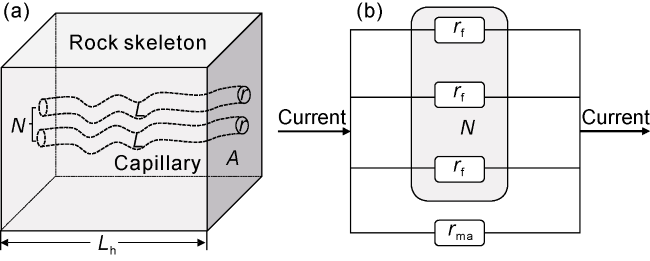
Fig. 1. (a) Equivalent capillary model and (b) equivalent resistivity model of borehole wall rock within the FMI detection range. |
The resistivity measured by the FMI electrode is equivalent to the resistivity of the flush zone [31]. It is assumed that: (1) the rock skeleton does not contain conductive minerals, that is, the rock skeleton does not conduct electricity; (2) the fluid in the rock pores in the flush zone is completely flushed by drilling fluid, and the resistivity of the drilling fluid is Rmf. The skeleton resistivity is set as rma and the capillary resistivity as rf. The rock resistivity within the measurement range of FMI electrodes corresponds to rfs and rma in parallel with total number of N (Fig. 1b ).
1.2. Porosity spectrum model constructed by FMI
The rock resistivity rt within the detection range of FMI electrode is expressed as N capillary resistivities (rf) and skeleton resistivities (rma) in parallel. The rock skeleton does not conduct electricity, and rma is infinite. According to the equivalent capillary model and Ohm's law:
$\frac{1}{\frac{{{L}_{\text{h}}}}{{{C}_{i}}A}}=\frac{N}{\frac{L{{R}_{\text{mf}}}}{\pi r_{i}^{\text{2}}}}=\frac{N}{\frac{{{L}_{\text{h}}}\tau {{R}_{\text{mf}}}}{\pi r_{i}^{\text{2}}}}$
According to Eq. (1), the average pore-throat radius ri measured by FMI electrode i is expressed as:
${{r}_{i}}=\sqrt{\frac{{{C}_{i}}{{R}_{\text{mf}}}\tau A}{\pi N}}$
By setting N0 as the capillary number per unit area within the measurement range of FMI electrode i, i.e. N0=N/A, and substituting N0 into Eq. (2):
${{r}_{i}}=\sqrt{\frac{{{C}_{i}}{{R}_{\text{mf}}}\tau }{\pi {{N}_{0}}}}$
According to the equivalent capillary model, the porosity measured by FMI electrode i is expressed as:
${{\phi }_{i}}=\frac{N\tau {{L}_{\text{h}}}\pi r_{i}^{\text{2}}}{{{L}_{\text{h}}}A}={{N}_{0}}\tau \pi r_{i}^{\text{2}}$
By substituting Eq. (3) into Eq. (4), the porosity equation constructed from the FMI-equivalent capillary model is obtained:
${{\phi }_{i}}={{C}_{i}}{{R}_{\text{mf}}}{{\tau }^{\text{2}}}$
According to Eq. (5), the average porosity is expressed as:
$\overline{\phi }=\frac{\sum\limits_{i=1}^{n}{{{\phi }_{i}}}}{n}={{R}_{\text{mf}}}{{\tau }^{\text{2}}}\frac{\sum\limits_{i=1}^{n}{{{C}_{i}}}}{n}$
1.3. Permeability spectrum model constructed by FMI
According to Poiseuille's law [32], the flow rate of capillary bundle is expressed as:
${{q}_{\text{P}}}=\frac{{{10}^{-9}}N\pi r_{\text{P}}^{\text{4}}\Delta {{p}_{\text{P}}}}{8\mu {{L}_{\text{P}}}}$
${{q}_{\text{D}}}=\frac{{{10}^{-1}}{{K}_{\text{D}}}{{A}_{\text{D}}}\Delta {{p}_{\text{D}}}}{\mu {{L}_{\text{D}}}}$
In the FMI-based equivalent capillary model of borehole wall rock, the flow rate qP of Purcell capillary bundle is equivalent to the flow rate qD of Darcy model, and the pressure differences of ΔpP and ΔpD are also equal. By incorporating Eqs. (7) and (8):
${{K}_{\text{D}}}=\frac{{{10}^{-8}}N{{L}_{\text{D}}}\pi r_{\text{P}}^{\text{4}}}{8{{A}_{\text{D}}}{{L}_{\text{P}}}}$
By unifying the length units of Eqs. (7) and (8) to the FMI-based equivalent capillary model, as shown in Fig. 1 that rp=104ri, AD=108A, LD=104Lh, and LP=104L. By substituting rp, AD, LD, and LP into Eq. (9), and converting the permeability unit to 10−3 μm2, the FMI-based equivalent permeability is obtained:
${{K}_{i}}=\frac{{{10}^{3}}N{{L}_{\text{h}}}\pi r_{i}^{\text{4}}}{8AL}=\frac{{{10}^{3}}N\pi r_{i}^{\text{4}}}{8A\tau }=\frac{{{10}^{3}}{{N}_{0}}\pi r_{i}^{\text{4}}}{8\tau }$
By substituting Eq. (3) into Eq. (10), the FMI-based permeability is obtained:
${{K}_{i}}=\frac{{{10}^{3}}C_{i}^{2}R_{\text{mf}}^{2}\tau }{8\pi {{N}_{0}}}$
Furthermore, the average permeability of rock within the FMI detection range is expressed as:
$\overline{K}=\frac{\sum\limits_{i=1}^{n}{{{K}_{i}}}}{n}=\frac{{{10}^{3}}R_{\text{mf}}^{2}\tau }{8\pi {{N}_{0}}}\frac{\sum\limits_{i=1}^{n}{C_{i}^{2}}}{n}$
Eqs. (11) and (12) are the representations of FMI-based permeability spectrum and average permeability established from the equivalent capillary model.
1.4. Equivalent capillary pressure curve constructed by FMI
According to the relationship between capillary pressure and pore-throat radius, we have:
${{p}_{\text{c}}}=\frac{2\sigma \cos \varphi }{r}$
By substituting Eq. (3) into Eq. (13), the FMI-based equivalent capillary pressure is obtained:
${{p}_{\text{c}i}}=\frac{2\sigma \cos \varphi }{\sqrt{\frac{{{C}_{i}}{{R}_{\text{mf}}}\tau }{\pi {{N}_{0}}}}}$
2. Key parameters and general expressions of the model
2.1. Key parameters
According to Eqs. (5), (11), and (14), ϕi, Ki, and pci are related to Ci, Rmf, σ, φ, τ, and N0. Ci is the conductivity measured by FMI electrode i. σ and φ are related to the fluid in the pore-throat. In the capillary pressure test, the injected fluid is mercury, σ is 480 N/m, φ is 140°, and 2σcosφ is 0.735. Rmf is the resistivity of drilling fluid. τ is obtained by a complex ion migration experiment. Among these parameters, Rmf, τ and N0 are difficult to obtain. Therefore, based on Archie's equation, the calculation methods of Rmf, τ and N0 are further discussed.
2.1.1. Drilling fluid resistivity
Based on Archie's equation of the flushing zone, the drilling fluid resistivity (Rmf) is expressed as:
${{R}_{\text{mf}}}={{\phi }^{m}}{{R}_{\text{XO}}}$
where ϕ is the porosity calculated by conventional logging, Rxo is the resistivity of the flush zone obtained by conventional logging, and m is the pore structure index (also the cementation factor), which can be obtained by rock-electricity experiments. In fractured-vuggy reservoirs, a complete core is difficult to obtain for purpose of rock-electricity experiments. Therefore, m is calculated by using the triple-porosity model of fractured-vuggy reservoirs based on Maxwell-Garnett theory [35-36].
2.1.2. Tortuosity
The tortuosity is expressed as τ=L/Lh. The rock skeleton is not electro-conductive, hence the rock resistivity is equal to the fluid resistivity in the pore-throat. From Eq. (3):
$\frac{\frac{1}{{{C}_{i}}}}{{{R}_{\text{mf}}}}=\frac{\tau }{\pi r_{i}^{\text{2}}{{N}_{0}}}$
Substituting the Eq. (4) into Eq. (16), then:
$\frac{\frac{1}{{{C}_{i}}}}{{{R}_{\text{mf}}}}=\frac{\tau }{\pi r_{i}^{\text{2}}{{N}_{0}}}=\frac{{{\tau }^{\text{2}}}}{{{\phi }_{i}}}$
The Archie's equation of the flush zone is introduced into Eq. (17), then:
$\tau \text{=}\phi _{i}^{\frac{1-m}{2}}$
The above equation is the expression of tortuosity based on the Archie equation.
2.1.3. Capillary number per unit area
N0 can be obtained based on the equivalent capillary model. According to Eq. (4), we have:
$r_{i}^{\text{2}}=\frac{{{\phi }_{i}}}{{{N}_{0}}\tau \pi }$
By substituting Eq. (19) into the permeability expression Eq. (10):
${{K}_{i}}=\frac{{{10}^{3}}{{N}_{0}}\pi r_{i}^{\text{4}}}{8\tau }=\frac{{{10}^{3}}{{N}_{0}}\pi \phi _{i}^{\text{2}}}{8N_{0}^{\text{2}}{{\tau }^{\text{3}}}{{\pi }^{\text{2}}}}=\frac{{{10}^{3}}\phi _{i}^{\text{2}}}{8{{N}_{0}}\pi {{\tau }^{\text{3}}}}$
According to Eq. (20), N0 is expressed as:
${{N}_{0}}=\frac{{{10}^{3}}\phi _{i}^{\text{2}}}{8\pi {{\tau }^{\text{3}}}{{K}_{i}}}$
Eq. (21) is the expression of N0, where τ is obtained by Eq. (18).
2.2. General models of ϕi, Ki and pci
By substituting Eq. (18) into Eq. (5), we have:
${{\phi }_{i}}={{({{C}_{i}}{{R}_{\text{mf}}})}^{\frac{1}{m}}}$
Further, by substituting Rmf into the above equation, i.e., substituting Eq. (15) into Eq. (22):
${{\phi }_{i}}=\phi {{({{R}_{\text{XO}}}{{C}_{i}})}^{\frac{1}{m}}}$
By combining Eqs. (5), (11), and (14), the theoretical models of ϕi, Ki, and pci can be obtained as follows:
$\left\{ \begin{align} & {{\phi }_{i}}={{C}_{i}}{{R}_{\text{mf}}}{{\tau }^{\text{2}}} \\ & \\ & {{K}_{i}}=\frac{{{10}^{3}}C_{i}^{2}R_{\text{mf}}^{2}\tau }{8\pi {{N}_{0}}} \\ & {{p}_{\text{c}i}}=\frac{2\sigma \cos \varphi }{\sqrt{\frac{{{C}_{i}}{{R}_{\text{mf}}}\tau }{\pi {{N}_{0}}}}} \\\end{align} \right.$
By substituting ϕi=CiRmf τ2 and τ into Ki and ϕi, τ, N0 into pci, and incorporating Eq. (23), we can obtain the general models of ϕi, Ki, and pci constructed by Archie's equation:
$\left\{ \begin{array}{*{35}{l}} {{\phi }_{i}}=\phi {{({{R}_{\text{XO}}}{{C}_{i}})}^{\frac{1}{m}}} \\ {{K}_{i}}=\frac{\phi _{i}^{\frac{\text{3}m\text{+1}}{\text{2}}}}{8\times {{10}^{-3}}\pi {{N}_{0}}} \\ {{p}_{\text{c}i}}=\frac{0.735}{\sqrt{8\times {{10}^{-3}}\phi _{i}^{-m}{{K}_{i}}}} \\\end{array} \right.$
Eq. (24) shows that the values of ϕi, Ki, and pci are calculated theoretically based on Rmf, N0, and τ. In practice, N0 and τ are difficult to be obtained by experiments. Eq. (25) further provides the general expression. Based on the general expression, ϕi can be obtained by calibrating ϕ and Rxo. On this basis, N0 is obtained by calibrating the core permeability to determine Ki, and then pci is obtained. It should be noted that N0 and τ are uni-polar plate parameters, and are difficult to obtain by experiments. In practical applications, N0 and τ can be approximated by the mean values obtained by core calibration and Archie's equation respectively.
3. Discussion
3.1. Comparison with the previous models
3.1.1. The porosity spectrum model
${{\phi }_{i}}={{\left( {{\phi }^{m}}\frac{{{R}_{\text{XO}}}}{{{R}_{i}}} \right)}^{\frac{1}{m}}}=\phi {{\left( {{R}_{\text{XO}}}{{C}_{i}} \right)}^{\frac{1}{m}}}$
Comparison shows that the general model Eq. (25) obtained from the theoretical model of porosity spectrum introducing Archie's equation is consistent with Eq. (26). Yong and Hong [38] proposed that Archie's equation [39] can be derived from the capillary physical model of rock and expressed as Ro/Rw=τ2/ϕ, which is a function of tortuosity and porosity [40]. The previous porosity spectrum, in a physical sense, can characterize the pore structure, which is the same as the theoretical model of porosity spectrum in Eq. (24).
3.1.2. The permeability spectrum model
Based on Poiseuille's law and Darcy's law, Purcell [41] obtained the classic capillary permeability model, which has been widely applied in calculation of the permeability of complex reservoirs:
${{K}_{\text{p}}}=\frac{{{\left( {{\sigma }_{\text{p}}}\cos \varphi \right)}^{2}}}{2}F\phi \int_{\text{0}}^{\text{1}}{\frac{\operatorname{d}s}{p_{\text{cp}}^{2}}}$
In the process of model derivation, Purcell ignored that the radius unit of capillary pressure was not consistent with the unit of Darcy's permeability, resulting in an error in permeability expression. Now, the reasons are analyzed in detail. The units of σp and pcp are expressed as: 1 dynes/cm=10−9 N/μm, and 0.1 MPa =10−7 N/μm2, which are substituted into Eq. (27). Then, the correct unit of Kp is obtained as follows:
${{\left( \frac{{{10}^{-9}}\text{N/}\mu \text{m}}{{{10}^{-7}}\text{N/}\mu {{\text{m}}^{\text{2}}}} \right)}^{2}}={{10}^{-1}}\times {{10}^{-3}}\mu {{\text{m}}^{\text{2}}}$
According to Eq. (28), the correct expression of Purcell permeability is:
${{K}_{\text{p}}}=\frac{0.1{{\left( {{\sigma }_{\text{p}}}\cos \varphi \right)}^{2}}}{2}F\phi \int_{\text{0}}^{\text{1}}{\frac{\operatorname{d}s}{p_{\text{cp}}^{2}}}$
Comparison of Eq. (27) with Eq. (24) shows that the physical significance and influencing factors for the lithology coefficient F given by Purcell are not clear [42-43]. According to Eq. (24), the permeability K is affected by N0 and τ, where N0=ϕ/(τπr2), in other words, K is essentially affected by tortuosity τ, pore-throat radius r, and pore structure index m. This understanding is consistent with the study result of lithology coefficient F from Yuan [43], and N0 can be calculated by porosity, permeability and m from rock-electricity experiments.
3.1.3. The capillary pressure curve model
Based on Eq. (26) and the core capillary pressure experiment, and considering the porosity component of the porosity spectrum as the pore size component, Xiao et al. obtained the classification of mercury injection curves in the study area through core capillary pressure experiment. Then, they calibrated the FMI porosity spectrum, obtained the fitting coefficients c and d under the corresponding class of mercury injection curve, and constructed the capillary pressure curve [27], which is expressed as:
${{p}_{\text{cx}}}=c{{\left( \frac{1}{{{\phi }_{\text{x}}}} \right)}^{d}}$
The capillary pressure curve established by Xiao et al. is essentially an empirical model calibrated by core data. It is deficient in three aspects. First, this method requires reservoir classification based on the actual capillary pressure curve and the porosity spectrum morphology, before empirical values of c and d are determined. However, it is difficult to classify the reservoirs with strong heterogeneity. Therefore, this method is not universal. Second, the porosity is not the pore size, so the porosity component of the porosity spectrum cannot reflect the pore size component of the capillary pressure curve. Third, there is no theoretical basis for conversion of the dimensionless porosity component into the pore size component with the length dimension. In summary, the model established by Xiao et al. is an empirical model obtained by classifying and comparing capillary pressure curve and porosity spectrum is lack of theoretical basis. Moreover, application of the model is limited by the accuracy of reservoir and porosity spectrum classification.
3.2. Porosity spectrum, permeability spectrum, and equivalent capillary pressure curves of various reservoirs
According to Eq. (25), ϕi, Ki, and pci of each FMI electrode can be calculated to obtain corresponding porosity spectrum, permeability spectrum and equivalent capillary pressure curve. In the porosity spectrum and permeability spectrum, x-axis represents the porosity and permeability value, y-axis represents the corresponding frequency of porosity and permeability, and the porosity and permeability spectrum morphology reflects the distribution of different porosity and permeability values of reservoirs. In the equivalent capillary pressure curve, x-axis represents the cumulative mercury saturation of the capillary pressure curve, and y-axis represents the capillary pressure on a logarithmic scale. According to the response characteristics of porosity spectrum, permeability spectrum, and equivalent capillary pressure curve, reservoir types are classified.
3.2.1. Fractured reservoir
In Fig. 2 , FMI logging shows fracture characteristics with low resistivity. The porosity spectrum shows uni-modal distribution, dominance of low porosity, and coincidence of the average porosity curve with the peak value of the porosity spectrum. The permeability spectrum shows uni-modal distribution, dominance of high permeability, and coincidence of the average permeability curve with the peak value of the permeability spectrum. The equivalent capillary pressure curve shows low pressure value (curve color from blue to red, corresponding to pressure value from low to high), low displacement pressure, medium-coarse skewness, and low and long gentle section.

Fig. 2. Response characteristics of fractured reservoir. |
3.2.2. Vuggy reservoir
In Fig. 3 , FMI logging shows vug characteristics with low resistivity. The porosity spectrum shows wide and bimodal to multi-modal distribution, and non-coincidence of the average porosity curve with the peak value of the porosity spectrum. The permeability spectrum shows wide and bimodal to multi-modal distribution, and non-coincidence of the average permeability curve with the peak value of the permeability spectrum. The equivalent capillary pressure curve shows low value, low displacement pressure, coarse skewness, and low and long gentle section.
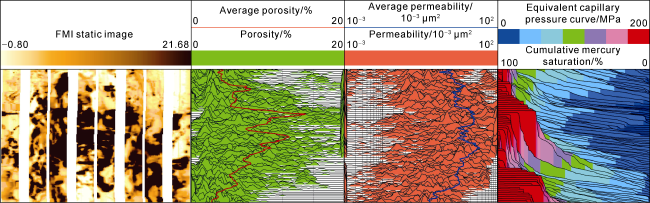
Fig. 3. Response characteristics of vuggy reservoir. |
3.2.3. Matrix porous reservoir
In Fig. 4 , fractures and vugs are not developed in the matrix porous reservoir, and the FMI logging shows bright color and high resistivity characteristics. The porosity spectrum and average porosity show low or no value. The permeability spectrum shows narrow distribution, dominance of low permeability, and low average permeability. The equivalent capillary pressure curve shows a high value, high displacement pressure, fine skewness, and a long gentle section.

Fig. 4. Response characteristics of matrix porous reservoir. |
4. Application
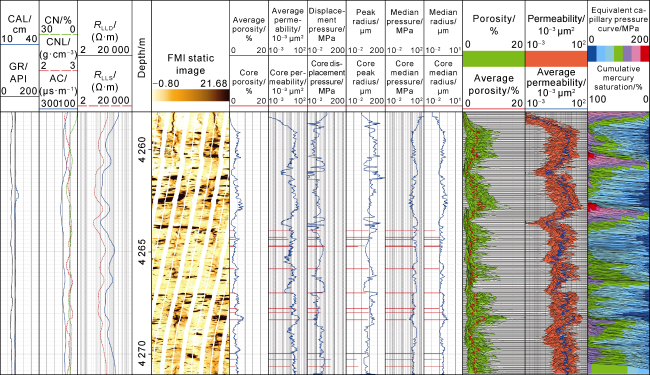
The application effects of porosity spectrum, permeability spectrum, and equivalent capillary pressure curve were analyzed with Well TSX located in the southeast region of the Central Sichuan paleo-uplift in the Sichuan Basin as an example. Well TSX is produced from the second member of the Permian Maokou Formation, which was deposited in carbonate ramp and is dominated by limestone and dolomitic limestone. First, the porosity spectrum, permeability spectrum, and equivalent capillary pressure curve at the depth of 4259-4271 m were calculated. On this basis, the average porosity and average permeability were calculated, the displacement pressure, median pressure, and pore-throat peak/median radius of the equivalent capillary pressure curve were extracted (Fig. 5 ), and then compared with the data obtained from core experiment to evaluate the application effects. In Fig. 5 , the FMI static images at the depth of 4259-4264 m and 4267-4271 m show that vugs are highly developed. The porosity spectrum reflects a wide range, dominance of low and uni-modal porosity, bimodal and trimodal distribution due to dissolved cavity development, non-coincidence of the average porosity with the spectrum peak, and tendency to large porosity. The permeability spectrum shows a wide range, bimodal and trimodal distribution, and non-coincidence of the average permeability with the spectrum peak. The equivalent capillary pressure curve has a shape related to vugs development, more developed vugs cause a lower displacement pressure and a lower gentle section. The FMI static image at the depth of 4265-4267 m shows poor pore development and tight lithology. The porosity spectrum and permeability spectrum shift leftward, with uni-modal distribution, and tendency of coincidence of average porosity with spectrum peak and also of average permeability with spectrum peak. Moreover, both spectra reveal a lower displacement pressure and a higher gentle section. On the whole, the porosity spectrum, permeability spectrum, and equivalent capillary pressure curve show a high development of vugs at multiple scales, with good permeability and low displacement pressure. The interval produces gas of 205.2×10⁴ m3/d. The interpreted results agree well with the actual production data. In addition, comparison of core data and production data shows that the porosity spectrum, permeability spectrum, and equivalent capillary pressure curve in this paper are in good coincidence with the core data.
Fig. 5. Application in Well TSX in the southeast part of Central Sichuan paleo-uplift in Sichuan Basin. |
5. Conclusions
Based on the FMI equivalent capillary model, the porosity spectrum, permeability spectrum, and equivalent capillary pressure curve models were established. Moreover, the corresponding general models were obtained by combining with the Archie equation, and the application effects were evaluated. Understandings were obtained as follows. First, both porosity spectrum and permeability spectrum are affected by tortuosity, and the permeability is also affected by the capillary number per unit area. The equivalent capillary pressure curve can be characterized by porosity spectrum and permeability spectrum. Second, the porosity spectrum can be characterized by ϕ and m in conventional logging, and the permeability spectrum is characterized by porosity spectrum, m, and N0. Once the porosity spectrum and permeability spectrum are known, the equivalent capillary pressure curve can be obtained. Third, the theoretical model provides the physical significance of the model, and the general model expands applicability of the model. Based on the porosity spectrum, permeability spectrum, and equivalent capillary pressure curve, the reservoir types can be classified, and the porosity, permeability, and pore structure parameters can be obtained for the accurate evaluation of reservoir heterogeneity. It should be noticed that the porosity spectrum, permeability spectrum, and equivalent capillary pressure curve models proposed in this study are based on the assumption of non-conducting reservoir skeleton, thus the application to electro-conductive argillaceous clastic rocks and shale needs to be further studied.
Acknowledgement
We appreciate Dr. Zhuang Wen and Master Luo Yang from Chengdu University of Technology and Master Zhang Hao from PetroChina RIPED for their assistance to this work.
Nomenclature
A—cross section area of the equivalent capillary model of borehole wall rock, μm2;
AD—cross section in the Darcy model, cm2;
c, d—core calibration parameters constructed by Xiao et al., which are varying depending upon mercury injection curve, dimensionless;
Ci—electrical conductivity measured by FMI electrode i, S/m;
F—lithology coefficient, dimensionless;
KD—Darcy permeability, μm2;
Ki—permeability constructed by FMI, 10−3 μm2;
Kp—permeability of Purcell's equation, 10−3 μm2;
$\bar{K}$—average permeability calculated by permeability spectrum, 10−3 μm2;
L—capillary length of the equivalent capillary model of borehole wall rock, μm;
LD—length in the Darcy model, cm;
Lh—side length of the equivalent capillary model of borehole wall rock, μm;
LP—capillary length in Poiseuille's law, cm;
m—cementation index, dimensionless;
N0—capillary number per unit area within the measurement range of FMI electrode i, capillaries/μm2;
N—capillary number;
pc—capillary pressure, MPa;
pci—equivalent capillary pressure constructed by FMI, MPa;
ppc—atmospheric pressure in Purcell's equation, 10−1 MPa (10 N/cm2);
pcx—capillary pressure constructed by Xiao et al., MPa;
qD—flow rate in the Darcy model, cm3/s;
qP—capillary bundle flow rate in Poiseuille's law, cm3/s;
r—capillary pore-throat radius, μm;
rf—single capillary resistance, Ω;
ri—average pore-throat radius within the measurement range of FMI electrode i, μm;
rma—skeleton resistivity, Ω;
rP—capillary pore-throat radius in Poiseuille's law, cm;
rt—total resistance of rock within the detection range of FMI electrodes, Ω;
Ri—resistivity measured by FMI electrode i, Ω∙m;
Rmf—drilling fluid resistivity, Ω∙m;
Rxo—flush zone resistivity derived from conventional logging, Ω∙m;
s—capillary saturation, f;
μ—fluid viscosity, mPa∙s;
σ—fluid interfacial tension, N/m;
σp—fluid interfacial tension of pore-throat in Purcell's equation, 10−5 N/cm;
τ—tortuosity of pore-throat within the measurement range of FMI electrode i, dimensionless;
φ—wetting contact angle, (°);
ϕ—porosity derived from conventional logging, %;
ϕi—porosity constructed by FMI, %;
ϕx—FMI porosity calibrated by the core capillary pressure test constructed by Xiao et al., %;
$\bar{\phi }$—average porosity calculated by porosity spectrum, f;
ΔpD—pressure difference at two ends of the Darcy model, MPa;
ΔpP—pressure difference at two ends of the Purcell capillary bundle, MPa.
Subscripts:
i, n—the ith electrode and the total number of electrodes in FMI.