

Introduction
In recent years, application of volumetric fracturing stimulation technology is increasing with development of unconventional oil and gas reservoirs, such as shale gas and tight oil reservoirs [1-2]. In conducting hydraulic fracturing under the high geo-stress, a large number of narrow fractures with staggered distribution and rough surface are generated [3⇓⇓-6]. Proppant migration, settlement and placement within the narrow fractures play a crucial role in activation of natural fractures and formation of complex fracture networks and affect the generation of ineffective fracture. It is necessary to carry out research on proppant migration and settlement within the complex rough fractures.
A large number of experimental and numerical simulations on proppant flow and migration within hydraulic fractures have been conducted [7⇓⇓-10]. Nevertheless, most experiments were operated on a visualized smooth flat fracture model, and the results cannot reflect the proppant migration features within real rough fractures. Some experiments were operated in the rough fracture model. Raimbay et al. [3] carried out experiments of proppant transport in horizontal rough fracture models made by splitting and cutting rock samples. The results showed that the fracture wall roughness has a controlling effect on flow and transport of sand-carrying fluid within the fractures; the proppant migration and distribution is depended on the transport capacity of fracturing fluid and the fracture wall roughness; and proppants are more likely to form non-uniform distribution within rough fractures. Huang et al. [4⇓-6] carried out quantitative and visualized experiments on proppant migration in vertical rough fracture model built with Raimbay's model. The result showed that the fractures generated in different types of rocks have different fracture wall properties, leading to difference in proppant migration, settlement and fracture filling. In terms of numerical simulation, Xu et al. [11] studied proppant distribution in two-dimensional tortuous micro-fractures based on COMSOL Multiphysics; Zhang et al. [12] established a 3D numerical rough fracture model (3.90 cm × 2.19 cm) according to the CT image of fracture wall obtained by scanning sandstone samples, and simulated migration of sparse proppant flow within the fracture using the coupled CFD-DEM method. The results showed that high-viscosity fracturing fluid prevents particle aggregation within the fracture and carries proppants to the far end of the fracture.
Due to limitation of rock splitting and cutting process, the physical simulation experiment to build fracture model is complicated and the simulation case is simple. Meanwhile, there is a certain difference between the fracture in numerical simulation and the real fracture morphology. The results of these two simulating methods both have certain limitations. To solve above problems, a geometric numerical model was established based on fractal interpolation theory to generate the irregular real complex fracture model with rough surfaces. Considering particle-fluid, particle-particle and particle-wall interactions, a proppant-fracturing fluid solid-fluid two-way coupling flow calculation model was established, and verified by experimental data. Finally, proppant transport within the fracture with different roughness was simulated to analyze the effect of fracture wall roughness on proppant aggregation and reveal the microscopic mechanism of proppant transport and settlement within rough fractures. This provides reference for optimization of proppant transport parameters within the rough fractures.
1. Rough fracture generation method based on the fractal theory
Hydraulic fractures have rough and complex surfaces which is the main reason for actual proppant placement different from that in an ideal smooth flat model. Studies have proved that the geometric elements of the fracture surface in rock show fractal characteristics [13⇓⇓-16] which can be characterized by fractal theory [14]. The improved self-affine fractal interpolation method proposed by Sun[14] can generate a relatively accurate fracture rough wall. Based on the reported rock surface data [14], a single face rough fracture wall of 200 mm × 200 mm was established, and the fracture structural surface was re-established with the local neighborhood grid of 1 to obtain the rough fracture structural surface (Fig. 1a ). By refining the local interpolation neighborhood grid, the fractal interpolated fracture structural surface was obtained (Fig. 1b ). To simulate the real fracture, the fractal rough fracture structural surface was established based on the data of the rough fracture physical model in Huang's proppant migration experiments [4⇓-6], as shown in Fig. 1c and Fig. 1d .

Fig. 1. Distribution of structural surface of different rough fractures. |
The generated rough fracture structural surface is taken as the base surface, upper and lower surfaces of joints are coupled to generate geometric numerical fractures. Considering mesh division and computational convergence, the upper and lower rough surfaces of the rough fracture model are not contacted, and the fracture width is constant on the whole fracture surface (Fig. 2 ). The fracture model is generated as follows. Import the data matrix of the rough fracture structural surface obtained by interpolation into the modeling program. Determine the vertical coordinates of each point of the fracture surface by taking the bottom surface of the rough fracture structural surface as the base. Estimate the coordinates of the other side of the fracture according to the given fracture width. The points, lines, surfaces, and the body of the fracture model are generated successively, and all the boundaries are merged through calculation. A flow channel with uniform fracture width between upper and lower fracture structural surfaces is formed, with upper and lower rough fracture structural surfaces superimposed. Finally, a joint-coupled rough fracture model is generated (Fig. 3 ).
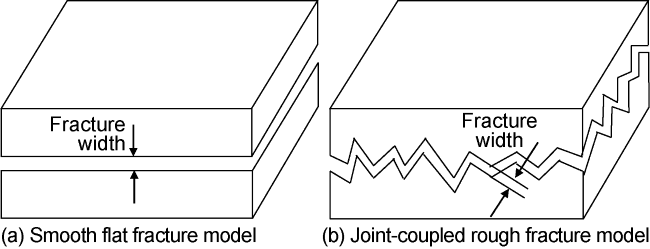
Fig. 2. Schematic of smooth flat fracture model and joint- coupled rough fracture model. |
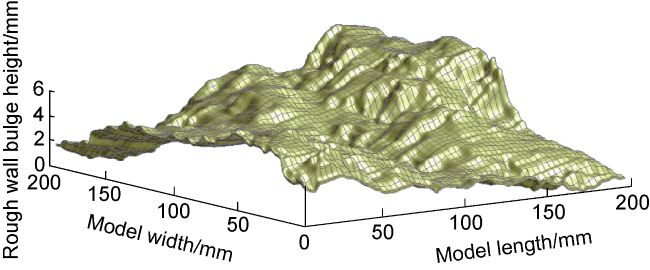
Fig. 3. Rough fracture model generated by 3# rough structural surface (fracture width of 1 mm). |
Using the above method, a rough fracture model with a size of 200 mm × 200 mm × 1 mm is generated by taking four rough fracture structural surfaces in Fig. 1 as the base surfaces (Fig. 4 ).
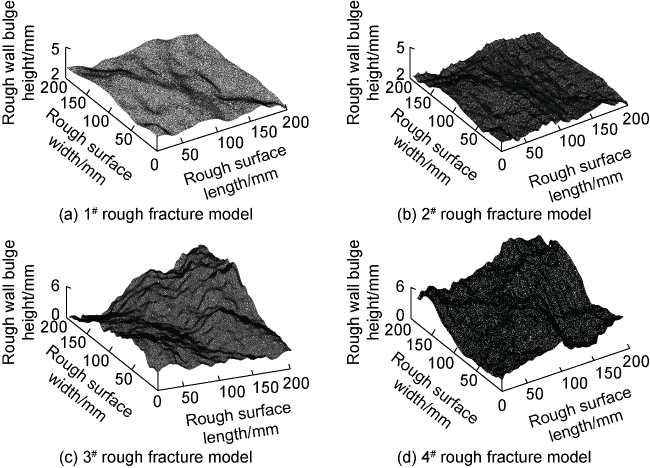
Fig. 4. Rough fracture models generated by different data. |
2. Proppant-fracturing fluid two-phase coupling numerical model in rough fractures
Migration of proppants carried by fracturing fluid within rough fractures is solid-liquid two-phase flow where the fracturing fluid occurs as a continuous phase and the proppant particles are dispersed in the fracturing fluid as discrete phases. The flow field of fracturing fluid is characterized based on continuity equation, momentum equation and turbulence equation. Motion of proppants is analyzed based on solid-phase equation. By considering interactions between proppant particles, between particles and rough walls, and between fracturing fluid and proppant particles, the fluid flow field and movement of solid particles are coupled in a bidirectional manner to achieve dynamic filling simulation of proppant particles in rough fractures.
2.1. Solid phase equation
Fracturing fluid and proppant flow in a fracture model in a free state. The movement of an individual proppant particle is regarded as superposition of translation and rotation [17].
${{m}_{i}}\frac{\text{d}{{v}_{i}}}{\text{d}t}={{F}_{\text{pf},i}}+\sum\limits_{j=1}^{z}{\left( {{F}_{\text{n},ij}}+{{F}_{\text{t},ij}} \right)+{{m}_{i}}g}$
${{I}_{i}}\frac{\text{d}{{\omega }_{i}}}{\text{d}t}=\sum\limits_{j=1}^{z}{\left( {{M}_{\text{t},ij}}+{{M}_{\text{r},ij}} \right)}$
Particle contact is characterized by a nonlinear viscoelastic Hertz model. The normal contact force is the function of normal overlap δn [17]:
${{F}_{\text{n}}}=\frac{4}{3}Y\sqrt{R}\delta _{\text{n}}^{\tfrac{\text{3}}{\text{2}}}$
The normal elastic damping is expressed as [17]:
$F_{\text{nd}}^{{}}=-2\sqrt{\frac{5}{6}}\beta \sqrt{{{s}_{\text{n}}}{{m}^{*}}}\text{ }{{v}_{\text{n}}}$
where
$\left\{ \begin{align} & \beta =\frac{\ln E}{\sqrt{{{\ln }^{2}}E+{{\pi }^{2}}}} \\ & \\ & {{s}_{\text{n}}}=2Y\sqrt{R{{\delta }_{\text{n}}}} \\ & \\ & \frac{1}{{{m}^{*}}}=\frac{1}{{{m}_{i}}}+\frac{1}{{{m}_{j}}} \\ \end{align} \right.$
The tangential contact force depends on tangential overlap and tangential stiffness which can be calculated by Mindlin-Deresiewicz contact theory [17]:
${{F}_{\text{t}}}=-{{s}_{\text{t}}}{{\delta }_{\text{t}}}$
${{s}_{\text{t}}}=8G\sqrt{R{{\delta }_{\text{t}}}}$
$\frac{1}{G}=\frac{2\left( 2-{{\mu }_{\text{p}i}} \right)\left( 1+{{\mu }_{\text{p}i}} \right)}{{{Y}_{i}}}+\frac{2\left( 2-{{\mu }_{\text{p}j}} \right)\left( 1+{{\mu }_{\text{p}j}} \right)}{{{Y}_{j}}}$
The tangential elastic damping of particles is expressed as [17]:
$F_{\text{td}}^{{}}=-2\beta {{v}_{\text{t}}}\sqrt{\frac{5}{6}{{s}_{\text{t}}}{{m}^{*}}}$
Thus, the contact force of particle j on particle i is expressed as [17]:
$F_{\text{c},ij}^{{}}={{F}_{\text{t},ij}}+F_{\text{td},ij}^{{}}+{{F}_{\text{n},ij}}+F_{\text{nd},ij}^{{}}$
The contact force between the particle and the fracture wall is calculated based on the above model by assuming that the fracture wall is an infinite stationary sphere.
2.2. Solid-fluid two-phase coupling equation
When the fracturing fluid carries proppants in fractures, the acting force of the fracturing fluid on proppant particles includes the drag force and buoyancy. The drag force on proppant particles flowing with the fluid is composed of differential pressure resistance and frictional resistance, and it is a main factor for momentum exchange between fluid and particles. The drag force is expressed as [9]:
${{F}_{\text{d}}}=\frac{3}{8{{s}_{\text{g}}}}{{C}_{\text{d}}}\frac{{{\left( {{u}_{\text{f}}}-{{u}_{\text{p}}} \right)}^{2}}m}{r}$
The drag force is calculated by a Gidaspow empirical model [18] according to dense and sparse distribution of proppant particles.
Proppant particles are affected by the drag force. To realize CFD-DEM coupling, the source term of momentum exchange between particles and fluid should be calculated. Momentum exchange characterizes the resistance of particles to fluid, which is equivalent to the reacting force of fluid to particles. The resistant force in unit volume is expressed as [19]:
${{F}_{\text{p}}}=-\frac{\sum\limits_{i=1}^{n}{{{F}_{\text{d},i}}}}{\Delta V}$
Coupling is operated as follows [6,7,12,19] in Fig. 5 . (1) Input initial parameters, and the continuity equation and momentum equation are solved iteratively in CFD software to obtain the pressure and fluid velocity in the flow field. The interaction force between fluid and proppant particles is calculated and imported into the EDEM solver (mechanical simulation software module for particle system). (2) The interaction forces between proppants, proppant and fracture wall are solved iteratively in EDEM, and the interaction force between particle and fluid is calculated and imported into CFD. (3) The updated interaction force between proppant particles is used to compute the fluid movement data in CFD, and then, the flow field is computed and updated. Finally, numerical simulation of proppant migration in fractures is completed by iteration of steps (2) and (3) until convergence.
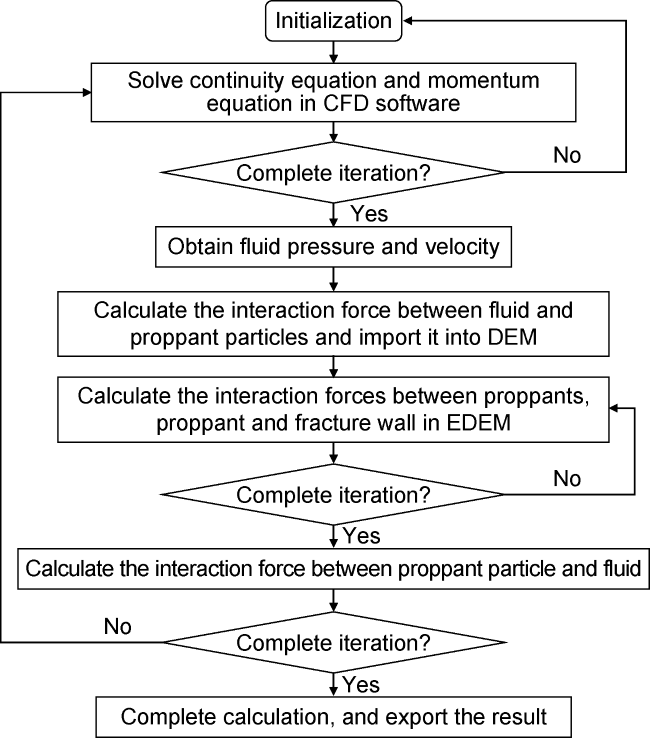
Fig. 5. Calculation process of CFD-DEM coupling. |
2.3. Numerical model verification
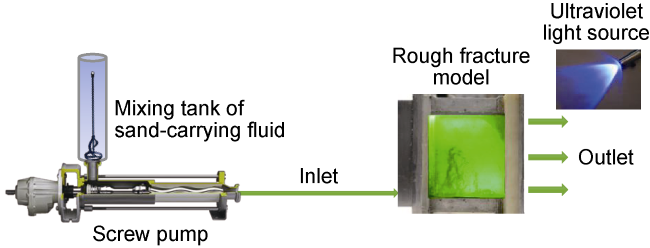
The numerical model was verified by comparing it with the results from other physical simulation experiments[4⇓-6]. The schematic of the experimental device is shown in Fig. 6 . The inlet is set at the lower left corner of the fracture physical model, and the outlet is set at the entire right edge. The fluid and proppants are mixed in the container and injected into the vertical fracture at a given pump rate.
Considering the computational complexity, the relevant simulation parameters are simplified to improve the computational efficiency. The inlet is simplified as a rectangular one with a width of 0.001 m and a height of 0.038 m. Taking 3# rough fracture model for example (Fig. 7 ), the inlet is set on the left wall of the rough fracture model and 0.01 m away from the bottom of the model. The outlet is set on the right wall of the model. Moreover, a smooth flat fracture model of the same size as the experimental model is established. The basic data of simulation are shown in Table 1 .
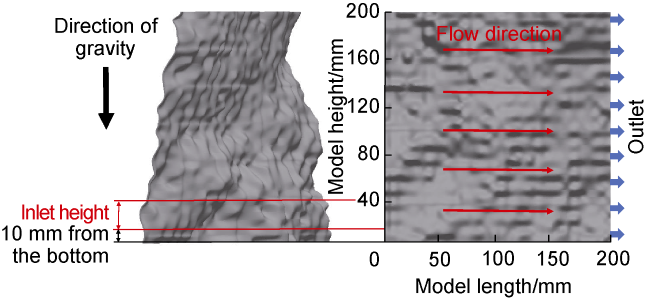
Fig. 7. Division of proppant transport boundary of the numerical model. |
Table 1. Schemes of numerical model verification |
| Scheme | Fracture length/ mm | Fracture width/ mm | Fracture height/ mm | Particle size/ mm | Particle density/ (kg·m-3) | Proppant mass fraction/% | Simulation particle number/ (particles·s-1) | Viscosity/ (mPa·s) | Pump rate/ (mL·s-1) | Fluid injection rate/ (m·s-1) | Fracture type |
|---|---|---|---|---|---|---|---|---|---|---|---|
| Experiment 1 | 200 | 1 | 200 | 0.375 | 2630 | 10 | 2.96 | 9.84 | 4# | ||
| Simulation 1 | 200 | 1 | 200 | 0.375 | 2630 | 14 700 | 2.96 | 0.25 | 4# | ||
| Experiment 2 | 200 | 1 | 200 | 0.375 | 2630 | 10 | 2.96 | 9.84 | 3# | ||
| Simulation 2 | 200 | 1 | 200 | 0.375 | 2630 | 14 700 | 2.96 | 0.25 | 3# | ||
| Experiment 3 | 200 | 1 | 200 | 0.375 | 2630 | 10 | 2.96 | 9.84 | Smooth flat | ||
| Simulation 3 | 200 | 1 | 200 | 0.375 | 2630 | 14 700 | 2.96 | 0.25 | Smooth flat |
The physical experiment and numerical simulation results are compared in Fig. 8 . The proppant placement morphology in the fracture numerical model is generally similar to that in the experiment. The foreground color (black) and background color (white) in the proppant placement area and the non-placement area in the rough fracture are filled, and the characteristic parameters are extracted to calculate the proppant coverage rate [4], which is the ratio of the proppant placement area to the fracture surface area. For example, the foreground color level ratio of the proppant placement area in Simulation 3 is 22.49%, which indicates the proppant sweep area in the fracture is 22.49% (Fig. 9 ). Comparison shows that the average error of the proppant coverage rate between physical experiment and numerical simulation is only 6.49%, which confirms that the accumulation morphology and coverage rate of proppant particles in numerical simulation are in good agreement with those in experimental results. This indicates that the numerical model of proppant migration in the rough fracture established in this paper can simulate the process of proppant placement in fractures.

Fig. 8. Comparison of proppant placement morphology in physical experiment and numerical simulation. |
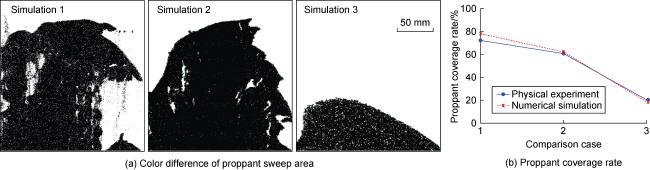
Fig. 9. Color difference of the proppant sweep area and comparison of proppant coverage rate. |
3. Proppant accumulation and distribution patterns in fractures
3.1. Proppant migration and settlement in fracture during injection through an inlet
The process of proppant migration and settlement is analyzed based on 3# and 4# rough fracture models in Fig. 4 . To improve the calculation efficiency, an injection inlet with a height of 15 mm is set at the bottom of the left wall and 10 mm away from the bottom. Simulation stops when the proppant placement morphology in the fracture does not change. In simulation, same parameters were applied in the smooth flat model and 3# and 4# rough fracture models. The basic parameters are listed in Table 2 .
Table 2. Basic simulation parameters |
| Parameter | Value | Parameter | Value |
|---|---|---|---|
| Fracturing fluid viscosity | 1.0 mPa•s | Particle generation rate | 6000 particles/s |
| Fracture width | 1.0 mm | Injection rate | 0.5 m/s |
| Proppant size | 0.35 mm | Proppant density | 2630 kg/m3 |
The simulation results are listed in Table 3 . There is a large difference in proppant flow in rough fractures and the smooth flat fracture. Moreover, proppant flow in 3# and 4# rough fracture models is different completely due to different roughness of the fracture walls. The fracture wall roughness is a main factor controlling proppant migration and settlement in vertical rough fractures.
Table 3. Proppant settlement process in rough fractures |
| Injection time/s | Smooth flat fracture | 3#rough fracture | 4# rough fracture |
|---|---|---|---|
| 2 | 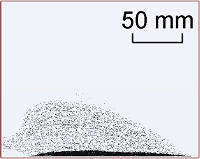 | 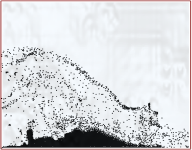 | 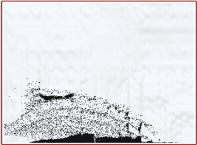 |
| 14 | 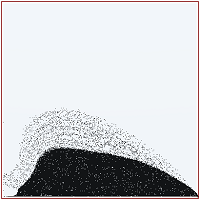 | 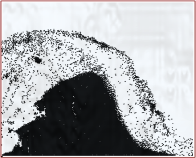 | 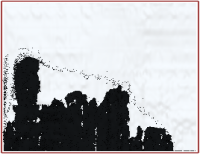 |
| 22 | 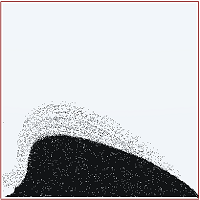 | 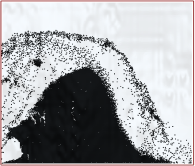 | Simulation stops when sand plugging occurs at the inlet |
By marking proppant particles injected into fractures at different time, the particle migration trajectory can be plotted (Figs. 10 and 11 ). (1) Proppant particles in the smooth flat fracture show a stable migration trajectory, proppant particles are placed in a layered pattern, and particles injected at different positions at the inlet settle down along the surface of the sand bank until the surface proppant particles are in a dynamic balance state of settlement and rolling up. (2) When proppants are injected at the bottom of the rough fracture, the rough wall bulge affects flow of the sand-carrying fluid at the bottom, the particle group migrates and disperses, and there is a jet trajectory along the rough fracture wall. Moreover, simulation of proppant migration in the rough fracture shows that an irregular fracture shows that an irregular and sparse sand mass at the bottom of the fracture grows vertically along the fracture, which is similar to previous experimental results[4⇓-6].
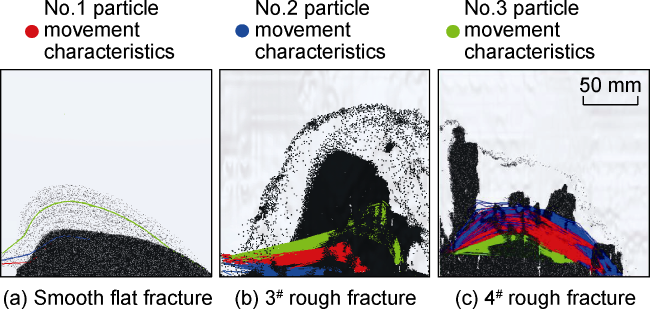
Fig. 10. Trajectory of proppant migration and settlement marked in different fracture models. |
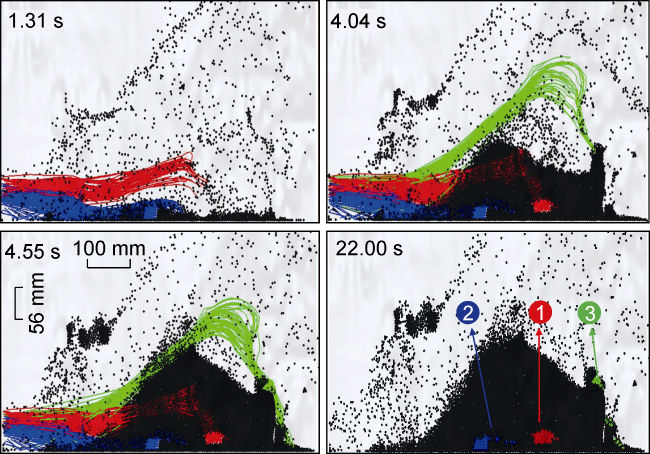
Fig. 11. Trajectory of proppant migration and settlement in 3# rough fracture marked at different times. |
As shown in Fig. 12 , statistics of the average velocity of the marked proppant particles and particle groups along the migration direction shows the process of proppant accumulation in the flat fracture and rough fractures. (1) In the smooth flat fracture, No. 3, No. 2 and No. 1 particles are injected at the upper, middle and lower positions of the inlet simultaneously. No. 1 and No. 2 particles experience acceleration and deceleration. Finally, their velocity decreases to 0, and the motion trajectory show no movement, and they are accumulated on the surface of the proppant bank. No.3 particle settles down in the far end of the proppant bank along the jet trajectory, and experiences acceleration-deceleration- rushing forward-deceleration. The particle velocity drops to 0 at 16.75 s, the migration trajectory stops, and the particle settles. The proppant particles injected at different positions of the flat fracture are distributed uniformly, and mainly along the jet trajectory. Proppants accumulated in the flat fracture and reach the steady state. (2) In 3# rough fracture model, the velocity of No. 1, No. 2, and No. 3 particle groups injected at different time shows a similar trend, and No. 2 particle group injected firstly is accumulated in the middle of the fracture at 0.7 s, and the velocity drops to 0. No. 1 particle group injected at 0.4 s is affected by aggregation of No. 2 particle group. At 1.3 s, it is accumulated between the inlet and No. 2 particle group, when the velocity drops to 0. With an increment of the proppant accumulation height in the void, No. 3 particle group injected later is lifted over the proppant bank and settles down on the back side, when the velocity decreases basically to 0 at 4 s. Proppants injected late repeat this process until the proppant accumulation became stable.
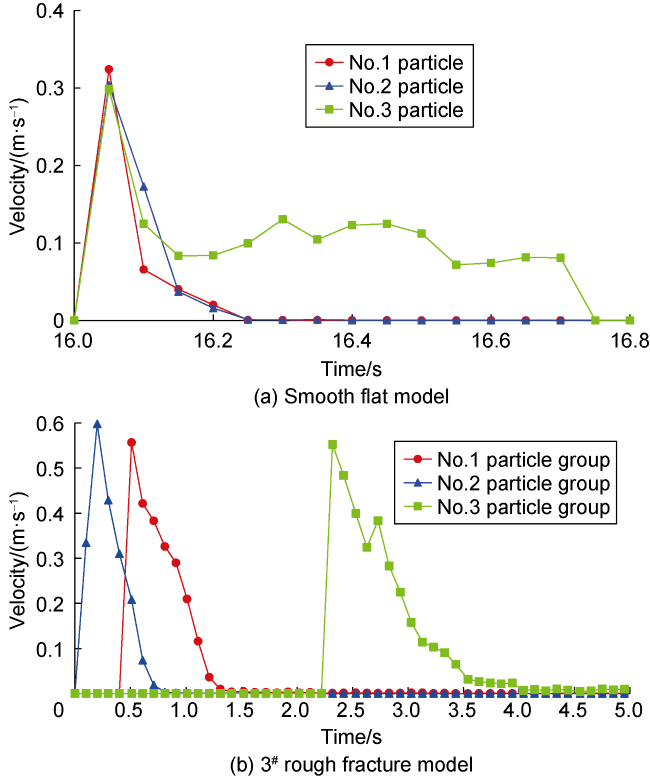
Fig. 12. Particle average velocity in the fracture models over time. |
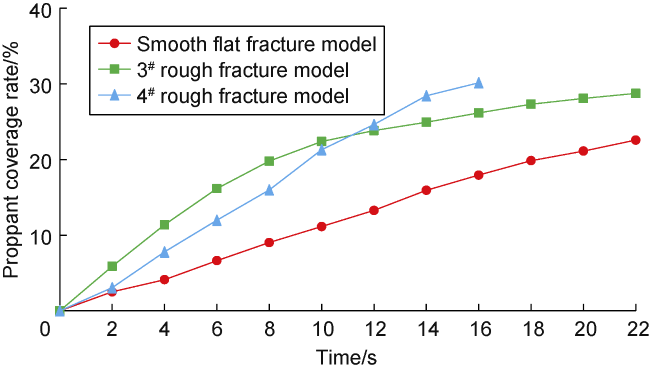
Fig. 13. Proppant coverage rate over time. |
The proppant accumulation process in the vertical rough fracture is illustrated in Fig. 14 . The flow of fluid carrying proppant particles through narrow and rough channels is decomposed into horizontal and vertical movement. The former is controlled by injection pressure and flow resistance, and the latter is controlled by gravity, buoyancy and resistance to subsidence. When the particles move to the position with a larger roughness (shaded in green), the horizontal movement is affected by the fracture wall and slows down. Then, particles settle and are accumulated under the action of gravity and form the sand mass. Once the sand mass is formed, the flow field near the bottom sand mass is seriously affected, which hinders the horizontal movement of particles. A large amount of proppants settle down between the inlet and the accumulated sand mass. As more particles settle down, the sand plugging occurs ultimately. The larger the roughness is, the more likely to cause vertical proppant accumulation at the inlet until proppants fill the entire inlet. The green area of the rough fracture is much rougher than the blue and yellow areas, it's most possible for particles to impact on the fracture wall, and the possibility of proppant settlement is also highest [4]. Therefore, sand plugging is likely to occur in the green area. Moreover, in this process, the sand mass diverts part of the sand-carrying fluid upward, making a certain amount of particles skip over the sand mass, and settle down and accumulate on the back of the sand mass under the action of gravity. The higher the fracture roughness is, the faster the proppant settlement near the fracture inlet, the shorter the horizontal migration, and the more possible to accumulate near the fracture inlet. Finally, sand plugging may occur in the fracture in a short time.
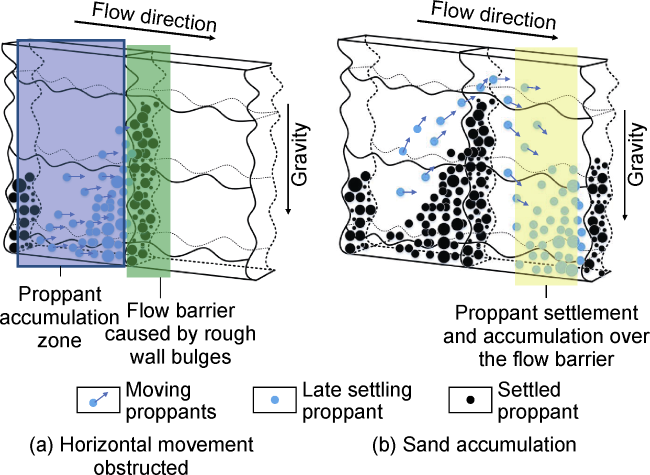
Fig. 14. Proppant accumulation process in vertical rough fracture. |
3.2. Proppant migration and settlement in fracture during injection through several inlets
Based on above research, the smooth flat model and 1# and 2# rough fracture models in Fig. 4 are applied. The injection position is re-arranged, and three inlets with the height of 15 mm are set uniformly on the wall surface along the left side of the fracture model. The upper and the lower injection inlets are 10 mm away from the boundary respectively. Simulation in the smooth flat model, 1# rough fracture model and 2# rough fracture model is carried out with same basic parameters. The fracturing fluid viscosity is 2.0 mPa·s, the particle generation rate is 6000 particles/s at each injection inlet, and other parameters are listed in Table 2 .
The improved cube covering method [16] is used to calculate the fractal dimension of the structural surface of the rough fracture. Mathematical description of the roughness of the complex surface and indirect quantification of the roughness of the fracture numerical model are realized. The fractal dimension of the structural surfaces of 1# and 2# rough fractures are calculated as 2.084 5 and 2.218 9, respectively. The larger fractal dimension corresponds to greater change frequency of rough wall bulges and larger roughness of the surface of the fracture structure. The smaller fractal dimension corresponds to gentler surface of the fracture rough structure and the smaller roughness.
The simulation results are illustrated in Table 5 . The fractal dimension of the wall surface of 2# rough fracture model is larger than that of 1# rough fracture model. As the proppant enters the fracture through three injection inlets, the proppant accumulation height in 2# rough fracture model is much larger than that in 1# rough fracture model, and it approaches the fracture height rapidly. The proppant migration trajectory fluctuates more frequently in 1# and 2# rough fracture models than in the flat flat model. Accumulation of the particles injected at the bottom inlet follows the characteristics of proppants injected at a single inlet. Under the action of gravity, rough wall bulges and fluid drag, parts of the proppant particles injected in the middle and upper inlets are accumulated along the surface on the sand mass at the bottom, the height and volume of the sand mass increase, and some particles flow out of the model along the void.
Table 5. Proppant sedimentation and accumulation process |
| Injection time/s | Smooth flat fracture model | 1#rough fracture model | 2# rough fracture model |
|---|---|---|---|
| 2 | 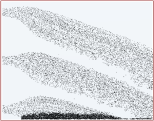 | 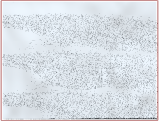 | 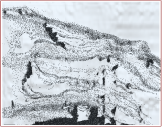 |
| 14 | 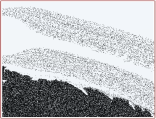 | 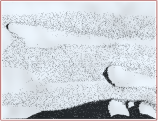 | 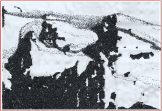 |
| 18 | Proppant bank does not change | 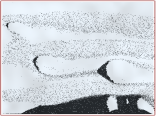 | 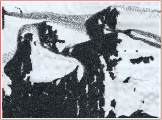 |
| 22 |  | Simulation stops when sand plugging occurs at the inlet |
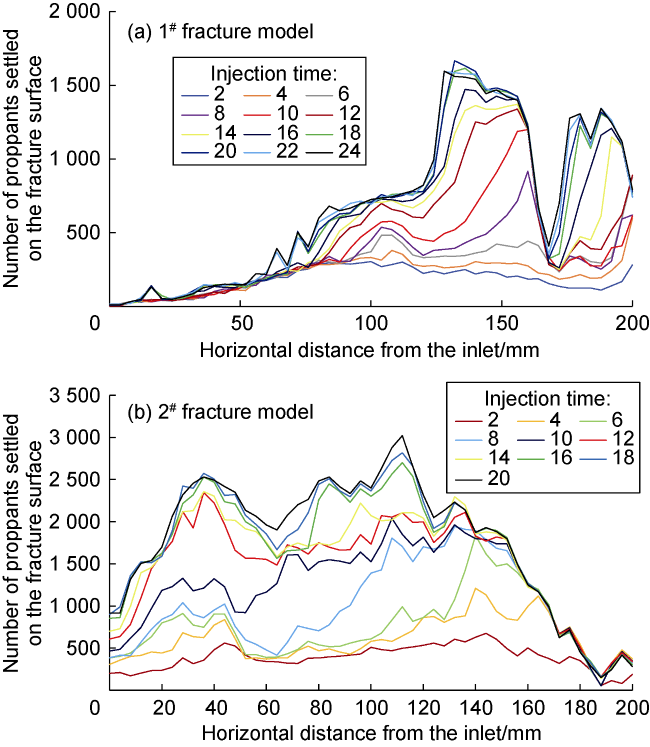
Compared with the flat fracture, the rough fracture model has a larger roughness of the fracture wall, which causes larger disturbance to the flow field in the fracture and unstable migration trajectory of proppants resulting in the tendency of aggregation and clustering of particles. Fig. 15 shows the number of proppant particles settled on the fracture profile over time. The higher fracture roughness causes faster proppant accumulation near the fracture inlet, sparser proppants filling inside the fracture, and sand plugging at the fracture inlet in a short time. The roughness of fracture wall has an effect on controlling the fluid migration trajectory and the proppant-filling mode in fractures. Table 5 and Fig. 15 show that: (1) The proppant sweep area in 2# rough fracture model is larger than that in 1# rough fracture model, indicating fracture roughness is favorable for increasing proppant sweep area; the rougher fracture wall causes faster increase of proppant sweep area and proppant placement height; (2) Sand plugging occurs at the injection inlet of 2# model with the more rough fracture wall and causes difficulty in proppant migration.
Fig. 15. Number of proppants settled on the fracture surface at different time. |
The final proppant coverage rate is 24.68%, 10.57% and 43.57% in the smooth flat model, and 1# and 2# rough fracture models respectively. Combined with the proppant accumulation process in the fracture in Table 5 , it is found that 2# rough fracture model has the largest fracture wall roughness, which causes the fastest proppant settlement and the highest proppant coverage rate. In the smooth flat model without effects of rough fracture, proppants settle down immediately under the action of gravity at the beginning of injection, and there is a medium proppant coverage rate. In 1# fracture model with small bulges on the fracture wall, the proppant particle flow trajectory is lifted, resulting in most particles flowed out of the fracture model with the sand-carrying fluid, and the proppant coverage rate is lower than that of the smooth flat model. Proppants in rough fractures do not always settle down in the direction of gravity. The rough fracture wall causes diversion of the sand-carrying fluid near the bulges. To a certain extent, the proppant sweep area is larger in rough fractures, especially the proppants accumulated along the fracture height. There are both advantages and disadvantages in proppant migration in rough fractures. The parameters for proppant migration in rough fractures should be optimized according to actual reservoir conditions.
4. Conclusions
The real rough fracture wall shape is constructed by using fractal interpolation, and a CFD-DEM coupling solid-fluid two-phase flow model is established by considering interactions between particles, particle and fracture wall, and particle and fluid. It is verified with the experimental data that the model can reflect the migration and accumulation process of proppants in rough fractures.
When proppants migrate in the rough fractures, the bulges on the rough wall have a significant effect on the horizontal migration trajectory of the proppants. The higher roughness of the fracture model causes faster settlement of proppant particles near the fracture inlet, shorter horizontal migration distance, resulting in the tendency of proppant accumulation near the inlet and sand plugging in the fracture within a short time.
Fracture roughness has an effect on controlling the fluid flowing path and proppant-filling mode in the fracture to certain degree. On the one hand, the rough wall bulges lift the proppant transport path and make proppants flowed out of the fracture, resulting in a smaller proppant sweep area. On the other hand, the sand-carrying fluid possibly changes flowing direction near the bulges, thus expanding the proppant sweep area.
Nomenclature
Cd—drag coefficient, dimensionless;
E—collision recovery factor, dimensionless;
Fd—total drag force exerted by fluid on solid particle, N;
Fd,i—drag force exerted by fluid on particle i, N;
Fn—normal contact force of particles, N;
Fnd—normal elastic damping of particles, N;
Ftd—tangential elastic damping of particles, N;
Fc,ij—contact force of j-th proppant particle on i-th proppant particle, N;
Fpf,i—acting force of fluid on particle i, N;
Ft,ij, Ftd,ij, Fn,ij, Fnd,ij—tangential elastic force, tangential damping, normal elastic force, normal damping between proppant particles i and j, N;
Fp—resistance of solid particles to fluid per unit volume, N/m3;
Ft—tangential contact force, N;
g—acceleration of gravity, m/s2;
G—equivalent shear modulus, Pa;
i, j—particle SN;
Ii—moment of inertia of particle i, kg•m2;
mi, mj—mass of particles i and j, kg;
m*—equivalent mass, kg;
Mt,ij, Mr,ij—moment caused by tangential force and rolling friction, N•m;
n—number of particles in the calculation grid;
r—particle radius, m;
R—effective particle radius, m;
sg—ratio of particle density to water density at 4 °C, dimensionless;
sn—normal stiffness, N/m;
st—tangential stiffness, N/m;
t—time, s;
uf—fluid velocity at particle position, m/s;
up—particle velocity, m/s;
vi—linear velocity of i-th particle, m/s;
vn, vt—normal and tangential components of particle relative velocity, m/s;
Y—elastic modulus of particle, Pa;
z—total contact times of particle i with other particles and solid wall surface;
β—intermediate variable, determined by recovery factor, dimensionless;
μpi, μpj—Poisson's ratio of particles i and j, dimensionless;
δn—normal distance, m;
δt—tangential distance, m;
ΔV—volume of unit grid, m3;
ωi—angular velocity of particle i, rad/s.