

Introduction
The realization of the goal of carbon neutrality requires human society to establish a green, environmentally friendly and sustainable zero-carbon energy system, so as to decouple economic development from carbon emissions. Carbon dioxide capture, utilization and storage (CCUS) is an important means to reduce CO2 emissions, ensure energy security, build ecological civilization and achieve sustainable development. The Intergovernmental Panel on Climate Change (IPCC) pointed out in the fifth Assessment report [1] that CCUS is of great significance for global greenhouse gas emission reduction. Most models that do not consider CCUS cannot achieve the goal of 450×10-6 CO2 equivalent concentration by 2100. The International Renewable Energy Agency (IRENA) and the International Energy Agency (IEA) have also carried out a number of modeling studies, which have confirmed the important role of CCUS in curbing the greenhouse effect [2-3]. The international community has taken active measures to promote the research and application of this technology. Developed countries in Europe and the United States have actively established multilateral international cooperation mechanisms, including Carbon Sequestration League Forum (CSLF), Ministerial Conference on Mission Innovation (MI) and Clean Energy Ministerial (CEM), to promote CCUS development [4]. China is also advancing the development and demonstration of CCUS technology in an orderly manner. The National Carbon Capture, Utilization and Storage Technology Development Special Plan during the 12th Five-Year Plan Period [5], the Notice of the National Development and Reform Commission on Promoting Carbon Capture, Utilization and Storage Test and Demonstration [6], the Action Plan for Energy Technology Revolution and Innovation (2016-2030) [7], and the 14th Five-Year Plan for Science and Technology Innovation in the Field of Energy [8] have been issued and CCUS technology is included into major project support areas.
As an important part of China's carbon neutrality technology portfolio, CCUS technology is not only a technical choice for low-carbon use of fossil energy and an important means to maintain the flexibility of the power system, but also a feasible technical solution for steel, cement, chemical and other industries with difficulties in carbon emission reduction. At present, China's CCUS has made remarkable progress in all technical links, and some of the technologies have the potential for commercial application. By 2021, there are about 40 CCUS demonstration projects in operation or under construction, with a capture capacity of 3×10⁶ t/a. These projects are mainly small-scale oil capture and displacement demonstrations in petroleum industry, coal chemical industry and electric power industry, lacking large-scale whole-process industrialization demonstration with multiple technology combinations [9].
Relative industries carry out research on CCUS technology according to their needs or technological advantages. Research in the chemical industry focuses on exploring new adsorbents, such as nano-calcium oxide- based adsorbents [10], aminomodified ordered mesoporous alumina [11], and pseudo-boehmite supported polyethylenimide [12]. To meet the requirements of thermal power carbon capture, the power industry carries out research on the carbon capture process of coal power flue gas using methyl diethanolamine/piperazine mixed amine method [13], CO2 capture process of coal-fired flue gas using alcohol amine method [14], and integrated coal gasification combined cycle power generation system (IGCC) based on carbitol acetate [15]. The coal and petroleum industries focus on the geological utilization and storage of CO2, and have conducted researches on CO2-EOR (Enhanced Oil Recovery) [16-17] and CO2 storage potential assessment [18].
Besides the application in various industries, CCUS has attracted scholars' attention as a whole-process industry. Its development potential and role in China's low-carbon development are worthy of further research. Reference [19] mainly summarizes the current situation and typical applications of CCUS technology, focusing on the CO2 capture link. Reference [20] focuses on CCUS-EOR technology, sorting out the main process and its industrialization process. Reference [21] reviews the development frontier of CO2 capture, utilization and storage technology. However, current macro-industrial research focuses on technological development process and current industrial layout. The research on future industrial development potential and scale prediction generally only conducts preliminary qualitative analysis, lacking systematic global quantitative research, resulting in an incomplete understanding of the contribution of CCUS to the realization of the “dual-carbon” goal.
Based on the above problems, this paper constructs a cost-scale calculation model of CCUS technology under the fossil energy continuation scenario in China in 2060, aiming to evaluate China's scale potential for CO2 emission reduction based on CCUS technology and its corresponding cost in the carbon neutrality stage. Based on the CO2 global optimization configuration demands in the model, a recommended distribution scheme for national backbone transmission pipelines is proposed, and the emission reduction cost per kilowatt hour of thermal power based on CCUS technology is analyzed. The calculation model adopts a fossil energy continuation scenario[22], which does not use clean energy substitution and other process to achieve carbon neutrality, but continues the current fossil application method and fully uses CCUS to achieve the assumed scenario of carbon neutrality. The purpose of using this scenario is to calculate the maximum amount of CO2 emission that CCUS technology can offset under certain cost constraints and explore China's maximum emission reduction potential of CCUS technology from an economic perspective.
1. Model data
The whole-process CCUS technology includes three links of capture, transportation, utilization/storage, involving a wide range of industries and many specialties. By sorting out technical research reports, papers and books in different fields such as petrochemicals, geology, agriculture, environmental protection [19⇓⇓⇓⇓⇓⇓⇓⇓⇓⇓⇓-31], as well as industry planning and roadmap materials from relevant national agencies [4,9], based on China's industrial development scale and geographical storage endowment [17-18,23], we evaluate the economic costs of different technical routes in the carbon neutrality stage, the CO2 utilization and storage potential, and the geographical location information, which lays a data foundation for the construction of the cost-scale model.
1.1. CO2 capture
For capture link, the model needs CO2 emissions amount (also as capture demand) and CO2 capture cost data for different industries and capture methods.
The CO2 capture demand data under the fossil energy continuation scenario is mainly based on the report “The Road to China's Carbon Neutrality” published by the Global Energy Interconnection Development and Cooperation Organization (GEIDCO) [22]. According to the predicted annual carbon emissions of major carbon-emitting industries (including energy, chemical, metallurgy, and building materials) in China and their location distribution [9], considering factors such as population growth, economic development, industrial scale, and future planning layout, the total CO2 emissions demand of different industries in seven regions of China will reach 27.33×10⁸ t in 2060, involving the petroleum and chemical industry, thermal power, steel and cement industry. The CO2 reduction amount of CCUS in China in 2060 is roughly equivalent to the upper limit of CCUS reduction amount in the United States in 2050 predicted by the US Department of Treasury, i.e., 24.5×10⁸ t [9]. Based on the development trend and application potential of different technical routes of CO2 capture [4], the capture amount of specific technical routes used in different industries has also been divided.
Different technical routes are used for different application scenarios (industries, facility conditions, CO2 concentration, etc.), and different technical routes have different technological maturity, applicability, economic feasibility, and corresponding facility construction processes. The economic cost of carbon capture is also different. The technical scenarios considered by the model include exhaust gas capture from chemical plants and heating boilers in the petrochemical industry; pre-combustion capture, post-combustion capture and oxygen-enriched combustion capture in the thermal power industry; carbon capture in the steel industry; and carbon capture in the building cement industry. The unit carbon capture cost in 2060 under different scenarios ranges from 70 to 170 RMB/t [4,9].
1.2. CO2 storage
For storage method, the model needs the location, capacity and cost data of the storage target area.
The storage data is mainly based on the research of the “National Evaluation and Demonstration Project of CO2 Geological Storage Potential” led by the China Geological Survey Bureau [23]. The research shows that the regions in China with large CO2 storage potential include onshore regions such as the Ordos Basin, the Junggar Basin, the Tuha Basin, the Songliao Basin and the Sichuan Basin, and offshore regions such as the Pearl River Mouth Basin, the East China Sea Basin, and the North Jiangsu-South Yellow Sea Basin. According to the suitability evaluation results, the storage basins are divided into five levels: suitable, relatively suitable, general, relatively unsuitable, and unsuitable. The higher the suitability level, the better the geological safety, storage environmental risk and economic suitability conditions are. The model only considers the storage target areas of the first three levels and reflects the suitability levels in the storage cost.
Based on the geological conditions and suitability evaluation of different target areas [9,23⇓ -25], we have sorted out the cost of CO2 storage in different regions and the maximum capacity corresponding to each cost. The costs of different storage technical routes are 35 RMB/t for depleted gas reservoirs, 50-150 RMB/t for onshore enhanced saline aquifers and 100-200 RMB/t offshore saline aquifers respectively [9,18,23].
1.3. CO2 utilization
For utilization method, the model needs the data on the distribution, development potential, and utilization benefit of relevant industries. The utilization scenarios include biological, chemical and geological utilization, specifically including gas fertilizer, methanol-ethylene, methanol-traditional raw materials, urea, methane, methanol-aromatic hydrocarbons, enhanced oil and gas exploitation, involving chemical industry, agriculture, oil and gas, and other industries. The economic attributes of each link of CCUS in the model are expressed as costs. Therefore, the benefits brought by the utilization link are expressed as negative values for the cost.
Chemical utilization is the field with the greatest potential for CO2 utilization, especially for ethylene, traditional raw materials and urea. Synthesizing CO2 and hydrogen gas into chemical products by using the power to raw materials (P2X) technology is an inevitable trend for increasing electrification rate and promoting clean development in the future [26]. In this model, the geographical distribution of CO2 utilization potential for different types is predicted based on the current distribution of chemical product industry across the country [27⇓-29]. Based on the difference between electricity production costs and fossil fuel prices, the benefit of chemical utilization is 7-350 RMB/t [26,29].
Biological utilization mainly considers the use of CO2 as gaseous fertilizers. The development potential of microorganism utilization to produce high value-added products is limited for its high cost. According to relevant research and technological progress, the model assumes that CO2 gas fertilizer will bring an average yield increase of 30% to greenhouse crops [32], and the economic benefit of each ton of CO2 is about 455 RMB. Based on the survey of China's greenhouse planting scale, it is estimated that the national CO2 utilization potential is about 21 million tons per year [22]. Considering the limitation of land area and the expected slight population decline in 2060 compared with the current [30], the gas fertilizer utilization potential in 2060 is calculated based on the current utilization potential.
Geological utilization mainly includes EOR and EGR (enhanced gas recovery), mainly in large oil and gas fields in North China, Northeast China and Northwest China. About 13 billion tons of OOIP in China are suitable for EOR, which can increase the recovery factor by 15%, increase recoverable reserves by 1.92 billion tons, and store about 4.7-5.5 billion tons of CO2 [9,31]. China's gas reservoirs are mainly distributed in the Ordos Basin, the Sichuan Basin, the Bohai Bay Basin and the Tarim Basin. Studies have shown that about 90 million tons of CO2 can be stored through EGR [9]. In this model, considering a utilization period of 100 years, it is assumed that the yearly geological utilization potential of each oil and gas reservoir does not exceed 1% of the total utilization potential. The total equipment investment and project operation cost of EOR and EGR are about 25-30 RMB/t CO2, and it is expected that the injection cost in 2060 will drop to about 10 RMB/t CO2 [4,9]. Considering that fossil energy will become increasingly scarce in the future and that oil and gas energy attributes will decline due to the development of clean energy, it is estimated that the oil price during the carbon neutrality stage is about 700 dollars/t [33], and the average oil exchange ratio will improve from 1:7 to 1:3 with technological progress [31,34]. EGR technology is currently under research, and its commercialization is expected to realize after 2040. The average gas exchange ratio will reach 1:5 by 2060 [4,31,35 -36]. The economic benefit of EOR technology is expected to be about 1580 RMB/t CO2 based on the yield increase benefit per unit weight of CO2 minus input cost; while for EGR technology it is expected to be about 160 RMB/t CO2.
1.4. CO2 transportation
Transportation methods include road and rail tank transport, pipeline, ship transport. Among them, pipeline is the most economical and safe way. This link involves the progress of pipeline system construction, the economy of different methods, and the global optimization scheduling of CO2.
According to the roadmap planning of CCUS technology by the Department of Science and Technology for Social Development of the Ministry of Science and Technology of China, China will build more than 20 000 km of land pipelines with an annual transportation capacity exceeding 1 billion tons by 2050 [4]. Offshore pipelines will enter the commercial application stage [4]. It is expected that by 2060, China's land pipelines will meet the transportation demands between major industrial agglomeration areas and storage target areas. Tank truck transportation can be used within local areas. Considering the scale effect and equipment investment, the transportation prices of land pipelines, road tank trucks, rail tank trucks, and offshore pipelines are 0.3, 1.2, 1.0, and 1.0 RMB/(t•km), respectively [4-5,9].
2. Model construction
The establishment of the cost-scale model for the global system configuration of CCUS technology includes the construction of a zoning model, integrated analysis, and application of model results.
2.1. General thought
The target of the model is to minimize the total cost of the CCUS entire process. With data of the CO2 capture demand of different industries in each region and the distribution of utilization/storage resources, appropriate transportation methods and paths are used to match the capture link with the utilization/storage link to form a CCUS whole-process processing process. The whole-process cost and corresponding scale are calculated by recording the matching process. Based on the calculation results of seven regions including East China, North China, Central China, South China, Southwest China, Northeast China, and Northwest China, the cost and corresponding scale of CCUS technology in China can be obtained.
The basic structure of the calculation model for each region is shown in Fig. 1 . According to the CCUS process, the model takes CO2 capture location as the geographical starting point (blue box), and CO2 utilization/storage resource site as the destination (orange box). Based on the location and scale capacity of capture and utilization/storage, reasonable transportation methods and routes (green box) are planned, connecting the starting point and the destination. Corresponding to the planned three links, the cost is summed up (as shown by dotted arrow). Thus the whole-process cost and corresponding scale are obtained (red box). The cost prediction of each link needs to consider factors such as technological progress, policy support, and scale effect, while the maximum scale prediction needs to consider current industry scale and future development affecting factors.
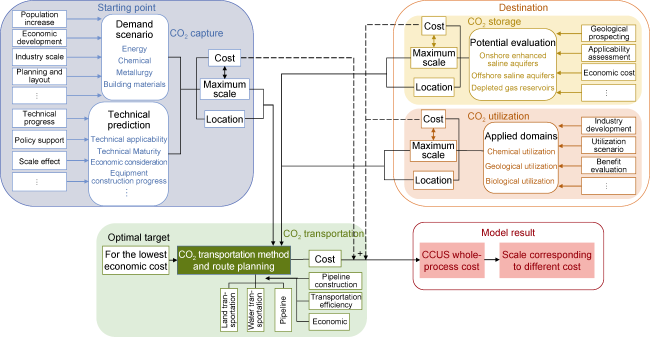
Fig. 1. The general thought of CCUS cost-scale model. |
Due to limited forecast data and planning materials, we make the following assumptions: (1) For channels with transportation demand exceeding 1.0×10⁸ t/a, it is assumed that a mature pipeline has been constructed, and the transportation cost is calculated according to pipeline method. (2) Compared with CO2 storage, CO2 utilization has a smaller scale and a better economic benefit, and is the preferred processing method considered in each region. Considering China's plan to build a CCUS industry cluster, the CO2 utilization in the model first meets the CO2 processing demands of the local area, and the transportation distance is calculated based on an average of 50 km. (3) Considering the difference in storage difficulty of saline aquifer, the annual storage amount of each target area is divided according to 1:3:3:3 in injection sequence, and the cost is calculated at 50, 80, 100, and 150 RMB/t respectively.
2.2. Construction steps
In the model, the whole country is divided into seven regions, namely East China, North China, Central China, South China, Southwest China, Northeast China, and Northwest China, the costs and scales of different links in each region are sorted out respectively. The typical curve diagram of the model (Fig. 2 ) is only used to illustrate the modeling method, and the curve drawing does not completely correspond to the above data.
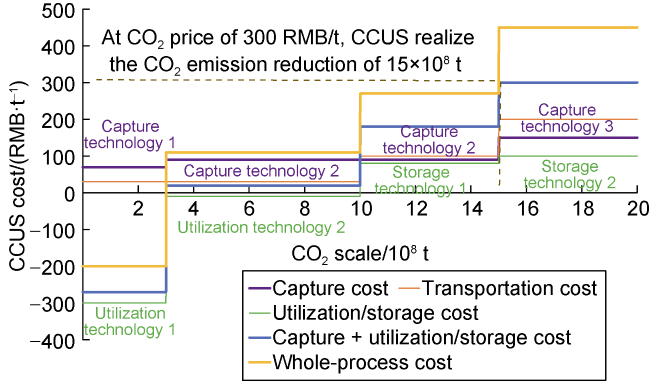
Fig. 2. Schematic diagram of CCUS cost-scale curve. |
2.2.1. Capture link curve
Taking the main industrial gathering place in each region as the carbon source location and based on the CO2 capture demand data, the costs and corresponding scales of different CO2 capture technologies in different industries are arranged in order of cost from low to high to form a cost-scale curve of CO2 capture link. The purple thick curve in Fig. 2 is its schematic diagram. Capture technology 1 is the lowest cost method. If compared with the capture cost data, it is the tail gas capture technology of petrochemical industry with a cost of 73 RMB/t. Similarly, capture technologies 2 and 3 correspond to heating boiler capture technology of petrochemical industry and post-combustion capture technology of thermal power industry. The cost-scale curve expression of CO2 capture link is:
${{P}_{\text{c}}}={{f}_{\text{c}}}\left( x \right)$
2.2.2. Transportation + utilization/storage link curve
As the location of the storage target area determines the transportation distance, the model considers the transportation link and utilization/storage link together. For CO2 utilization, China has planned to build a CCUS technology industry cluster [4], which tends to reasonably allocate the capture and utilization-related industries close with each other. Therefore, the model assumes that the transportation distance for utilization is 50 km. For CO2 storage, the optimization configuration of the whole country is considered comprehensively, and capture and storage locations that are relatively close are matched up to plan transportation methods and routes. In the model, most of the transportation distances are between 200 km and 600 km, and some distances in long-distance transportation schemes exceed 1000 km. For routes with large-scale transportation demand, pipeline construction is considered. For each region, the costs of two links of transportation and utilization/storage are arranged from low to high (as shown by the green and orange thin lines in Fig. 2 ), respectively. The sum of the two links' cost (vertical axis) is calculated, and the scale corresponding to each cost is sorted out. The cost-scale curve of transportation + utilization/storage is drawn (as shown by the blue thick line in Fig. 2 ), with an expression:
${{P}_{\text{tsu}}}={{P}_{\text{t}}}+{{P}_{\text{su}}}={{f}_{\text{t}}}\left( x \right)+{{f}_{\text{su}}}\left( x \right)$
2.2.3. Whole-process curve
For each region, the vertical coordinates of the capture curve (purple thick line) and the transportation + utilization/storage curve (blue thick line) are added to obtain the cost-scale curve of the entire CCUS process (as shown by the yellow thick line in Fig. 2 ), with an expression:
${{P}_{\text{total}}}={{P}_{\text{c}}}+{{P}_{\text{tsu}}}={{P}_{\text{c}}}+{{P}_{\text{t}}}+{{P}_{\text{su}}}={{f}_{\text{c}}}\left( x \right)+{{f}_{\text{t}}}\left( x \right)+{{f}_{\text{su}}}\left( x \right)$
2.2.4. Regional model example
Taking East China as an example, a CCUS cost-scale model is constructed to illustrate the model construction method.
First, draw the CO2 capture curve. According to the predicted CO2 capture cost data, East China has all the seven industrial scenarios with CO2 capture demands. The model arranges the seven capture scenarios in order of cost from low to high and calculates the cumulative capacity (Table 1 ). The capture cost is used as the vertical axis, and the cumulative capture demand from low to high cost is used as the horizontal axis to draw the carbon capture curve, which is the blue line in Fig. 3 .
Table 1. CO2 capture demand in East China |
| CO2 capture classification | CO2 capture cost/ (RMB•t-1) | Capacity/ 108 t | Cumulative capacity/ 108 t |
|---|---|---|---|
| Petrochemical: exhaust gas capture from chemical plants | 73.15 | 0.64 | 0.64 |
| Petrochemical: heating boilers | 96.51 | 0.34 | 0.98 |
| Thermal power: post-combustion | 114.65 | 1.92 | 2.90 |
| Thermal power: pre-combustion | 158.15 | 0.11 | 3.01 |
| Steel industry | 166.51 | 2.15 | 5.16 |
| Thermal power: oxygen- enriched combustion | 168.15 | 0.11 | 5.27 |
| Cement industry | 170.94 | 0.96 | 6.24 |
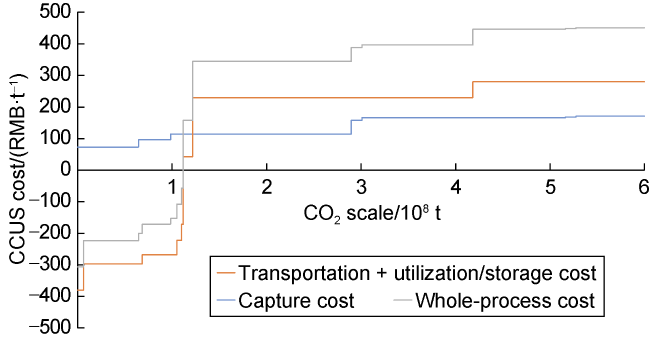
Fig. 3. The CCUS cost-scale curve of East China in 2060. |
Next, draw the curve of transportation + utilization/storage. According to the predicted data, the East China region has utilization scenarios including gas fertilizer, ethylene, traditional raw materials, urea, methane, and aromatic hydrocarbons, as well as storage resources including saline aquifers and ocean storage. The saline aquifer storage resources that are relatively close include the Jianghan Basin in Central China and the North Jiangsu-South Yellow Sea Basin in East China. Among them, the Jianghan Basin needs to first meet the local storage demand of Central China, and the local resources with better storage conditions and lower costs are utilized first in Central China. The cost of storage resources available for East China is relatively high, calculated at 80 RMB/t. The cost of storage resources in the North Jiangsu-South Yellow Sea Basin is between that of onshore saline aquifers and ocean storage. The industrial agglomeration area of East China is located in the Yangtze River Delta, and the capture and storage distances and the transportation costs can be calculated. The model ranks the costs of two links of utilization/storage and transportation from small to large (Table 2 ). The transportation + utilization/storage costs in Table 2 are included in the saline aquifers of the North Jiangsu-South Yellow Sea Basin in order of low to high, which can already meet East China's CO2 capture demand of 6.24×10⁸ t (Table 1 ), so the ocean storage in the East China Sea with higher costs is not needed. The line of utilization/storage + transportation links is drawn by taking the total cost of two links as the ordinate and the cumulative capacity with cost from low to high as the abscissa in Fig. 3 (in orange).
Table 2. The transportation + utilization/storage potential East China |
| Utilization/ Storage | Utilization/ Storage cost/ (RMB•t-1) | Capacity/ 104 t | Destination | Distance/ km | Transportation cost/ (RMB•t-1•km-1) | Transportation cost/ (RMB•t-1) | Two links' cost/ (RMB•t-1) | Cumulative capacity/ 104 t |
|---|---|---|---|---|---|---|---|---|
| Gas fertilizer | -455 | 635 | Local | 50 | 1.5 | 75 | -380 | 635 |
| Ethylene | -347 | 6222 | Local | 50 | 1.0 | 50 | -297 | 6857 |
| Traditional raw materials | -343 | 3648 | Local | 50 | 1.5 | 75 | -268 | 10 505 |
| Urea | -298 | 496 | Local | 50 | 1.5 | 75 | -223 | 11 001 |
| Methane | -247 | 178 | Local | 50 | 1.5 | 75 | -172 | 11 179 |
| Aromatic hydrocarbons | -7 | 1004 | Local | 50 | 1.0 | 50 | 43 | 12 183 |
| Saline aquifer storage | 80 | 29 655 | Jianghan Basin | 500 | 0.3 | 150 | 230 | 41 838 |
| Saline aquifer storage | 80 | 130 710 | North Jiangsu-South Yellow Sea Basin | 400 | 0.5 | 200 | 280 | 172 548 |
| Ocean storage | 100 | 32 220 | East China Sea | 300 | 1.0 | 300 | 400 | 204 768 |
Finally, draw the curve of the full process. Add the ordinate (cost) of capture link curve (blue) and the transportation + utilization/storage link curve (orange) in Fig. 3 to obtain the whole-process curve by the gray line in Fig. 3 . The abscissa is the cumulative CO2 capacity and the ordinate is the corresponding whole-process cost.
2.2.5. Integrated analysis
By organizing the model calculation results of the 7 regions in China, the national CCUS cost-scale distribution is obtained. The CO2 price of future carbon market is assumed to be 300, 400 or 500 RMB/t. When the CCUS cost is lower than the CO2 price, using CCUS to process CO2 has more economic advantages than buying CO2 from the carbon market. If relative industries have a driving force to adopt CCUS for CO2 emission reduction, it is considered that this part of CO2 can be reduced by CCUS technology. Otherwise, it is considered that CCUS technology is not used for CO2 emission reduction. For a fixed CO2 price, the CO2 processing scale below this price is statistically calculated for each region based on the cost-scale curve, and the scale of 7 regions is summed up to obtain the total application scale of CCUS in China. For example, it can be seen from Fig. 2 that the scale of cost-effective CO2 emission reduction achieved by using CCUS technology at or below 300 RMB/t is 15×108 t. The model shows that CCUS technology can achieve active CO2 emission reduction with a scale of 15×108 t if the CO2 price in the carbon market is 300 RMB/t.
2.3. Result application
The research results can be applied to the national CO2 transportation pipeline planning and the cost prediction of CCUS-based thermal power generation.
The construction of the CO2 transportation pipeline network mainly supports two situations: one is that the local area has insufficient storage resources and needs to transport a large amount of CO2 over long distances to other areas; the other is that the industrial agglomeration area and storage resources in the local area are far away and large-scale transportation within the region is needed. Based on the calculation results, routes with such transportation demands are statistically calculated as recommended transportation pipeline planning channels.
The combination of “thermal power generation + CCUS” is an important path for the power industry to achieve smooth carbon reduction. The model calculation results provide support for cost analysis of thermal power generation based on CCUS. By taking a weighted average cost of three CO2 capture methods of thermal power (i.e., pre-combustion capture, post-combustion capture and oxygen-enriched combustion capture), plus the national average transportation + utilization/storage cost, the CCUS whole-process cost is obtained, which can be converted into the cost per kilowatt hour of CCUS according to the carbon emission per kilowatt hour of power generation.
2.4. Scheme comparison
Three transportation schemes, namely local on-site storage, long-distance off-site storage, and on-site and off-site combined storage, are used to construct models.
China has a vast territory, with storage areas concentrated in the northern regions, but a considerable portion of capture demand in the central and southern regions. Moreover, China's CO2 storage potential is much greater than its utilization potential. Among 3 links in the whole process of CCUS, the scale and location of CO2 capture link is determined according to capture demand, while the storage target areas need to be scientifically planned according to the distribution of CO2 capture locations and national storage target area resources. If a nearby storage target area is selected, transportation costs can be saved, but storage conditions may not be good, costs may be high, and geological risks may be high. If a faraway storage target area with good conditions is selected, storage costs can be saved and geological risks can be reduced, but distance may be long and transportation costs may be high.
In some areas, there are suitable storage target areas, so off-site transportation is not needed in three schemes. In some area, however, there are no suitable storage target areas, so off-site transportation is needed in all the three schemes.
3. Calculation results
Based on the data sorting and modeling thoughts, 3 global system configuration schemes of CCUS technology under different transportation pipeline conditions are constructed in the scenario of fossil energy continuation, and their whole-process cost distribution and corresponding scale are calculated. The results are compared with different CO2 prices set to evaluate the maximum capacity of carbon reduction achieved by China through CCUS technology in 2060.
3.1. Long-distance off-site storage scheme
This scheme focuses on the geological safety and storage environmental risks, only using the basin resources with the first 2 levels of suitable and relatively suitable storage conditions. These target areas are mainly concentrated in the northern regions. In the southern regions, however, there are scattered suitable storage target areas only in the Sichuan Basin and the Jianghan Basin. Therefore, most of the CO2 in the south needs to be transported to the north for storage. Table 3 lists the model calculation results of 7 regions and the whole country.
Table 3. Predicted data calculated by long-distance off-site storage scheme |
| Regions | Reduction demand*/ 108 t | Reduction scale/108 t | Reduction percentage/% | Highest cost/ (RMB·t−1) | Average cost/ (RMB·t−1) | Off-site transportation | Average distance/ km | ||||
|---|---|---|---|---|---|---|---|---|---|---|---|
| CO2 price 100RMB/t | CO2 price 200RMB/t | CO2 price 300RMB/t | CO2 price 100RMB/t | CO2 price 200RMB/t | CO2 price 300RMB/t | ||||||
| North | 8.34 | 0.93 | 0.99 | 1.30 | 11.15 | 11.87 | 15.54 | 620.94 | 455.48 | No | 736.02 |
| Northeast | 2.04 | 0.46 | 0.50 | 0.50 | 22.49 | 24.50 | 24.50 | 420.94 | 199.00 | No | 341.36 |
| East | 6.24 | 0.61 | 1.22 | 1.22 | 9.86 | 19.54 | 19.54 | 670.94 | 495.75 | Yes | 1 136.23 |
| Central | 3.16 | 0.27 | 0.27 | 0.27 | 8.53 | 8.53 | 8.53 | 460.94 | 387.66 | Yes | 736.02 |
| South | 3.19 | 0.31 | 0.31 | 0.31 | 9.75 | 9.75 | 9.75 | 490.94 | 473.31 | Yes | 726.90 |
| Southwest | 1.65 | 0.54 | 0.54 | 0.77 | 32.57 | 32.57 | 46.49 | 310.94 | 198.04 | No | 264.87 |
| Northwest | 2.71 | 0.72 | 1.22 | 1.84 | 26.71 | 45.04 | 67.96 | 370.94 | 91.05 | No | 248.90 |
| Country | 27.33 | 3.84 | 5.05 | 6.21 | 14.07 | 18.47 | 22.71 | 670.94 | 388.07 | 720.05 | |
*“Reduction demand” is the statistical data. The rest is calculated from the model. |
The calculation results show that the CCUS economic cost of this scheme is relatively high, with an average cost of 388 RMB/t and a maximum of 671 RMB/t. The average transportation distance is 720 km. Captured CO2 of the eastern, central and southern regions need to be transported across regions for storage. When the CO2 price in carbon market is set at 100 RMB/t, 14% of the CO2 in the country is reduced by CCUS, of which only about 10% are in North China, East China, Central China and Southern China. If the price is increased to 300 RMB/t, the percentage is risen to 22%, with the highest in Northwest China (about 68%), and Central China and Southern China less than 10% where storage resources are poorer. Under this scheme, if all CO2 in the country is reduced by CCUS, the CO2 price needs to be set at 671 RMB/t or above. With CO2 price of 600 RMB/t, 72% CO2 (19.8×10⁸ t) in the country will be reduced by CCUS technology.
3.2. Local on-site storage scheme
This scheme simulates the situation of poor cross-regional transportation pipeline conditions, and relies on CO2 storage targets nearby, using storage resources with 3 levels of suitable, relatively suitable and general conditions. Table 4 lists the results of 7 regions and the whole country.
Table 4. Predicted data calculated by local on-site storage scheme |
| Regions | Reduction demand*/ 108 t | Reduction scale/108 t | Reduction percentage/% | Highest cost/ (RMB·t−1) | Average cost/ (RMB·t−1) | Off-site transportation | Average distance/ km | ||||
|---|---|---|---|---|---|---|---|---|---|---|---|
| CO2 price 100RMB/t | CO2 price 200RMB/t | CO2 price 300RMB/t | CO2 price 100RMB/t | CO2 price 200RMB/t | CO2 price 300RMB/t | ||||||
| North | 8.34 | 0.90 | 0.96 | 5.87 | 10.79 | 11.52 | 70.31 | 325.94 | 232.05 | No | 141.47 |
| Northeast | 2.04 | 0.46 | 0.50 | 0.50 | 22.49 | 24.50 | 24.50 | 370.94 | 157.38 | No | 258.11 |
| East | 6.24 | 1.12 | 1.22 | 1.22 | 17.93 | 19.54 | 19.54 | 450.94 | 312.32 | No | 170.69 |
| Central | 3.16 | 0.27 | 0.27 | 2.65 | 8.53 | 8.53 | 83.77 | 325.94 | 240.51 | No | 141.47 |
| South | 3.19 | 0.31 | 0.31 | 0.31 | 9.75 | 9.75 | 9.75 | 570.94 | 474.93 | No | 185.38 |
| Southwest | 1.65 | 0.54 | 0.54 | 0.54 | 32.57 | 32.57 | 32.57 | 340.94 | 200.82 | No | 264.87 |
| Northwest | 2.71 | 1.22 | 1.22 | 2.71 | 45.04 | 45.04 | 100.00 | 295.94 | 31.38 | No | 129.56 |
| Country | 27.33 | 4.82 | 5.02 | 13.80 | 17.62 | 18.36 | 50.47 | 570.94 | 252.31 | 168.22 | |
Note: *“Reduction demand” is the statistical data. The rest is calculated from the model. |
The calculation results show that the CCUS economic cost of this scheme is lower than that of the long-distance off-site storage scheme, with an average cost of 252 RMB/t and a maximum cost of 571 RMB/t. The average transportation distance is 168 km, and all seven regions in the country achieve local storage. When the CO2 price is set at 100 RMB/t, about 18% CO2 in the country is reduced by CCUS, with a lower proportion in North China, Central China and Southern China (about 10%). If the price is increased to 300 RMB/t, half of CO2 in the country is reduced by CCUS, with Northwest China 100%, but Southern China less than 10%. If all CO2 in the country is reduced by CCUS, the CO2 price needs to be set at 571 RMB/t or above. With CO2 price of 500 RMB/t, 90% CO2 (24.6×10⁸ t) in the country will be reduced by CCUS technology.
3.3. On-site and off-site combined storage scheme
This scheme comprehensively considers the optimal economic cost and the suitability of storage targets. It gives priority to the use of storage resources with suitable and relatively suitable conditions, and reasonably selects on-site or off-site storage methods to achieve CO2 storage. Table 5 lists the model calculation results of 7 regions and the whole country.
Table 5. Predicted data calculated by on-site and off-site combined storage scheme |
| Regions | Reduction demand*/ 108 t | Reduction scale/108 t | Reduction percentage/% | Highest cost/ (RMB·t−1) | Average cost/ (RMB·t−1) | Off-site transportation | Average distance/ km | ||||
|---|---|---|---|---|---|---|---|---|---|---|---|
| CO2 price 100RMB/t | CO2 price 200RMB/t | CO2 price 300RMB/t | CO2 price 100RMB/t | CO2 price 200RMB/t | CO2 price 300RMB/t | ||||||
| North | 8.34 | 0.93 | 0.99 | 6.2 | 11.15 | 11.87 | 74.33 | 325.94 | 201.17 | No | 141.47 |
| Northeast | 2.04 | 0.46 | 0.5 | 0.5 | 22.49 | 24.5 | 24.5 | 370.94 | 157.38 | No | 258.11 |
| East | 6.24 | 1.12 | 1.22 | 1.22 | 17.93 | 19.54 | 19.54 | 450.94 | 288.54 | Yes | 379.17 |
| Central | 3.16 | 0.27 | 0.27 | 2.65 | 8.53 | 8.53 | 83.77 | 325.94 | 240.51 | No | 141.47 |
| South | 3.19 | 0.31 | 0.31 | 0.31 | 9.75 | 9.75 | 9.75 | 450.94 | 366.63 | Yes | 546.39 |
| Southwest | 1.65 | 0.54 | 0.54 | 0.44 | 32.57 | 32.57 | 26.49 | 340.94 | 200.82 | No | 264.87 |
| Northwest | 2.71 | 1.22 | 1.22 | 2.71 | 45.04 | 45.04 | 100 | 295.94 | 31.38 | No | 111.23 |
| Country | 27.33 | 4.85 | 5.05 | 14.03 | 17.73 | 18.47 | 51.33 | 450.94 | 224.82 | 256.09 | |
*“Reduction demand” is the statistical data. The rest is calculated from the model. |
The calculation results show that the CCUS economic cost of the scheme is lower than that of both the 2 above schemes, with an average cost of 225 RMB/t and a maximum of 451 RMB/t. The average transportation distance is 256 km. On-site storage can be realized in all regions except East China and Southern China, where cross-regional transportation is needed for CO2 storage.When the CO2 price is set at 100 RMB/t, about 18% CO2 in the country is reduced by CCUS, with a lower proportion in North China, Central China and Southern China (about 10%). If the CO2 price is increased to 300 RMB/t, over half of the CO2 in the country is reduced by CCUS, with Northwest China 100%, but Southern China less than 10%. If all CO2 in the country is reduced by CCUS, the CO2 price needs to be set at 451 RMB/t or above. With CO2 price of 400 RMB/t, 86% CO2 (23.51×10⁸ t) in the country will be reduced by CCUS technology.
3.4. Result comparison and analysis
Each scheme has its advantages and disadvantages, and different requirements for the construction of CO2 transport pipelines. The on-site storage scheme does not require large-scale construction of cross-regional transport pipelines, so its transportation costs are low, but poor storage conditions in some southern regions lead to high storage costs and high environmental risks in the later period. The off-site storage scheme can make full use of geological resources with better storage conditions throughout the country and realize carbon flow optimization and configuration on a national scale, and has low storage costs and low environmental risks in the later period, but it requires support from a relatively complete pipeline network, so it has relatively high transportation costs. The combined on-site and off-site scheme integrates the advantages of the above 2 schemes, comprehensively considers the utilization of high-quality storage resources and the whole-process economic cost, optimizes pipeline topology structure, and realizes global optimal allocation of CO2. Under the scenario of fossil energy continuation, the average whole-process CO2 emission reduction costs of the 3 schemes are 388, 252, and 225 RMB/t respectively. The CO2 prices to cover all the CO2 reduction demand by CCUS in China are 671, 571, and 451 RMB/t respectively, which intuitively reflects the superiority of the combined on-site and off-site scheme from an economic perspective. In addition, due to fewer geological storage resources, poorer conditions and longer transportation distance, the emission reduction costs in the southern regions such as South, East and Southwest China are generally higher than those in the northern regions.
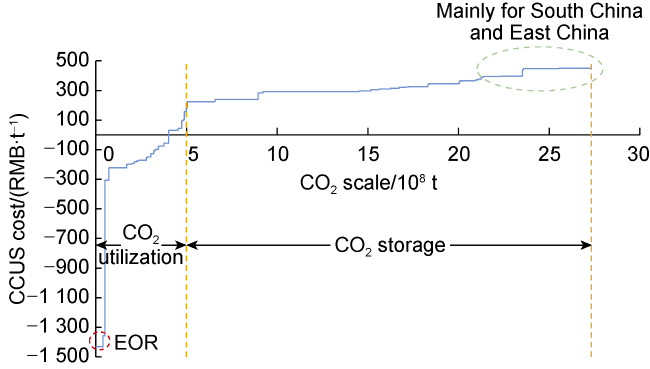
The national CCUS technology cost is distributed in the range of -1432-451 RMB/t, with about 50% distributed around 300 RMB/t (Fig. 4 ). Of the total emission reduction demand of 27×108 t in China, CO2 utilization can consume about 5×10⁸ t, accounting for 18%, and its whole-process cost is generally below 200 RMB/t. CO2 storage processes about 22×108 t, accounting for 82%, and its whole-process cost is above 200 RMB/t. The proportion of biological, chemical and geological utilization is about 1:17:7. Among them, about 4×10⁸ t CO2 utilization creates economic value that exceeds processing costs and achieves benefits, corresponding to the part where the ordinate is less than zero in Fig. 4 , which is the preferred CO2 emission reduction method. Among the three utilization methods, EOR has the best economic benefits, and CCUS whole-process of unit mass CO2 can bring about 1400 RMB/t benefit (as shown by the red dotted line part in Fig. 4 expressed as a negative value from a cost perspective). Onshore saline aquifer storage is the main method of CO2 geological storage. It processes about 21×108 t CO2, which accounts for more than 76% of total emission reduction demand. The whole-process cost of storage part is generally higher than that of utilization part. South China and East China have higher storage costs than other regions due to their large CO2 emissions and scarce storage resources. An analysis of the composition ratio of storage costs shows that for on-site storage part, capture costs and transportation + storage costs are approximately equal; while for cross-regional storage part, transportation costs increase significantly with a ratio of approximately 1:2.
Fig. 4. Cost-scale curve of CO2 emission reduction by CCUS in China in 2060. |
Different regions have their own characteristics in terms of emission reduction demands and geological conditions. (1) The South and East China need to transport CO2 to the storage target areas in Central China, and the transportation cost is high. (2) The Northwest China has abundant storage resources, but the storage demand is small. Also, due to the long distance of the storage target area (concentrated in Xinjiang) from other capture locations, it is difficult to provide storage support to other regions. (3) Northeast, North, Central, and Southwest China can basically realize local storage. Taking the East China with high emission reduction demand as an example, the local biological and chemical utilization potentials are 0.64×10⁸ t and 1.15×10⁸ t respectively, and there are no geological utilization conditions. Among them, 1.12×10⁸ t of utilization can achieve benefits (Fig. 3 ). The adjacent Jianghan Basin in Central China has suitable geological storage conditions and low environmental risks, and CO2 can be transported by pipeline at a cost of about 400 RMB/t to realize about 3×10⁸ t saline aquifer storage. Secondly, CO2 can be transported to the North Jiangsu-South Yellow Sea Basin with general geological storage conditions to realize about 2×10⁸ t saline aquifer storage at a cost of about 450 RMB/t.
3.5. Cost sensitivity analysis
In the whole process of CCUS, the capture and transportation links are pure cost links, and the utilization/storage link is potentially profitable link. Taking the on-site and off-site combined storage scheme as an example, cost sensitivity analysis is carried out without considering the effects of subsidies and carbon taxes.
The cost difference of the capture and transportation links is small for different scenarios and methods, and the total cost is 148-341 RMB/t. The cost of the capture link is 73-171 RMB/t, with an average cost of 123-151 RMB/t in each region, a national average cost of 140 RMB/t, and a standard deviation of 37 RMB/t. The transportation cost is distributed between 75 and 200 RMB/t, with an average cost of 75-170 RMB/t in each region, a national average cost of 109 RMB/t, and a standard deviation of 50 RMB/t. Transportation costs are mainly affected by local and remote factors. Local utilization or storage mainly uses tank trucks or small-scale pipelines for transportation, with transportation costs basically around 80 RMB/t. Remote transportation mainly uses pipeline with costs generally exceeding 150 RMB/t.
The cost (benefit) difference of the utilization/storage link is large, ranging from −1580 RMB/t to 80 RMB/t. CO2 utilization can bring profits, but different utilization methods have large differences in profits. The profit generated per unit mass of CO2 ranges from 7 RMB/t to 1580 RMB/t. CO2 storage is an investment link with a cost distribution range of 35-80 RMB/t. The total difference of utilization/storage links is larger. Its national average cost is −24 RMB/t (that is, the link is profitable after all), and the standard deviation is as high as 435 RMB/t. Among them, the standard deviation of CO2 utilization methods is as high as 453 RMB/t.
In summary, the main cost-influencing link in the entire CCUS process is the utilization/storage link, especially CO2 utilization. The potential for high-value-added utilization methods is great, the overall economic value of the CCUS industry is high.
4. Model application
4.1. CCUS industry development suggestion
(1) Develop chemical utilization related industries based on P2X technology. CO2 utilization is the only profitable technology among all CCUS links, among which chemical utilization is the field with the greatest development potential, but it needs to transform traditional chemical industry based on fossil energy into P2X industry based on clean energy [26]. China is the world's largest CO2 emitter, as well as the largest country in power generation fields including hydropower, wind power, solar power, and biomass [37], with sufficient CO2 resources and clean energy [38]. P2X technology uses clean electricity to produce hydrogen, which is then chemically combined with CO2 to prepare fuels and raw materials, realizing the production of high value-added industrial products while reducing CO2 emissions [38]. It is suggested to encourage R&D of key technologies such as electric hydrogen production and electrochemistry, and explore win-win commercial models for electrochemical related industries involving power generation, transmission, chemical industry and CCUS. Enterprises and institutes are encouraged to actively participate and invest to form P2X industrialization technological conditions by 2030 and promote its application in the post-peak phase after 2030, which enhances the cost competitiveness and builds good investment ecology of CCUS industry.
(2) Plan a CCUS industrial cluster in the Jianghan Basin and its surrounding areas. Building an industrial cluster after 2030 is a national long-term development plan of CCUS industry, which can reduce costs and improve emission reduction benefits [4-5,9]. Model results show that both East and South China are regions with high emission reduction demand and scarce storage resources. The Jianghan Basin is located at the junction of these two regions with certain storage potential [23] and traditional chemical industry foundation [27⇓-29], which can provide storage and utilization conditions for Yangtze River Delta and Pearl River Delta regions. It is suggested to carry out relevant industrial layout and infrastructure planning before 2030, enters into the implementation construction stage after carbon peak, and coordinate and complement different links of CCUS between different regions, which will give full play to regional advantages.
(3) Explore multi-party collaborative win-win business cooperation models. The CCUS industry chain is long involving many industries. Cross-border cooperation between industries such as petroleum, chemical industry, energy, construction, is an inevitable trend. At present, commercial development of CCUS technology is still in its early stage [9], requiring policy guidance to explore and construct healthy and benign commercial cooperation models, attract multi-party investment, improve operation efficiency and reduce docking costs. It is suggested to guide and support demonstration projects landing and commercial model exploration through policy support and funding support before 2030. After accumulating certain operation experience by 2030, promote application on a large scale and form a benign operating investment profit environment to support CCUS industrialization and large-scale development.
4.2. CO2 pipeline preliminary planning in 2060
Based on the model calculation results, in the scenario of fossil energy continuation, about 80% of China's CO2 needs to be stored in onshore saline aquifers to realize emission reduction, so it is necessary to search for suitable storage targets. The geological storage potential screening indicates that areas with better saline aquifer storage conditions are mainly concentrated in northern regions such as Inner Mongolia, Xinjiang and Heilongjiang [9,18,23⇓ -25], while areas with developed industry, dense population and large emission reduction demand are mainly concentrated in South China and East China [9,22]. Storage targets and CO2 sources show a trend of deviation in space, so China's large-scale CO2 transportation demand generally shows a trend from south to north. In addition, although there are storage targets with relatively suitable conditions within some regions such as Northwest, North and Northeast China, industrial agglomeration areas with large CO2 emission demand are often far from storage targets, so it is necessary to construct transportation pipelines within the regions to realize CO2 storage.
Based on the paths with larger-scale CO2 transportation demand in the on-site and off-site combined storage scheme, the 2060 CO2 transportation pipeline paths are selected to meet the global optimization allocation needs. The main pipeline paths include Guangdong-Jiangxi, Yunnan-Sichuan-Chongqing, Shanghai-Zhejiang-Jiangxi- Hunan-Guangxi, Shanxi-Shanxi-Inner Mongolia, Shandong-Hebei-Beijing, Hebei-Liaoning-Jilin-Heilongjiang.
4.3. Cost of CCUS based thermal power
In the scenario of fossil energy continuation, the national CO2 capture demand of coal-fired power industry reaches 9.5×10⁸ t, including 0.5×10⁸, 8.5×10⁸ and 0.5×10⁸ t for pre-combustion capture, post-combustion capture, and oxygen-enriched combustion capture, respectively. China's thermal power generation is mainly based on coal combustion (also known as coal-fired power generation), and its CCUS average cost is calculated by summing the average CO2 capture cost of thermal power and the whole-society average cost of transportation and utilization/storage links. The average CO2 capture cost of thermal power is 126 RMB/t (it is the weighted average cost of three capture methods of thermal power, and the capture link is not influenced by the scheme selection). The whole-society average cost of transportation and utilization/storage links is the weighted average of total costs of transportation and utilization/storage links in 7 regions (different schemes have different costs). The calculation results show that in 3 three schemes, the CCUS average cost of coal-fired power generation is 365, 231, and 203 RMB/t respectively, and correspondingly the increase in electricity price is about 0.29, 0.18, and 0.16 RMB/(kW·h) (based on the CO2 emission intensity of coal-fired power generation: 890 g/(kW·h) [39]). In southern China, great CO2 capture demand and poor storage conditions makes its economic cost the highest of 7 regions, which reaches 460, 460, and 352 RMB/t respectively in all 3 schemes, corresponding to an increase in electricity price of 0.36, 0.36, and 0.28 RMB/(kW·h). In Northwest China, the capture demand is small, the economic cost is low, and there are abundant local storage target areas with suitable conditions, so on-site storage is adopted in 3 schemes, and the economic cost is as low as 34 RMB/t with a corresponding increase in electricity price of only 0.03 RMB/(kW·h). Due to its resource endowment characteristics, China's natural gas power generation scale is small. If gas power generation is developed in the future, it is expected that its CCUS cost in 2060 will be about 247 RMB/t with a corresponding increase in electricity price of about 0.10 RMB/(kW·h) (based on CO2 emission intensity of gas power generation: 390 g/(kW·h) [38]).
Among 3 schemes, the long-distance off-site storage scheme has higher CCUS cost of coal-fired power generation, and the cost of the local on-site storage scheme is basically the same as that of the on-site and off-site combined storage scheme, which are 0.18 and 0.16 RMB/(kW·h), respectively. The local on-site storage scheme makes more use of salt aquifer resources with poorer storage conditions in the southern regions, which may bring the risk of CO2 leakage. What's more, the maximum cost in local on-site storage scheme is higher, and the national cost variance is larger, so the carbon price for carbon neutrality completely by CCUS is be higher. Therefore, form the perspective of emission reduction of coal-fired power generation, it is recommended to adopt the on-site and off-site combined storage scheme for CCUS technology.
As the national transmission pipeline system is completed, the CO2 emission reduction cost of coal-fired power generation based on CCUS can be controlled at 0.16 RMB/(kW·h), and its LCOE (Levelized Cost of Energy) is expected as 0.6 RMB/(kW·h).
5. Conclusions
Based on the CCUS technology development progress, CO2 capture demand and geological resource conditions, the economic costs and potentials of the three main links of capture, transportation and utilization/storage were sorted out and predicted. A cost-scale calculation model for China's CCUS technology in 2060 was constructed, 3 storage scheduling schemes were compared and the on-site and off-site combined storage scheme was recommended. The maximum capacity of CO2 emission reduction by CCUS in China during the carbon-neutral stage was evaluated, and suggestions were made for the main pipeline. The emission reduction cost of coal-fired power generation based on CCUS technology was predicted and analyzed.
It is predicted that in the scenario of fossil energy continuation, the CO2 emission demand of in China will be 27×108 t in 2060 [22]. If carbon neutrality is realized completely by CCUS technology, about 5×10⁸ t is processed by CO2 utilization and 22×108 t by CO2 geological storage. The whole-process cost by utilization is distributed from −1400 RMB/t to 200 RMB/t (negative value indicates that the economic benefits generated by CO2 utilization exceed the cost of capture and transportation, and overall economic benefits are generated), and the whole-process cost by geological storage is distributed from 200 RMB/t to 450 RMB/t.
When CO2 prices are set at 100, 200, 300, 400, and 450 RMB/t respectively, national CO2 emission will achieve 18%, 18%, 51%, 86%, and 100% active reduction.
Based on the distribution of geological storage demand in the future, the main pipelines for CO2 transportation in 2060 are mainly distributed longitudinally from south to north. The main pipeline paths include Guangdong- Jiangxi, Yunnan-Sichuan-Chongqing, Shanghai-Zhejiang- Jiangxi-Hunan-Guangxi, Shanxi-Shanxi-Inner Mongolia, Shandong-Hebei-Beijing, and Hebei-Liaoning-Jilin-Heilongjiang.
In the scenario of fossil energy continuation, the coal-fired power industry has a CO2 capture demand of 9.5×10⁸ t. The average CCUS cost with CO2 global optimization configuration nationwide is 203 RMB/t, corresponding to an increase in LCOE of 0.16 RMB/(kW·h).
Overall, it is recommended that policy makers and financial investment institutions pay more attention to CCUS technology, strengthen policy guidance and investment efforts, and increase investment in basic infrastructure such as CO2 transmission pipeline networks, so as to form the scale effect as soon as possible to reduce the costs. The research institutions and production enterprises are suggested to increase research investment and participate in CCUS project demonstration and construction actively, so as to improve the technological maturity and reduce the economic costs. All parties are mobilized to carry out carbon-neutral path research together and support the realization of China's “dual-carbon” goal through comparative analysis and coordinated development of various emission reduction paths.
Nomenclature
fc(x)—the cost of CO2 capture per unit mass when the CO2 scale reaches x, RMB/t;
fsu(x)—the cost of CO2 storage or utilization per unit mass when the CO2 scale reaches x, RMB/t;
ft(x)—the cost of CO2 transportation per unit mass when the CO2 scale reaches x, RMB/t;
Pc—the cost of CO2 capture per unit mass, RMB/t;
Psu—the cost of CO2 utilization/storage per unit mass, RMB/t;
Pt—the cost of CO2 transportation per unit mass, RMB/t;
Ptsu—the cost of CO2 transportation + utilization/storage per unit mass, RMB/t;
Ptotal—the whole-process cost of CO2 per unit mass, RMB/t;
x—the cumulative scale of CO2 emission reduction by CCUS, 108 t.