

Introduction
Exploration has shown that a saline sedimentary environment is conducive to the formation of high-quality source rocks, and multiple sets of source rocks related to the saline environment have been identified globally [1-2]. The saline environment has two favorable factors for organic matter enrichment. On the one hand, saline lacustrine basins usually contain abundant nutrients, which promote the proliferation of aquatic organisms, resulting in higher biological productivity. Studies on the productivity of modern lakes have found that saline lakes often have higher productivity than freshwater ones [3].On the other hand, saline lacustrine basins have better conditions for the preservation of organic matters. The saline environment is propitious to salinity stratification, and the anoxic reducing environment is formed below the halocline, where the organic matter is not decomposed easily and preserved well. In this case, highly organic-rich source rocks are formed. The Paleogene Green River Shale in North America, for example, is a set of lacustrine shales formed in a saline environment, and is characterized by extremely high organic matter abundance and relatively low maturity. It is one of important research objects for hydrocarbon generation kinetics [4⇓-6]. In China, the source rocks of saline lacustrine basin facies have also been identified in multiple basins, including the Paleogene Qianjiang Formation in the Jianghan Basin [7], the fourth and third members of the Shahejie Formation in the Dongpu Depression of the Bohai Bay Basin [8], and the fourth member of the Shahejie Formation in the Jiyang Sag [9]. The Mahu Sag in the Junggar Basin also develops a set of source rocks in the saline environment, which is considered as the alkaline lacustrine source rocks due to the high alkaline mineral content [10-11]. These source rocks generally have high organic matter abundance, with TOC values generally above 2%, and are classified as high-quality source rocks. The upper member of the Lower Ganchaigou Formation and the Upper Ganchaigou Formation in the Western Qaidam Depression [12⇓-14] have lower TOC values than those in other saline lacustrine basins, typically ranging from 0.5% to 2.0%, with an average value of about 0.9%.
According to the geological understanding that hydrocarbon accumulations are under the control of source rocks, the source rocks with high organic matter abundance are essential for the formation of oil and gas reservoirs, for they provide material basis for hydrocarbon accumulation. The Paleogene organic matter abundance in the Western Qaidam Depression is lower than those in other continental lacustrine basins. However, exploration practice has proven that the Western Qaidam Depression is quite rich in oil and gas resources, with OOIP exceeding 20×108 t. In addition, several blocks with reserves over one hundred million tons have been discovered there, covering over 70% of the oil reserves and production in the Qaidam Basin. The abundance of proven oil reserves exceeds 170×104 t/km2 [15⇓-17]. Moreover, significant achievements have been made in the exploration of shale oil in the Yingxiongling area, and high-yield oil and gas flows have been obtained in several wells in the Ganchaigou area [18]. Due to the lack of large-scale migration and accumulation processes, shale oil and gas often require higher organic matter abundance [19⇓⇓-22]. So far, no massive high-TOC source rocks have been found in the Qaidam Basin, but significant conventional and unconventional oil and gas accumulations have been discovered. The unique sedimentrary environment, hydrocarbon-generating parent material, and hydrocarbon generation mechanism in the Western Qaidam Depression are the key factors leading to the inconsistency between low organic matter abundance and high oil and gas resource abundance. Through organic and inorganic geochemical analyses, this paper explored the types of hydrocarbon-generating parent materials, and clarified the reasons for the low organic matter abundance and the hydrocarbon generation model in the Western Qaidam Depression. The results aim to provide a scientific basis for objectively evaluating the organic matter abundance and hydrocarbon generating potential in the Wester Qaidam Depression, and also to provide guidance for conventional and unconventional oil and gas exploration.
1. Geological background for the development of saline lacustrine source rocks
The Qaidam Basin is located in the Qinghai-Tibet Plateau, with an average altitude of 3000 m. It is a large inland intermontane basin that developed in the pre-Jurassic block during the Mesozoic and Cenozoic periods. It has undergone three stages of structural evolution: early faulting, middle depression, and late sedimentary center moving. The Qaidam Basin has three sets of source rocks: the Middle-Lower Jurassic swamp facies source rocks of freshwater lake, the Paleogene saline lacustrine facies source rocks, and the Quaternary source rocks of biogenic gas are developed, forming three major oil and gas systems: gas system in the Northern Qaidam fault depression, oil system in the Western Qaidam Depression, and biogenic gas system in the Sanhu Depression of Eastern Qaidam Basin.
The saline lacustrine source rocks are mainly distributed in the Western Qaidam Depression, which is located to the south of the Kunlun Mountains and the west of the Altun Mountains (Fig. 1a ). The depression lacustrine basin is formed in the Mesozoic-Cenozoic tectonic compression background. The Yingxiongling structural belt is situated in the western part of the Mangya Sag of the Western Qaidam Depression. Although it currently appears as a positive structure, it was a negative structure during the depositional period of E32, which contributed to the development of source rocks, and the Ganchaigou area serves as the main exploration target for shale oil in the Yingxiongling area [18] (Fig. 1b ). In this area, the Lulehe Formation (E1+2) and Lower Ganchaigou Formation (E3) of the Paleogene, and the Upper Ganchaigou Formation (N1), Lower Youshashan Formation (N21), Upper Youshanshan Formation (N22), Shizigou Formation (N23), and Qigequan Formation (Q) of the Neogene are mainly developed. The Lower Ganchaigou Formation is further divided into the lower member (E31) and the upper member (E32). The E32 is considered as the main source rock within the Western Qaidam Depression, as well as the primary target for shale oil exploration in the Yingxiongling area, which is the focus of this study. In the Northwestern Qaidam, a small amount of source rocks are developed locally in the N1 and N21. They were not discussed in detail in this study due to their relatively limited distribution and very low organic matter abundance (Fig. 1c ).
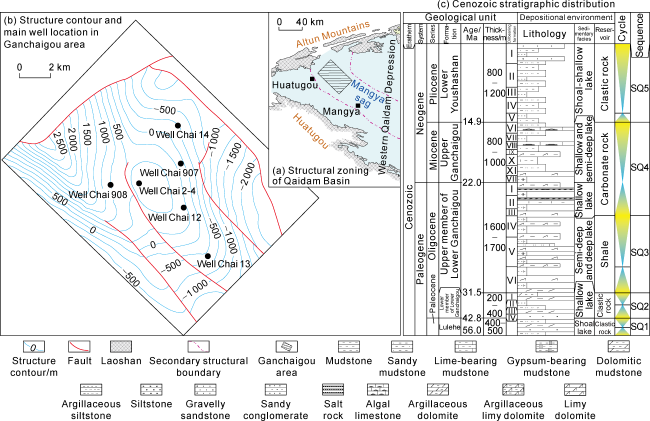
Fig. 1. Structural division and Cenozoic stratigraphic distribution in the Qaidam Basin (modified from Ref. [20]). |
The evolution of the Qaidam Basin is closely related to the uplifting of the Qinghai-Tibet Plateau. With the collision between the Indian Plate and the Eurasian Plate, the Altyn Tagh Fault underwent left-lateral strike-slip movement since the Eocene, gradually shifting the sedimentary center of the basin towards the northeast [16]. During the Paleogene period, the Southwestern Qaidam was a sag under an extensional tectonic background, where the upper member of the Lower Ganchaigou Formation was deposited with a thickness of nearly 1000 m. In the Miocene period, the basin center moved to the northwest, and the Upper Ganchaigou Formation-Shizigou Formation with a thickness over 1000 m was deposited in the Northwestern Qaidam. In the Quaternary period, the basin center further migrated to the Eastern Qaidam, and the thick Quaternary strata were deposited.
The structural evolution analysis reveals that the Western Qaidam Depression experienced a depositional cycle from lowstand systems tract to highstand systems tract during the Paleogene period. During the early depositional period of the Lower Ganchaigou Formation, the Western Qaidam Depression was in the background of shallow- water lacustrine facies, and it was cut into several sub- sags. In the depositional period of the upper member of the Lower Ganchaigou Formation, the paleo-climate changed relatively warm and humid with increased rainfall, leading to a rapid rise in lacustrine level and expansion of the lacustrine basin. This resulted in the development of a mixed saline lacustrine sedimentary system dominated by carbonate and clastic rocks, which is conductive to the formation of lacustrine source rocks (Fig. 2 ).
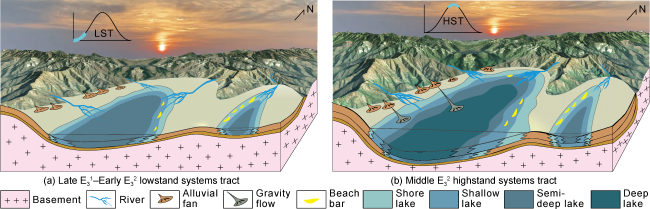
Fig. 2. Sedimentary model of the Paleogene Lower Ganchaigou Formation in Yingxiongling-Xiaoliangshan Sag, Western Qaidam Depression. |
2. Organic matter abundance and hydrocarbon- generating parent materials of source rocks in the Western Qaidam Depression
2.1. Organic matter abundance
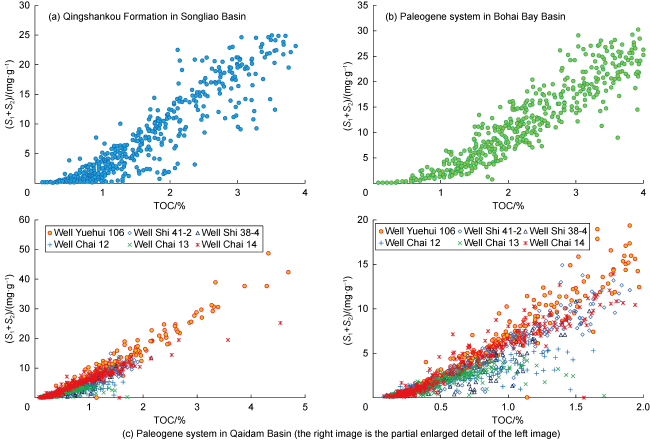
One of the most distinct characteristics that the saline lacustrine source rocks of the Qaidam Basin possess is their relatively low TOC content. Compared with typical lacustrine source rocks both domestically and internationally, the source rocks in the Qaidam Basin are almost the lowest in TOC value (Table 1 ). The TOC values of the Paleogene Green River Shale in North America generally range from 5% to 10%, reaching up to 20% [4⇓-6]. The major source rocks in China's main continental hydrocarbon-bearing basins have higher TOC values. For example, in the Songliao Basin in Northeast China, the TOC values of the Cretaceous Qingshankou Formation typically range from 1% to 4% [23-24], while those of the Nenjiang Formation are mostly above 3% [25]. In the Bohai Bay Basin, the TOC values of the 4th Member of the Shahejie Formation are generally above 2%, and the black shale of the 2nd Member of the Kongdian Formation in the Cangdong Sag have the TOC values generally above 2%, reaching up to 12% [26]. In the Ordos Basin, the TOC values of mudstone in the 7th Member of the Yanchang Formation are mostly above 2%, while those of oil shales are mostly above 6%, reaching up to 30% [27]. Considering the TOC values of saline lacustrine source rocks of the Qaidam Basin are relatively low, some scholars proposed that other parameters should be used as evaluation indexes for the organic matter abundance of source rock instead of TOC[12]. To verify the effectiveness of TOC as an indicator of organic matter abundance, this study investigated the relationship between TOC values and hydrocarbon generating potential (S1+S2). The latter reflects the quantity of oil and gas generated per unit of rock under the thermal action, directly indicating the rock's hydrocarbon-generating capacity. The results show that, similar to other basins, the Qaidam Basin also exhibits a good linear relationship between TOC and (S1+S2), indicating that TOC can still be used as an indicator for evaluating organic matter abundance (Fig. 3 ). It should be noted that the slope of the Paleogene source rocks in the Qaidam Basin (approximately 10 mg/g) is higher than those in other basins (5-8 mg/g), reflecting a relatively higher hydrogen content in the organic matter and a greater hydrocarbon generating potential per unit of organic carbon.
Table 1. Organic matter abundance of source rocks in typical lacustrine basins in China and abroad (modified from Refs. [7⇓⇓⇓⇓⇓⇓⇓⇓-16]) |
| Basin | Formation | Sedimentary environment | Lithology | Thickness/ m | TOC/% | HI/ (mg•g-1) | Kerogen type | Ro /% |
|---|---|---|---|---|---|---|---|---|
| Qaidam | Upper member of Lower Ganchaigou Formation of Paleogene | Saline-water lacustrine basin | Dolomitic- calcareous shale | 200-800 | 0.5-2.0 | 600-800 | I, II1 | 0.6-1.3 |
| Songliao | Qingshankou Formation of Cretaceous | Fresh-water - light saline- water lacustrine basin | Shale | 50-150 | 1.0-4.0 | 600-800 | I, II1 | 0.7-1.6 |
| Bohai Bay | Shahejie and Kongdian Formation of Paleogene | Fresh-water - light saline-water lacustrine basin | Shale | 50-300 | 1.5-12.0 | 500-600 | II1 dominantly | 0.6-1.3 |
| Ordos | 7th member of Yanchang Formation of Triassic | Fresh-water lacustrine basin | Shale | 30-70 | 2.0-30.0 | 400-500 | II1 | 0.8-1.2 |
| Junggar | Fengcheng Formation of Permian | Alkaline lacustrine basin | Dolomite-bearing limy shale | 50-100 | 0.5-3.0 | 400-600 | II1 dominantly | 0.8-1.4 |
| Lucaogou Formation of Permian | Brackish-water lake basin | Dolomitic- calcareous shale | 100-200 | 2.0-9.0 | 500-800 | I, II1 | 0.7-1.1 | |
| Santanghu | Lucaogou Formation of Permian | Brackish-water lake basin | Dolomitic- calcareous shale | 30-100 | 2.0-8.0 | 400-700 | II, II1 | 0.6-1.1 |
| Sichuan | Lianggaoshan and Ziliujing Formations of Jurassic | Fresh-water lacustrine basin | Shale | 30-200 | 0.5-2.0 | 400-600 | II1 | 0.9-1.5 |
| Northern Jiangsu | Funing Formation of Paleogene | Fresh-water - light saline lacustrine basin | Shale | 30-200 | 0.5-4.0 | 500-600 | II1 dominantly | 0.6-1.3 |
| Jianghan | Qianjiang and Xingouzui Formations of Paleogene | Saline lacustrine basin | Shale | 20-70 | 0.5-3.0 | 500-600 | I, II1 | 0.4-1.0 |
| Williston | Bakken | Marine | Shale | 10-20 | 10.0-14.0 | 500-600 | II1 | 0.7-1.2 |
| South Texas | Eagles Ford | Marine | Marl | 20-60 | 4.0-7.0 | 500-600 | II1 | 0.7-1.5 |
2.2. Type of hydrocarbon generating parent material
The characteristic molecular compounds in hydrocarbons are important indicators reflecting the source, type, and preservation conditions of hydrocarbon generating parent material. Previous studies have found that the n-alkanes in the low-maturity source rocks of the Western Qaidam Depression exhibit a bimodal distribution in gas chromatogram, including odd-carbon number predominance pattern within the range of C11-C17 and even-carbon number predominance pattern within the range of C18-C28, suggesting that organic matter may come from multiple sources [29]. The C11-C17 alkanes with odd-to-even predominance are believed to be directly derived from hydrocarbons in algae, referred to as "soluble organic matter" in low maturity source rocks in previous studies [30], while the existence of C11-C17 alkanes with even-to-odd predominance is considered as a common feature of organic matter in saline environments [31].
Due to the severe volatilization of light components resulted by the long storage time, the samples from Ganchaigou area analyzed in this study show a relatively low abundance of C11-C17, but still have distinct even-carbon number predominance pattern in C18-C28 (Fig. 4 ), indicating significant contributions to oil and gas formation from aquatic organisms preserved in saline environments.
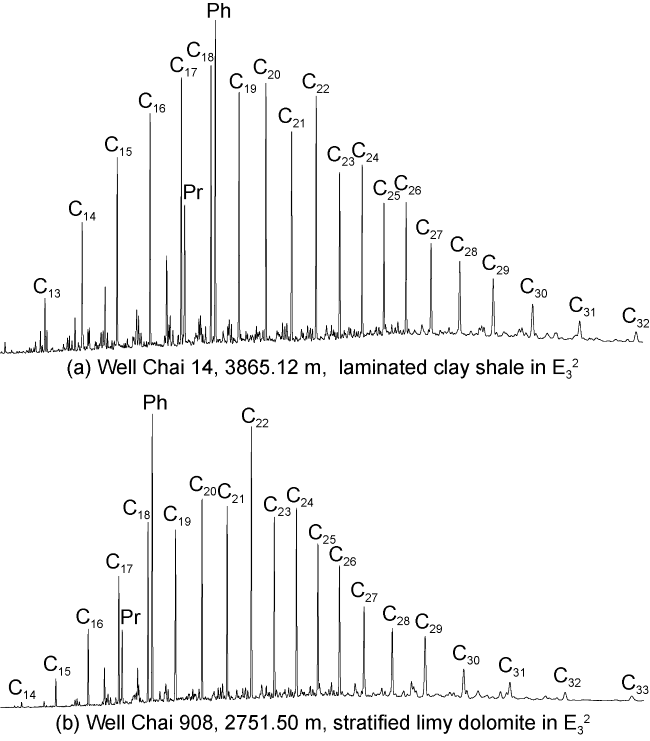
Fig. 4. Gas chromatogram of saturated hydrocarbons of Paleogene saline lacustrine source rocks of Qaidam Basin. |
The extracts from the Paleogene source rocks in the Qaidam Basin show a high content of isoprenoids, an obvious dominance of phytane (Ph) and a low pristane (Pr) to phytane ratio (Pr/Ph), indicating the source rocks are the products of a strong reducing sedimentary environment. As shown by Fig. 4 , the source rocks have a high content of Ph, which is even higher than that of the adjacent n-alkanes (nC18), and a high content of Pristane, which is much lower than Ph. The Pr/Ph ratio is generally less than 0.5, indicating the typical characteristics of organic matter in saline environments. Both Pr/nC17 and Ph/nC18 ratios are higher than 0.2, and Ph/nC18 ratio exceeds 1 in most of the samples, reaching as high as 4, which significantly differ from the freshwater lacustrine source rocks (Fig. 5 ). Due to the high water salinity, water stratification is formed, creating a halocline that inhibits vertical convection. It results in sustained hypoxic conditions at the bottom of the water and in the sediments due to microbial chemical action of deposited organic matter, maintaining a strong reducing environment.
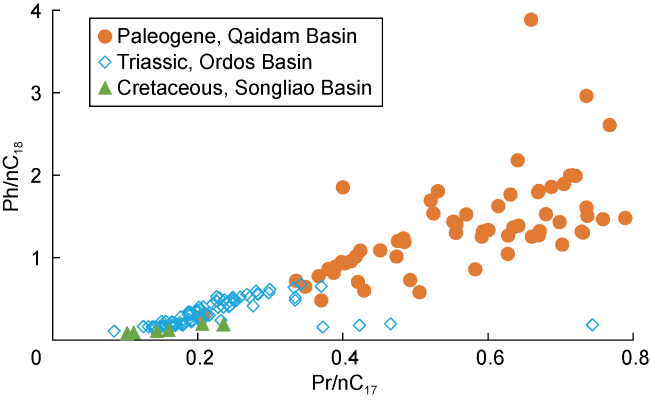
Fig. 5. Pr/nC17 vs. Ph/nC18 plot of source rocks in different basins. |
In the GC-MS chromatogram of the saturated hydrocarbons, sterane biomarkers (m/z=217) are distributed in “V” shape characterized by C27ααR>C29ααR>C28ααR or “L” shape characterized by C27ααR>C28αR>C29αα, indicating that the parent materials are primarily derived from aquatic organisms, with little contribution from higher plants. The high abundance of C28ααR steranes indicates high water salinity [31] (Fig. 6 ). The terpane biomarkers (m/z=191) have a significantly higher content of gammacerane than C31 hopanes whose peak is next to peak gammacerane, and even higher than C30 hopanes sometimes. The contents of C34 and C35 hopanes are also high, with a distribution pattern of C35 hopanes > C34 hopanes > C33 hopanes. The high gammacerane content and high contents of C34 and C35 hopanes reflect a high salinity sedimentary environment, which is consistent with the results indicated by the high contents of Ph and C28ααR steranes [31] (Fig. 6 ).
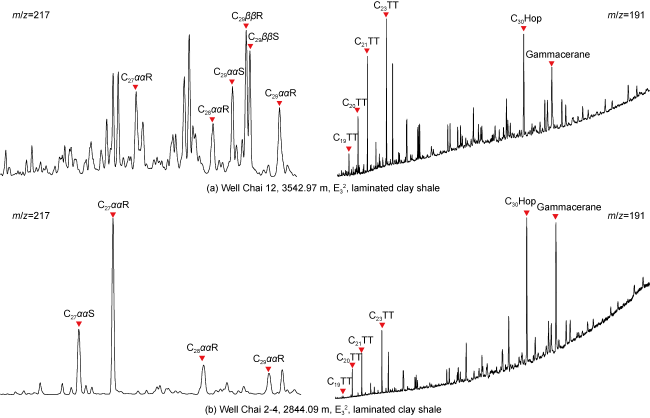
Fig. 6. Gas chromatogram of saturated hydrocarbons in the extracts of source rock. |
Among aromatic hydrocarbon biomarkers, aryl isoprenoid hydrocarbons are exclusive in indicating the depositional environment of organic matter. Abundant aryl isoprenoid hydrocarbons often reveal the modifications of organic matter by green sulfur bacteria or purple sulfur bacteria. They are mainly distributed in anoxic euphotic zones, suggesting that organic matter is formed in shallow but anoxic reducing environments [32-33]. Abundant aryl isoprenoid hydrocarbons are detected in both source rocks and crude oils in the Western Qaidam area (Fig. 7 ), indicating a relatively shallow and extremely undisturbed depositional environment with slow input of terrestrial freshwater and sediment, which is consistent with the high salinity reducing environment and less input of terrigenous clasts and organic matter in this area.
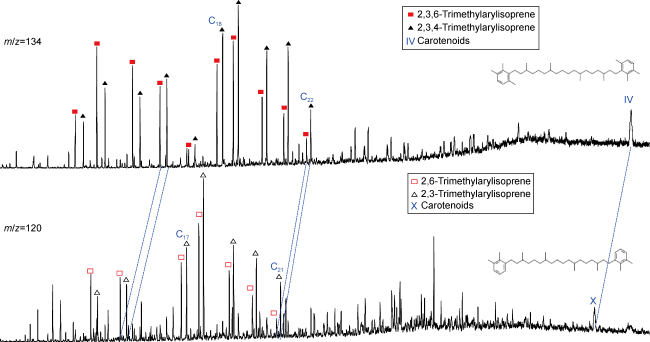
Fig. 7. Aromatic hydrocarbon biomarkers in the laminated clay shale of E32 at the depth of 3865.33 m in Well Chai 14. |
3. Factors causing relatively low TOC values in the saline lacustrine basin of Qaidam Basin
The enrichment of organic matter is primarily controlled by multiple factors such as biological productivity, preservation conditions, and sedimentation rate. The depositional environment in the saline lacustrine basin of the Western Qaidam Depression is highly favorable for organic matter preservation, while relatively low biological productivity, rapid burial, and early hydrocarbon generation all result in low TOC values.
3.1. Relatively poor nutrient supply inhibits algal blooms
Although the saline lacustrine basins genearlly have high biological productivity, the mechanism behind this is that the formation process of a saline lacustrine basin can bring abundant nutrients. Previous studies have reported that geological processes such as volcanism, hydrothermal activity, and transgression are important causes of salinization in lacustrine basins [34⇓⇓-37]. These geological processes bring rich nutrients to the lake, leading to the development of aquatic organism blooms and enormous biological productivity. In the strong reducing saline water, organic matter is rapidly preserved, forming high-quality source rocks. For example, in the organic-rich source rocks of the Triassic Chang 7 Member in the Ordos Basin, volcano is believed to have played a significant role. Multiple layers of volcanic ash in the Chang-7 Member provided abundant nutrients for algal proliferation [34]. The high organic matter abundance of the Permian Lucaogou Formation source rocks in the Junggar Basin is mainly the result of intense hydrothermal activity. The hydrothermal fluids bring abundant nutrients, which promote algal blooms in the lake, forming organic-rich source rocks [35]. In the offshore Bohai Bay and Songliao basins, the formation of highly organic-rich source rocks is believed to be related to sea transgression. The sea water brings abundant nutrients, facilitating rapid algal blooms [36-37].
The previous studies suggested the saline lacustrine basin in the Qaidam Basin is primarily caused by strong evaporation, without apparent evidence showing its relevance to volcanic or hydrothermal activity. In-depth analysis [38⇓-40] was carried out on the formation of carbonate rocks in the Western Qaidam Basin, which suggested the carbonate rocks in the Western Qaidam Basin are the product of low-temperature underwater concentration and crystallization process. They were formed in a continental closed environment with intense evaporation, where the salt materials were carried by surface water from the land rather than deep hydrothermal brines. Calcareous nannofossils have been discovered in the sediments of the continental saline lacustrine basin of the Qaidam Basin. However, due to their low abundance, small numbers and low species diversity, Sun et al. believed that it is not appropriate to use calcareous nannofossils as a general indicator of marine or transitional source rocks [40]. Tectonic evolution analysis indicated that the Qinghai-Tibet Plateau had began to uplift during the Paleogene period, so the Qaidam Basin was located at high latitude and high altitude, far away from rivers, resulting in a relatively low input of terrestrial nutrients.
This was proved by the analysis of inorganic elements in the source rocks [14]. The results showed that elements associated with terrestrial clastic input, such as Al and Si, have significantly low content, while elements such as Ca and Mg show significantly higher contents, reflecting that the contents of P, Fe and other nutrient elements in the water are much lower than those in the sediments of freshwater basin deposits like the Triassic in the Ordos Basin [34], and also lower than those in the Paleogene Shahejie Formation in the Bohai Bay Basin [26]. This is the main reason of a lower organic matter abundance of the source rocks in this area than that in the eastern saline lacustrine basins (such as the Sha 4 Member of the Bohai Bay Basin).
Furthermore, the formation of saline lacustrine source rocks of the Qaidam Basin can be compared to the present-day Qinghai lacustrine [41]. Qinghai Lake is the largest inland saline lake in China, with a salinity of about 15‰. Detailed investigations on Qinghai Lake revealed that aquatic organisms are not abundant, and the types and quantities of organic matter are relatively limited. The TOC values in its muddy bottoms are generally about 1%, and algal laminations are rarely observed. If the source rocks experienced later burial and sedimentation processes, the organic matter abundance can not be too high.
3.2. High deposition rate leads to the dilution of organic matter abundance
Cyclostratigraphy is widely utilized in sequence stratigraphic division and correlation due to its high time precision, and has played an important role in the study of sedimentation rates of lacustrine source rock in recent years. Through lithological assemblage identification, spectral analysis, wavelet analysis, filtering and tuning processing, Milankovitch cycles are identified, and high-precision cyclostratigraphic frameworks are established to determine the time cycles and sedimentation rates of fine-grained sedimentary rocks [42]. An investigation on lacustrine mudstones in the 4th Member of the Shahejie Formation of the Dongying Depression of the Bohai Bay Basin by Peng et al.[43] revealed 0.40 Ma long eccentricity cycle, 0.12 Ma short eccentricity cycle, 0.04 Ma obliquity cycle and 0.02 Ma precession cycle in sedimentary cycle of the lacustrine mud shale. Based on the floating astronomical time scale, the sedimentation time and average sedimentation rate of the pure upper secondary sub-member of the upper submember of the 4th Member of the Sahhejie Formation in Well Fanye-1 were calculated to be 2.73 Ma and 69 m/Ma. Through an investigation on cyclic deposition of the Lower Cretaceous Qingshankou Formation in the Gulong Sag of the Songliao Basin, Lin et al. [44] identified 3 long eccentricity cycles, 10 short eccentricity cycles, 26 obliquity cycles, and 52 precession cycles, and calculated the average sedimentation rate as approximately 93 m/Ma. In the Ordos Basin, the long eccentricity, short eccentricity, and precession cycles in the Chang-7 Member correspond to the stratum thicknesses of 17-29 m, 5.8 m, and 0.8-1.3 m, respectively. The calculated sedimentation rates range from 40 to 70 m/Ma [45].
The previous studies on the Paleogene in the Western Qaidam Depression have identified 11-12 long eccentricity cycles, with the individual eccentricity cycle of approximately 0.40 Ma. The sedimentation time of the upper member of the Lower Ganchaigou Formation was estimated to be about 4.45-4.86 Ma [46], which is consistent with the calculation results by Bao et al. [47]. On this basis, the average and maximum sedimentation rate of E32 were calculated to be 342-384 m/Ma and 524 m/Ma, which are basically consistent with those of the basin (400-500 m/Ma and 700 m/Ma) [48]. The sedimentation rate of the Paleogene in the Western Qaidam Depression is 5-9 times higher than that in the Songliao and Bohai Bay Basins (Fig. 8 ). It is this high sedimentation rate in the Western Qaidam Depression that leads to the dilution of organic matter and reduces the TOC values per unit of rock.
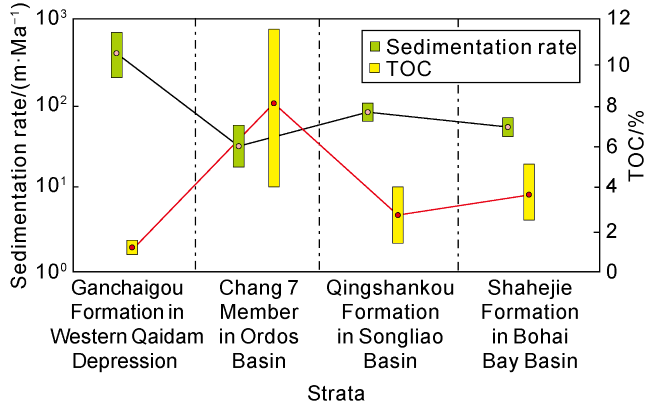
Fig. 8. Sedimentation rates and TOC values of typical lacustrine sediments. |
3.3. High hydrogen-rich organic matter conversion efficiency leads to the low residual TOC values
Organic carbon in geological body consists of dead carbon (carbon without oil-generating ability) and active carbon (carbon with oil-generating ability). The measured organic carbon represents the residual organic carbon after generating hydrocarbons, including dead carbon, carbon yet to be converted into hydrocarbons and converted carbon that has not been expelled [49]. Using TOC to represent organic matter abundance is based on a basic assumption that a higher initial TOC leads to a higher residual organic carbon content. In reality, carbon is superfluous in geological body, while another essential element for hydrocarbon generation, hydrogen, is limited. If the organic matter is hydrogen-deficient, most of the carbon is dead carbon, and in the process of hydrocarbon generation, the consumption of carbon is limited, resulting in only a minor reduction in carbon after hydrocarbon generation. If the organic matter is hydrogen-rich, most of the carbon is active carbon, and in the process of hydrocarbon generation, a significant amount of carbon is converted into oil and gas, leading to a substantial reduction in the amount of residual carbon.
Extensive analyses indicated that the organic matter in source rocks of the saline lacustrine basin of the Qaidam Basin is hydrogen-rich [12⇓-14]. At low maturity stage, the source rocks in the Qaidam Basin show significantly higher hydrogen index than that the Triassic Yanchang Formation in the Ordos Basin [27], indicating a greater amount of generated hydrocarbons per unit of organic carbon and a substantial reduction in the content of residual carbon after hydrocarbon generation. Additionally, hydrogen-rich organic matter primarily generates oil, and in the process of hydrocarbon generation, the carbon content decreases significantly with the decreased hydrogen content. Hydrogen-poor organic matter mainly generates gas, and hydrogen is primarily consumed in the process of hydrocarbon generation, resulting in a relatively limited reduction in the carbon content. This implies that there is a significant difference between the amount of residual carbon after extensive hydrocarbon generation and the original carbon content in the hydrogen-rich Type I organic matter.
To confirm the variation in organic carbon with the increasing organic maturity, thermal simulation experiments were conducted in this study. Two samples were collected from the Jurassic strata in the Northern Qaidam Depression (representing freshwater lacustrine basin) and the Paleogene strata in the Western Qaidam Depression (representing saline lacustrine basin). Their initial geochemical parameters are listed in Table 2 .
Table 2. Initial geochemical parameters of samples for thermal simulation experiments. |
| Sample No. | Well name | Sedimentary environment | Depth/ m | Horizon | Ro/% | TOC/ % | Tmax/ °C | S1/ (mg·g-1) | S2/ (mg·g-1) | (S1+S2)/ (mg·g-1) | HI/ (mg·g-1) | S1/TOC/ (mg·g-1) |
|---|---|---|---|---|---|---|---|---|---|---|---|---|
| 1 | Lengke-1 | Freshwater swamp | 3513.65 | J1 | 0.55 | 5.24 | 437 | 0.71 | 10.03 | 10.74 | 191 | 13.55 |
| 2 | Zhatan-1 | Saline lake | 1224.70 | E32 | 0.47 | 1.23 | 428 | 0.31 | 4.73 | 5.04 | 385 | 25.20 |
The thermal simulation experiments were conducted in a closed high-pressure reaction vessel that was heated to the designated temperature at a constant heating rate within 2 h and held for 72 h. Then, the power was shut down. After being cooled to room temperature, the samples were removed out of the vessel. And their pyrolysis parameters were re-measured after chloroform extraction. The measurement results are shown in Fig. 9 .
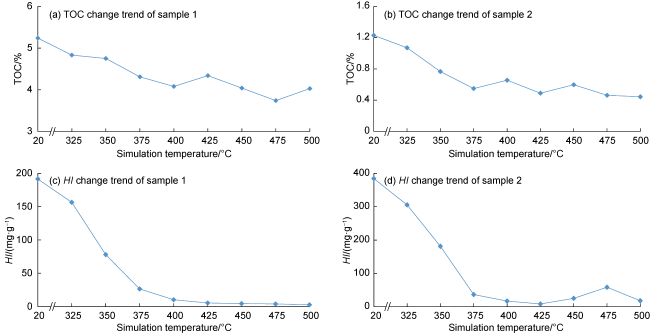
Fig. 9. Change trends of TOC and HI with the simulation temperature in two typical types of source rocks. |
With the increase of simulation temperature, both TOC and HI values of the two samples show a gradual decreasing trend. The period that the samples were heated to 375°C from the original is the main hydrocarbon generation stage, when both HI and TOC values decreased significantly. At 400°C and above, the HI values approached zero, indicating the hydrocarbon generation potential was liberated completely, while the TOC values remained relatively stable. The TOC and HI values of the two samples declined differently. In Sample 1, the TOC value decreases by 23% from 5.24% to 4.03%, and the HI value decreases from 191 mg/g to 6 mg/g. For Sample 2, the TOC value decreases by 64% from 1.23% to 0.44%, and the HI value decreases from 385 mg/g to 18 mg/g. This indicates that Sample 2 experienced greater carbon consumption in the process of hydrocarbon generation due to a higher HI value, while Sample 1 had a relatively limited amount of consumed carbon in this process due to a lower HI value.
3.4. Correct coefficient of organic matter abundance of the Paleogene source rocks
The Easy%Ro model was employed to convert the aforementioned thermal simulation temperatures into the maturity of organic matter, and thus the relationship between parameters (such as TOC and HI) and maturity (Ro) was established (Fig. 10a and 10b ). It is observed that the decrease in TOC primarily occurs during the extensive oil generation process at Ro values lower than 1.3% (heating temperature lower than 375 °C), and maintains relatively stable at Ro values exceeding 1.3%. The ratio of the measured TOC to the initial TOC (TOC0) deceases to about 0.5 at Ro = 1.3%, when the recovery coefficient of TOC should be 2. Similarly, the ratio of the measured HI to the initial HI (HI0) decreases to around 0.1 at Ro = 1.3%, indicating that the hydrocarbon generation potential is nearly exhausted.
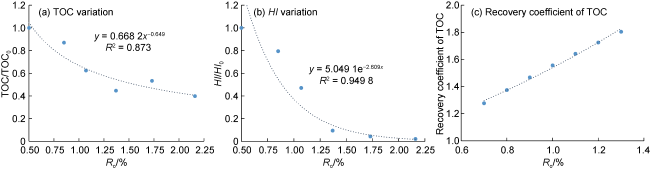
Fig. 10. Variation of TOC, HI and correct coefficient of TOC of the source rocks in saline lacustrine basin with maturity in thermal simulation experiments. |
It should be noted that the rock samples were processed by chloroform extraction in the experiments described above, which means that the soluble hydrocarbons generated by thermal evolution were removed. Therefore, the measured TOC value represents the dead carbon and the carbon that has not yet been converted into hydrocarbons, excluding the carbon that has been converted into the hydrocarbons but remained in the source rocks. In practice, the source rocks in saline lacustrine basin of Qaidam Basin typically contain a significant amount of retained hydrocarbons, generally ranging from 200 mg/g to 400 mg/g TOC. The contribution of retained hydrocarbons to the measured TOC value is calculated to be approximately 17% to 34%, based on that the carbon accounts for approximately 85% of the hydrocarbons. Therefore, compensation should be made for the TOC restoration. The results of the simulation experiments and compensation coefficients can be used to restore the loss of TOC in the processes of hydrocarbon generation and expulsion, and obtain the recovery coefficient of TOC (Fig. 10c ). This allows the TOC value to be restored to the initial value (TOC0), and then achieves the effective evaluation of source rock quality. It should be noted that kerogen loses its hydrocarbon generation ability after the Ro value exceeds 1.3% [50], so the TOC recovery coefficients of samples with higher maturity are consistent with the results at a Ro value of 1.3%.
4. Hydrocarbon generation model of the source rocks in saline lacustrine basin
Hydrocarbon generation of saline lacustrine source rocks of the Qaidam Basin includes two parts: soluble organic matter and insoluble organic matter. Among them, soluble organic matter is mainly inherited from organisms and can be preserved and transformed into hydrocarbons in the early stage in saline lacustrine basins. Hydrocarbon generation of insoluble organic matter, namely kerogen, requires a certain degree of thermal evolution.
4.1. Hydrocarbon generation mechanism and model of soluble organic matter
The depositional environment of saline lacustrine is a necessary condition for the formation of "immature and low-maturity oils". This is mainly because these algae are rich in lipid compounds, known as "oil algae", have low hydrocarbon activation energy and can be directly converted into hydrocarbons at low temperatures [30]. The extremely low oxygen content in saline waters favors the preservation of liquid hydrocarbons formed earlier. One of Rock-Eval parameters, S1 (free hydrocarbons) is an important index reflecting the residual organic matter in source rocks. The statistical data at home and abroad shows the content of free hydrocarbons in most source rocks is lower than 100 mg/g. However, the content of free hydrocarbons in the source rocks of the Western Qaidam area is much higher, topping out at over 10 mg/g, and the S1/TOC values range from 200 mg/g to 400 mg/g TOC. Analysis of group composition of soluble organic matter showed that the resins content is the most, ranging from 60% to 80%, while the saturated hydrocarbons have relatively low content, generally less than 20%. The high content of soluble hydrocarbons indicates a high content of soluble organic matter in the source rocks, which is also the main basis for the previous understanding that oil and gas are derived from soluble organic matter before the source rocks with high organic matter abundance were discovered [12].
In previous studies, simulation experiments were conducted on the low-maturity hydrocarbon generation of typical aquatic algae for clarifying the early hydrocarbon generation of the algae rich in lipid compounds [30]. For example, coccolithophores contain abundant chloroform extracts (referred to as "soluble organic matter") dominated by non-hydrocarbons and asphaltene in initial state (Ro < 0.2%), with a content as high as 400 mg/g TOC, and have the total hydrocarbon content (saturated hydrocarbons + aromatic hydrocarbons) of about 20 mg/g TOC. With the increase of the simulation temperature, contents of both soluble organic matter and total hydrocarbon gradually increased. At 250 °C (Ro = 0.45%), the soluble organic matter content reached its peak at 600 mg/g TOC, and the total hydrocarbon content reached 40 mg/g TOC. As the temperature further increased, the soluble organic matter content started to decrease, while the total hydrocarbon content continued to increase. At 300 °C (Ro = 0.66%), the soluble organic matter decreased to 400 mg/g TOC, while the total hydrocarbon content increased to 60 mg/g. It indicates that in the immature- low maturity stage (Ro < 0.7%), the soluble organic matter content is high, mainly consisting of non-hydrocarbons and asphaltene, and the content of generated saturated and aromatic hydrocarbons reaches as high as 60 mg/g.
4.2. Secondary cracking of soluble organic matter
Soluble organic matter undergoes secondary cracking under the thermal action. The thermal simulation experiments were conducted on soluble organic matter of Well Chai2-4 in a closed gold capsule at 250-490 °C, to reveal the differences in hydrocarbon composition at different evolutionary stages. The capsule was heated to the designated temperature at a constant heating rate within 2 h and held at the designated temperatures for 48 h. The measured results were converted into the equivalent vitrinite reflectance by using Easy%Ro model. Analysis on the organic matter components showed that at low temperatures, soluble organic matter is mainly composed of non-hydrocarbons rich in heteroatomic compounds, followed by heavy components (C15+). As the heating continues, these heteroatomic compounds and heavy components undergo secondary cracking and transform into lighter components (Fig. 11 ).
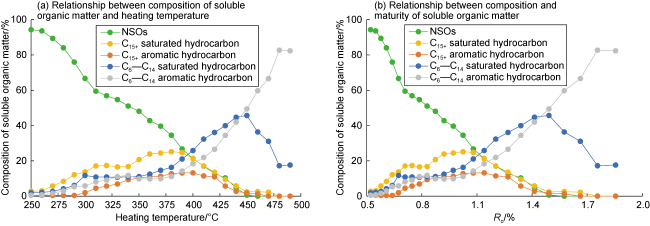
Fig. 11. Variation of the components of soluble organic matter with simulation temperature and Ro. |
In the conversion process of soluble organic matter, the compounds formed firstly are non-hydrocarbons rich in N, S, O and other heteroatoms. Along with increasing thermal evolution degree, the proportion of non-hydrocarbons gradually decreases, while the proportions of saturated hydrocarbons and aromatic hydrocarbons increase. In the primary samples, non-hydrocarbons account for the highest proportion, exceeding 90%, while saturated hydrocarbons and aromatic hydrocarbons only account for 5%. After conversion at a simulation temperature of 250 °C, the corresponding thermal maturity (calculated Ro value) is 0.5%, when non-hydrocarbons still possess a dominant proportion, and the proportion of saturated hydrocarbons and aromatic hydrocarbons increases slightly to 6% and mainly consist of C15+ compounds. When the simulation temperature reaches 300°C, the calculated Ro value is approximately 0.67%, when the proportion of non-hydrocarbons declines to below 70%, and saturated hydrocarbons and aromatic hydrocarbons account for over 30% and are dominated by C15+ compounds. As the simulation temperature increases to 350 °C, the corresponding Ro value is about 0.87%, when the content of non-hydrocarbons decreases to below 50%, and the C15+ saturated hydrocarbons account for approximately 20%, and other C15+ aromatic hydrocarbons, C6-C14 saturated hydrocarbons, and C6-C14 aromatic hydrocarbons each account for 0-15%. At 380°C, the calculated Ro value is 1.02%, corresponding to an oil generation peak, when the non-hydrocarbons have a decreased content to below 35%, the C15+ saturated hydrocarbons and aromatic hydrocarbons account for 25% and 13%, and the C6-C14 saturated hydrocarbons and aromatic hydrocarbons account for 16% and 11%. When the simulation temperature increases to 410 °C, the calculated Ro value reaches 1.35%, indicating the end of primary oil generation of kerogen, when the content of non-hydrocarbons declines to below 20%, specifically 17%, and the hydrocarbons are dominated by the C6-C14 hydrocarbons, with the saturated hydrocarbons and aromatic hydrocarbons accounting for 32% and 22%, and the C15+ saturated hydrocarbons and aromatic hydrocarbons accounting for 17% and 11%. When the simulation temperature reaches 450 °C, the calculated Ro value is 1.49%, the C6-C14 saturated hydrocarbons and aromatic hydrocarbons account for 46% and 49%, the C15+ saturated hydrocarbons and aromatic hydrocarbons each account for 2%, and the non-hydrocarbons have a content as low as only 1%. The variation of hydrocarbon components in the simulated rapid heating process is probably different from that under actual geological conditions, but they have consistent overall trends.
4.3. Hydrocarbon generation of insoluble organic matter
The statistical analysis of actual geological samples by Chen et al. [28] indicated that the source rocks in saline lacustrine basins have similar hydrocarbon generation patterns to other typical oil-prone organic matter in the high maturity stage, which conforms to the traditional Tissot model, with an oil generation peak.
To determine the hydrocarbon generation model of organic matter in saline lacustrine basins in the maturity stage, simulation experiments were conducted on the low-maturity source rock samples of saline lacustrine basin, whose values of TOC, Tmax and HI are 4.69%, 436 °C and 699 mg/g, in closed simulation system. To produce higher hydrocarbons for subsequent analyses, kerogen extraction was carried out on the samples, and the extracted kerogen samples are Type I kerogen with TOC, Tmax and HI of 3.94%, 436 °C and 912 mg/g. The thermal simulation experiments were conducted in a closed gold capsule, which was heated from 300 °C to 500 °C with an interval of 10 °C at a constant heating rate, and held at the designated temperatures for 48 h. The corresponding Ro values calculated using the Easy%Ro model increased from 0.67% to 1.98%, reflecting the thermal evolution history throughout the oil generation stage of source rocks. The simulation results are shown in Fig. 12 .
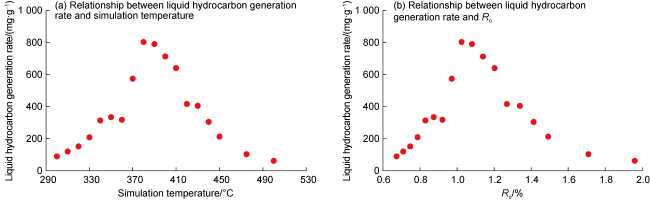
Fig. 12. Oil generation rate of kerogen in the source rocks in saline lacustrine basins. |
The simulation revealed that the hydrocarbon generation model of the source rocks in saline lacustrine basins in the maturity stage is fundamentally consistent to those of other types of source rocks. The major oil generation period corresponds to the Ro values of 0.7%-1.0%, when the maximum oil yield reaches 800 mg/g, accounting for approximately 90% of the HI, indicating that the kerogen dominantly generates oil. When Ro values are greater than 1.0%, the amount of liquid hydrocarbons starts to decrease, and extensive gas generation begins by the cracking of liquid hydrocarbons. When Ro is about 1.7%, the content of liquid hydrocarbon declines below 50 mg/g. This hydrocarbon generation model is consistent with the classical one, suggesting that the hydrocarbon generation mechanism of the source rocks in saline lacustrine basins in the maturity stage is roughly the same as those of other oil-prone source rocks, where an oil generation peak is reached at the Ro value of about 1.0%.
4.4. Hydrocarbon generation model of the source rock in saline lacustrine basins
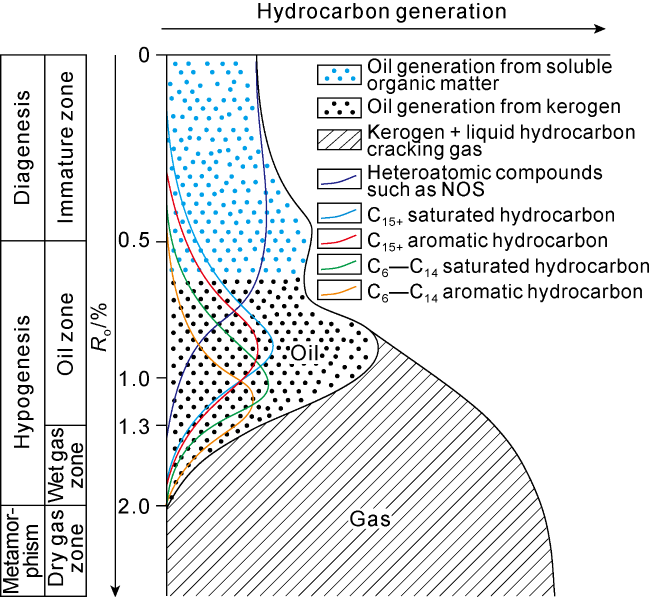
Based on the comprehensive study on hydrocarbon generation of algae conducted by Huang et al. [30] and the hydrocarbon-generating simulation experiments of kerogen in a closed gold capsule conducted in this study, two stages were identified inductively in the hydrocarbon generation model of the source rocks of saline lacustrine basins: the oil generation by soluble organic matter in the early low-maturity stage, and the hydrocarbon generation by insoluble organic matter in the late maturity stage. The soluble hydrocarbons rich in heteroatoms generated in the early stage undergo secondary cracking (Fig. 13 ).
Fig. 13. Hydrocarbon generation model of the source rocks in saline lacustrine basins. |
Oil generation from soluble organic matter: The parent materials of soluble organic matter are mainly derived from the lipid compounds in organisms. In the saline anoxic environment, these lipid compounds are preserved and not bonded to kerogen. As directly dissolved in organic solvents, they are commonly known as "soluble organic matter". In the early low maturity stage, these compounds can directly convert into hydrocarbons, forming immature and low-maturity oils.
Secondary cracking of soluble hydrocarbons: In the lower thermal evolution stage, non-hydrocarbons rich in O, N, S and other heteroatoms are primarily generated, followed by heavy hydrocarbons (C15+). These heteroatomic compounds and heavy hydrocarbons undergo secondary cracking in the further heating processes, converting into light saturated hydrocarbons and aromatic hydrocarbons.
Oil generation from insoluble organic matter: Organic matter forms kerogen (i.e. insoluble organic matter) through mineralization, which cracks into oil and gas under thermal action. This thermal evolution model is consistent with the classical oil and gas generation model, where the oil window locates at Ro values of 0.7%-1.3%, and the peak oil generation corresponds to the Ro value of 1.0%.
Compared with the traditional hydrocarbon generation model of freshwater lacustrine source rocks, the soluble organic matter which is directly derived from organisms and preserved earlier in saline lacustrine basins is considered as an important source of hydrocarbon generation. The soluble organic matter undergoes secondary cracking to form light oils in the later heating process. This model lays a theoretical foundation for the formation of high abundance oil and gas reservoirs from source rocks in the Qaidam Basin that have relatively low organic matter abundance, and provides scientific guidance for the study on organic matter enrichment and hydrocarbon generation mechanism as well as the evaluation of conventional and unconventional oil and gas resource potential in the saline lacustrine basins.
5. Conclusions
In the Western Qaidam Depression, a good linear relationship is identified between TOC and hydrocarbon generation potential (S1+S2) of Paleogene Lower Ganchaigou Formation source rocks, but the linear slope is higher than those in other continental freshwater lacustrine basins. This indicates that TOC is an effective indicator for evaluating organic matter abundance. The low TOC values are prominent characteristics of the source rocks in the Western Qaidam Depression, and biomarkers reveal that the organic matter primarily originates from aquatic organisms formed in the strong reducing environments.
Three main factors result in low TOC value of source rock in the Western Qaidam Depression. (1) The Qaidam Basin is an inland lacustrine basin, whose salinization is the result of evaporation. The cold and arid paleoclimate and relatively poor nutrient supply are disadvantageous to the development of algal blooms. (2) High deposition rate leads to the dilution of organic matter in the strata. As a result, the source rocks characterized by large thickness and low organic matter abundance per unit of rock are deposited. (3) High hydrogen content and conversion efficiency of organic matter leads to a lower residual organic carbon reflected by the measured TOC because most of the organic carbon is converted into hydrocarbons in the process of hydrocarbon generation. For this type of hydrogen rich organic matter, due to the reduction of organic carbon during hydrocarbon generation, TOC needs to be restored based on maturity before it is used for evaluating organic matter abundance.
The simulation results of hydrocarbon generation kinetics indicate that the hydrocarbon generation of saline lacustrine source rocks of the Qaidam Basin includes two parts: soluble organic matter and insoluble organic matter. Among them, soluble organic matter is mainly inherited from organisms and can be preserved in saline lacustrine basins. It can generate hydrocarbons during low evolution stages, and the formed hydrocarbons are rich in heteroatomic compounds, and undergo secondary cracking to form light components in the later stage. The hydrocarbon generation model of insoluble organic matter (kerogen) conforms to the traditional Tissot model, with an oil generation peak corresponding to R0=1.0%.
Nomenclature
HI—hydrogen index, mg/g;
HIo—initial hydrogen index, mg/g;
Ro—organic matter maturity, %;
S1—free hydrocarbon content, mg/g;
S2—residual hydrocarbon content, mg/g;
Tmax—maximum pyrolysis temperature, °C;
TOC—total organic carbon, %;
TOCo—initial total organic carbon, %.