

Introduction
The offshore oil and gas reserves newly discovered in the past ten years account for 60% of the total oil and gas reserves of the world, and the oil and gas reserves discovered in deep and ultra-deep waters account for 61.99% of the total offshore oil and gas reserves. The deepwater domain is and will be playing a dominant role in global oil and gas exploration. Currently, the extent of offshore oil and gas exploration is still low, offshore areas have enormous resource potential, and the deepwater domain has even broader prospects [1-2]. Since China is a large producer and consumer of oil and natural gas, strengthening overseas oil and gas exploration is an important measure to ensure the security of its oil and gas development strategy. Major international oil companies are speeding up access to the deepwater domain and making great efforts in this domain. Under such background, the situation of global deepwater oil and gas exploration is analyzed using the commercial databases of agencies such as S&P Global and Rystad and the public information disclosed by oil companies, and several recommendations on the development of overseas deepwater oil and gas exploration business are made based on the theoretical understanding of global oil and gas geology and resources gained through evaluations over the years to assist Chinese oil companies in developing their overseas exploration business.
1. History of global offshore oil and gas exploration
Over more than a century, offshore oil and gas exploration has moved from shallow waters (0-500 m) to deep (500-1500 m) and ultra-deep (more than 1500 m) waters. Based on an analysis of the process of growth/ change in new oil and gas reserves, the history of global offshore oil and gas exploration can be divided into three development stages (as shown in Fig. 1 ).
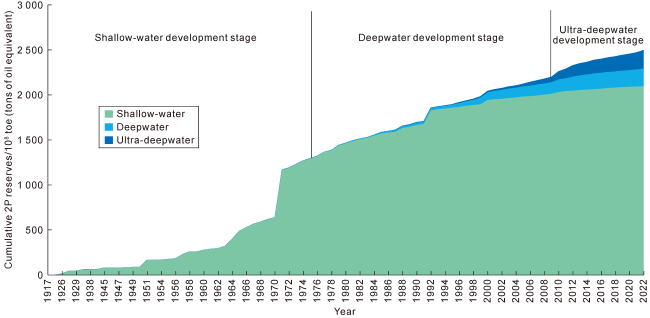
Fig. 1. History and development stages of global offshore oil and gas exploration [5]. |
1.1. Shallow-water development stage (from 1917 to 1976)
In 1917, the Cabimas Oilfield was discovered in Lake Maracaibo, Venezuela. This oilfield is located in a lake with a depth of 4.57 m. A wooden drilling platform was built to extract underwater oil deposits. It is considered the first fixed offshore platform in the world. Before the 1940s, due to the limited level of development of offshore equipment and instruments, offshore oil and gas exploration activities were mainly performed via wooden platforms and artificial islands built with civil engineering technology [3]. For this reason, offshore operations were mainly carried out in offshore areas and inland lakes, usually at depths below 20 m. During the period from the 1940s to the end of the 1960s, with the development of the steel industry and welding technologies, the United States of America discovered and developed tens of oil and gas fields in the Gulf of Mexico [3]. Subsequently, drilling units such as submersible drilling platforms, jack-up platforms, drill ships, and semi-submersible drilling rigs emerged successively. These units greatly facilitated offshore oil and gas exploration. Since the 1960s, many oil and gas exploration activities have been carried out in offshore areas such as the North Sea, the Persian Gulf, the Gulf of Mexico, African offshore areas, the northern slope of Alaska, the Black Sea, and the coasts of Southeast Asian countries, and many offshore oil and gas fields have been discovered. However, most of these offshore oil and gas exploration activities were carried out in offshore areas with water depths below 500 m, and offshore oil and gas exploration after the 1960s was generally at the shallow-water development stage.
1.2. Deepwater development stage (from 1977 to 2009)
The first deepwater oil/gas field in the world is the Mississippi Canyon Block 0311 gas field, which was discovered by the USA in the Gulf of Mexico in 1968, with an operating water depth of 701.04 m. However, it was not until 1976 that continuous deepwater oil and gas fields were discovered. In the following 20 years, more and more deepwater oil and gas fields were discovered. During the deepwater development stage, besides the oil and gas exploration activities in Gulf of Mexico, the exploration activities in Brazil also entered the deepwater domain, and major discoveries were made in the deepwater zones of the Campos Basin. In addition, the Gulf of Mexico, the Vøring Basin in the North Sea, the Campos Basin in Brazil, northwestern Australia, and the Lower Congo Basin in Africa became key areas for deepwater oil and gas exploration. The development of sequence stratigraphy and petroleum system theories in the 1970s and the development of deepwater sedimentology in the 1990s [4] have provided a solid theoretical foundation for the progress in deepwater oil and gas exploration. Additionally, the development of 3D seismic technology, rotary steerable drilling systems, floating production, storage and offloading units, compliance towers, fourth-generation semi-submersible drilling rigs, and tension leg platforms has laid a technical foundation for the rapid progress in deepwater oil and gas exploration.
1.3. Ultra-deepwater development stage (from 2010 to the present)
Since 2010, the maturation of deepwater oil and gas geological theories and the development of offshore equipment such as Spars (deep-draft caisson vessels), fifth-generation semisubmersible drilling rigs, drill ships, and intelligent deepwater drilling platforms have greatly promoted oil and gas exploration in ultra-deep water [3]. At the ultra-deepwater development stage, the number and reserves of new oil and gas fields discovered in ultra-deep water are much greater than those of oil and gas fields in shallow and deep waters and are increasing year by year. This trend is closely related to the discovery of giant offshore oil and gas fields in the Brazilian pre-salt region, East Africa, and the Eastern Mediterranean. At this stage, global ultra-deepwater oil and gas exploration activities are mainly concentrated in the Gulf of Mexico, West Africa (the Niger Delta Basin, the Lower Congo Basin, the pre-salt section of the Kwanza Basin pre-salt, the Côte D’Ivoire Basin, the Senegal River Basin, etc.), Brazil (the Campos Basin, etc.), the Rovuma Basin in East Africa and the basins of Tanzania, the Guyana-Suriname Basin, the Vøring Basin in Norway, the deepwater areas of Southeast Asia, the South China Sea (the Pearl River Mouth Basin and the Qiongdongnan Basin), the Levant Basin in the Eastern Mediterranean, the Nile Delta Basin, the Barents Sea, and the North West Shelf of Australia. After more than ten years of development, the oil and gas reserves in ultra-deep water are still increasing, and the ultra-deepwater domain has become one of the most important fields for global oil and gas exploration and for increasing oil and gas reserves and production.
2. Global oil and gas exploration and discoveries in deep and ultra-deep waters
As of 2023, 1372 deepwater/ultra-deepwater oil and gas fields (hereinafter referred to as deepwater fields) have been discovered around the world, with total recoverable reserves of 408.01 × 10⁸ toe (tons of oil equivalent). These fields are mainly distributed in regions such as the Gulf of Mexico, the eastern and western coasts of the Atlantic, East Africa, North Africa, the Black Sea, the South Caspian Sea, the Bay of Bengal, the North West Shelf of Australia, and the South China Sea [5] (Fig. 2 ). In recent years, breakthroughs have been made continuously in oil and gas exploration in deepwater areas, especially the areas around Africa, the Atlantic Ocean in South America, the Black Sea, and the South Caspian Sea, which have become key areas for increasing global oil and gas reserves[2,6⇓⇓⇓⇓⇓⇓⇓⇓⇓⇓⇓ -18]. In general, global deepwater oil and gas exploration has four characteristics.
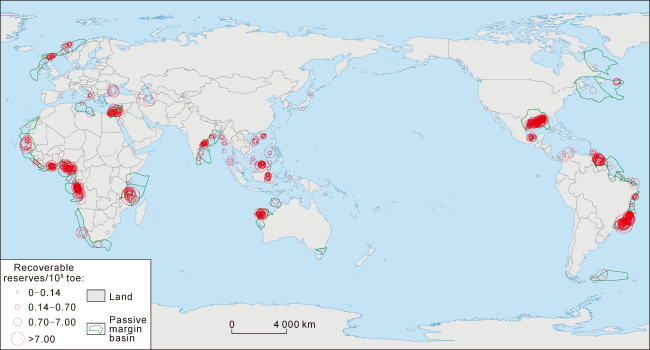
Fig. 2. Distribution of deepwater fields around the world. |
2.1. The oil and gas reserves discovered in the deepwater zones of passive margin basins are the greatest
Passive margin basins are widely distributed around the globe. There are 130 passive margin basins around the world, with a total deposition area of 3350 × 104 km2. The total offshore deposition area is 3016 × 104 km2, of which nearly 75% are located in deep water. The hydrocarbon exploration and development activities in these offshore areas started later than those in onshore areas [14]. By 2023, 1215 oil and gas fields have been discovered in the deepwater zones of passive margin basins. The total recoverable reserves of oil and gas in these fields are 369.55 × 10⁸ toe (Table 1 ), which account for 90.57% of the total deepwater oil and gas reserves and are much greater than those in other types of basins. The oil and gas reserves of passive margin basins are very unevenly distributed in various regions. The oil and gas reserves of passive margin basins around Africa and in the eastern waters of Latin America rank first, amounting to about 140 × 108 toe.
Table 1. Statistical table of the types and regional distribution of deepwater oil and gas fields/basins around the world [5] |
| Basin type | Recoverable reserves/108 toe | |||||||
|---|---|---|---|---|---|---|---|---|
| Africa | Latin America | North America | Asia-Pacific | Middle East | Europe | Central Asia-Russia | Total | |
| Passive margin basin | 145.04 | 137.07 | 46.07 | 20.94 | 10.31 | 10.12 | 369.55 | |
| Back-arc basin | 1.21 | 14.14 | 15.35 | |||||
| Fore-arc basin | 0.03 | 0.060 | 0.09 | |||||
| Rift basin | 0.52 | 0 | 0.27 | 0.79 | ||||
| Foreland basin | 2.68 | 1.13 | 6.65 | 1.64 | 10.13 | 22.23 | ||
| Total | 145.56 | 140.96 | 46.1 | 36.27 | 17.23 | 11.76 | 10.13 | 408.01 |
2.2. Large oil and gas discoveries contribute most to oil and gas reserves
As of 2023, 121 large oil and gas fields have been discovered by oil companies in deep waters around the globe, accounting for 8.89% of the total number of offshore oil and gas fields. The total recoverable reserves of oil and gas in these deepwater fields are 252.92 × 10⁸ toe, accounting for 61.99% of the total offshore oil and gas reserves. In 1979, ExxonMobil discovered a giant gas field with recoverable reserves of 3370.08 × 108 m3 in the Carnarvon Basin, namely, the Scarborough gas field. This discovery is the first major breakthrough in deepwater oil and gas exploration in the world. In 1984, Petrobras discovered Albacora, the first large oilfield in the Campos Basin, and then successively discovered another seven large oil and gas fields in the basin, with total recoverable reserves of 115.59 × 10⁸ toe. During the period from 1995 to 2005, 31 large deepwater oil and gas fields were discovered, including 17 in Africa. These 17 fields are mainly distributed in the Niger Delta Basin in West-Central Africa and the Lower Congo Basin in Central Africa. The subsequent major breakthroughs and discoveries made in deep water are mainly concentrated in Latin America and areas around Africa. These major discoveries include the Tupi oilfield, which is the first large pre-salt oilfield discovered by Petrobras in the Santos Basin in 2006, the Jubillee oilfield, which is a large Cretaceous sandstone oilfield discovered by Kosmos Energy in the Côte D’Ivoire Basin in 2007, the Tamar gas field, which is a large Miocene sandstone gas field discovered by Nobel Energy in the Levant Basin in 2009, the Lavani gas field, which is a large Cretaceous-Paleogene sandstone gas field discovered by Equinor in the Tanzania Basin in 2012, the Zohr gas field, which is a giant Cretaceous biohermal gas field discovered by Eni in the Eratosthenes Basin in 2015, and the Venus oilfield, which is a giant Cretaceous sandstone oilfield discovered by TotalEnergies in the Southwest African Coastal Basin in 2022.
2.3. More and more lithologic reservoirs are discovered
The first deepwater oil/gas field in the world is a structural reservoir. Structural-lithologic composite reservoirs were discovered successively in the following years. In the past ten years, with the continuous development of ultra-deepwater deposition theories and seismic, drilling and exploration technologies, lithologic traps dominated by slope fan/submarine fan gas reservoirs have been discovered in deep and ultra-deep waters, and the oil and gas reserves of such reservoirs have been increasing continuously (Fig. 3 ).
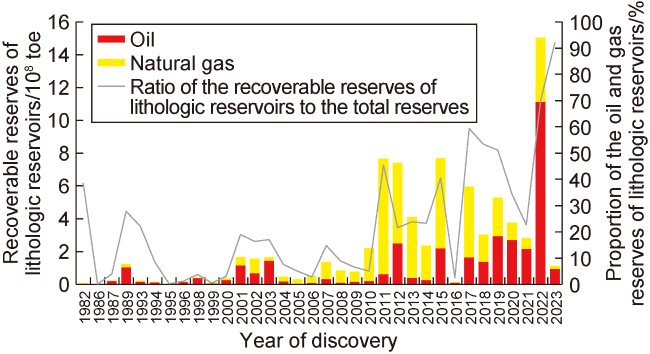
Fig. 3. Oil and gas reserves of deepwater lithologic reservoirs around the world and the proportion of such reserves. |
The lithologic reservoirs discovered at early stages are mainly distributed in the Campos Basin, the Santos Basin, the Sergipe-Alagoas Basin in Latin America, and the deepwater basin of the Gulf of Mexico in North America. In 1989, Petrobras discovered the first large oil and gas field formed by a lithologic trap in the Campos Basin, namely, the Barracuda Field. In the ensuing 10 years, various oil companies carried out deepwater exploration activities and successively discovered a number of deepwater lithologic reservoirs in the Niger Delta Basin in West Africa, the Lower Congo Basin in Central Africa, and the Ionian Basin in the Eastern Mediterranean. After 2000, several lithologic reservoirs were discovered in four basins off the coast of Brazil, including the Campos Basin where a large oil and gas field named the Jubarte Field was discovered. Since 2010, oil companies have successively made breakthroughs in the exploration of deepwater lithologic reservoirs in new basins, and the oil and gas reserves in lithologic reservoirs have risen to a higher level (Fig. 3 ). During the period from 2010 to 2014, seven lithologic gas reservoirs/fields were discovered in the Rovuma Basin in the waters of East Africa, with the total recoverable reserves of 1.85 × 10¹² m3. The recoverable reserves of oil and gas in the lithologic reservoirs discovered in the Guyana Basin and Senegal Basin on both sides of the Mid-Atlantic during the period from 2015 to 2023 amount to 17.96 × 10⁸ toe [5]. In the Orange Basin in the South Atlantic Ocean, TotalEnergies achieved great success in the Lower Cretaceous basin-floor fan in the Namibian sea area in 2022. In addition, during the period from 2022 to 2023, Shell discovered three lithologic reservoirs in the same sea area, with total recoverable reserves of 8.79 × 10⁸ toe [5].
2.4. In terms of geological age, pay zones are mainly Mesozoic and Cenozoic reservoirs.
The statistics of the geological ages of deepwater oil and gas reservoirs (Table 2 ) show that the oil and gas reserves in Mesozoic-Cenozoic reservoirs account for 99.98%, most of which come from Cretaceous, Paleogene, and Neogene reservoirs. The recoverable reserves of oil and gas in Cretaceous, Paleogene, and Neogene reservoirs are 180.78 × 10⁸, 74.19 × 10⁸, 143.87 × 10⁸ toe, accounting for 97.76% of the total deepwater oil and gas reserves. By analyzing the characteristics of the spatial distribution (Fig. 2 ) and geological ages (Table 2 ) of the discovered oil and gas reservoirs, it can be found that these reservoirs are closely related to the process of plate tectonic evolution since the breakup of Pangaea. According to the research of Scotese et al. [19] on the history of plate tectonic evolution, the Mesozoic and Cenozoic reservoirs around the Atlantic Ocean and the Indian Ocean have always been subjected to extensions involving rifts and passive continental margins, which is favorable for hydrocarbon accumulation.
Table 2. Statistical table of the geological ages and regional distribution of deepwater oil and gas reservoirs around the world [5] |
| Erathem | System | Africa | Latin America | North America | Asia-Pacific | Middle East | Europe | Central Asia-Russia | Total |
|---|---|---|---|---|---|---|---|---|---|
| Cenozoic | Quaternary | 0.03 | 0.47 | 0.23 | 0.10 | 0.83 | |||
| Neogene | 51.72 | 13.58 | 30.84 | 18.03 | 17.23 | 2.34 | 10.13 | 143.87 | |
| Paleogene | 42.95 | 14.86 | 10.37 | 0.66 | 0 | 5.35 | 74.19 | ||
| Mesozoic | Cretaceous | 50.86 | 112.52 | 4.38 | 9.24 | 3.78 | 180.78 | ||
| Jurassic | 0.02 | 0.87 | 0.10 | 0.99 | |||||
| Triassic | 7.24 | 7.24 | |||||||
| Paleozoic | Carboniferous | 0.07 | 0.07 | ||||||
| Silurian | 0.02 | 0.02 | |||||||
| Cambrian | 0.02 | 0.02 | |||||||
| Total | 145.56 | 140.96 | 46.10 | 36.27 | 17.23 | 11.76 | 10.13 | 408.01 | |
3. Layout of deepwater oil and gas exploration business of the seven major international oil companies
The seven major international oil giants, namely, ExxonMobil, bp, Shell, TotalEnergies, Chevron, Equinor, and Eni, were the first to participate in deepwater oil and gas exploration [20-21]. Relying on their experience in the development of shallow-water oil and gas fields, these seven major international oil companies are constantly proceeding to the field of oil and gas exploration in deeper waters. After years of continuous operation, these companies have become highly active and play a leading role in all aspects of deepwater oil and gas exploration and development.
3.1. Taking the lead in developing deepwater oil and gas exploration business, actively deploying deepwater exploration blocks, and attaching importance to the participation in bidding activities in key areas
According to statistics, in the field of deepwater oil and gas exploration, the seven major international oil companies directly participated in 50% of the exploration wells drilled in waters deeper than 400 m around the world during the period from 1990 to 2022 and acted as operators for 38% of these exploration wells. In addition, 74% of the recoverable reserves discovered through exploration are directly related to these seven major international oil companies, and 35% of deepwater oil and gas discoveries are directly owned by these companies [5].
International oil companies generally attach great importance to the layout of deepwater oil and gas exploration business and are highly active in mergers and acquisitions. Statistics show that the seven major international oil companies attach high importance to participating in the bidding activities launched by the major host countries of deepwater oil and gas resources. During the period from 2018 to 2022, all of the seven major international oil companies participated in the bidding activities launched for deepwater oil and gas projects in countries and regions such as the Gulf of Mexico (USA), Brazil, and West Africa. bp acquired interests in 155 blocks in the USA, with a total area of 3440 km2; ExxonMobil acquired interests in 25 blocks in Brazil, with a total area of 9346 km2; Shell acquired interests in 23 blocks in Brazil, with a total area of 10 439 km2.
By participating in bidding activities for deepwater oil and gas projects, international oil companies continue to take the lead in deepwater oil and gas exploration. Eni is one of the leading international oil companies that are highly specialized in deepwater oil and gas exploration. In recent years, Eni has been focusing on the acquisition of resources for deepwater oil and gas exploration and the acquisition of exploration assets in countries such as Egypt, Angola, and Ghana, and it has acquired a large number of deepwater oil and gas exploration assets in the Gulf of Mexico. After entering the deep waters of Egypt, Eni discovered three deepwater gas fields in 1999 and then continued to participate in the bidding for oil and gas exploration in Egyptian waters. After acquiring the block, it actively carried out in-depth geological research, re-collected seismic data, and finally made several major discoveries including the Zohr gas field by performing fine-scale seismic interpretation and modeling and drilling exploration wells. In general, Eni’s success is the result of its long-term continuous efforts in conducting follow-up studies, its emphasis on the acquisition of first-hand data, and its long-term persistence in carrying out activities in an in-depth and careful manner in the basin area.
3.2. Most international oil companies enter exploration blocks through bidding at the early stage before oil and gas discoveries are made, and a few oil companies enter exploration blocks through mergers and acquisitions at high prices after discoveries are made
Statistics show that most international oil companies enter deepwater oil and gas exploration blocks through bidding at the early stage before oil and gas discoveries are made, and a few oil companies enter exploration blocks through mergers and acquisitions at high prices after discoveries are made. Early entry into deepwater oil and gas exploration blocks can often enable oil companies to gain dominant advantage over competitors and introduce partners at later stages to share exploration risks. For the 10 large deepwater oil and gas projects led by international oil companies, most of the international oil companies acting as operators entered the blocks before oil and gas discoveries were made (Table 3 ). For example, Shell entered ExxonMobil’s Stabroek Block in Guyana in 2009 and exited the block in 2015. Later, Hess Corporation and CNOOC Nexen Petroleum Guyana Ltd entered the block as new partners and made large oil and gas discoveries in the same year. The Leviathan project in Israel is an example of entry through mergers and acquisitions by operators. After making its early entry into the Leviathan project and making oil and gas discoveries, Nobel Energy made active efforts to sell its interests in the project due to large investments in continuous exploration and evaluation at the later stage and future development. Later Chevron entered the project through the acquisition of Nobel Energy.
Table 3. Ten large deepwater oil and gas projects led by international oil companies [5] |
| Large deepwater oil and gas projects led by international oil companies | Company making the discovery | Operators (companies) entering the project at different times | Main partners (companies) entering the project at different times | |||
|---|---|---|---|---|---|---|
| Before discovery | After discovery | After the final investment decision is made | Before discovery | After discovery | ||
| Starbroke block | ExxonMobil, CNOOC, Hess Corporation | ExxonMobil | CNOOC, Hess Corporation | |||
| Gorgon Project | ExxonMobil | Chevron | ExxonMobil, Shell | |||
| Block 58 (Suriname) | Apache Corporation | TotalEnergies | Apache Corporation | |||
| Leviathan | Nobel Energy | Chevron | Ratio Energies, NewMed Energy | |||
| Abadi | Inpex | Inpex | Shell | |||
| Browse | Woodside Energy, bp, Chevron, Shell | Woodside Energy | Shell, bp | CNPC | ||
| Yakaar | bp, Kosmos Energy | bp | Kosmos Energy | |||
| OML 118 (Bonga Fields) | Shell, ExxonMobil, Eni, TotalEnergies | Shell | ExxonMobil, Eni, TotalEnergies | |||
| OML 133 (Erha and Bosi) | ExxonMobil, Shell, bp | ExxonMobil | Shell | |||
| Ormen Lange | Shell, Equinor, ExxonMobil, bp | Shell | Norway State DFI, Equinor | PGNiG, Eni | ||
3.3. Attaching importance to the accumulation of technologies for deepwater oil and gas exploration and strengthen cooperation in the supply chain of deepwater exploration technology
Technological progress is an important driving force for the rapid development of deepwater oil and gas exploration business. The seven major international oil companies have been engaged in the field of deepwater oil and gas exploration for decades and have been gradually developing and growing relying on their experience in shallow-water oil and gas exploration and development accumulated over the years [14]. In terms of the history of global offshore oil and gas exploration, most international oil companies began to take shape in the field of shallow-water oil and gas exploration and development in the 1970s; international oil companies began to participate in deepwater oil and gas exploration and development in the 1990s and initiated oil and gas production in ultra-deep water in the first decade of the 21st century.
The experience of major international oil companies in setting deepwater oil and gas exploration records continuously shows that maximizing the use of highly qualified suppliers and actively building preferred service partnerships is the best practice adopted by these companies to improve competitiveness in the field of deepwater oil and gas exploration. Taking Chevron’s Tahiti Spar as an example, the design of the topside is undertaken by Mustang Engineering, the integration of the topside and the hull is undertaken by J. Ray McDerrmott, and the contract for the floating system is undertaken by Technip as a general contractor. In addition, some technical service and equipment providers have been constantly responding to the needs of international oil companies and have made a series of technological breakthroughs through continuous research in deepwater drill ships, pipe-laying vessels, subsea production systems, etc.
3.4. International oil companies adopt strategies that enable them to take the lead or follow the practices of other companies and share risks with other companies through extensive cooperation in the field of deepwater oil and gas exploration
International oil companies have their own advantages in different deepwater oil and gas exploration areas. For example, Shell and bp have great advantages in the Gulf of Mexico; Chevron plays a dominant role in Australian waters; Eni and Total have significant advantages in African waters. In deepwater areas where they do not have competitive advantages, international oil companies usually follow the practices of, and actively cooperate with, local national oil companies and international oil companies having competitive advantages. For example, in recent years, international oil companies have been frequently acquiring exploration blocks in Brazilian waters and cooperating with Petrobras in most of the exploration blocks acquired by them.
Cooperation between major international oil companies is also a remarkable characteristic of deepwater oil and gas exploration. The seven major international oil companies cooperate with other similar companies for 52% (on average) of the oil and gas reserves wherein the interests are held by them. The percentage of oil and gas reserves operated by Equinor in cooperation with other companies is 83%, the percentages of oil and gas reserves operated by Chevron and Eni in cooperation with other companies are greater than 60%, and the percentage of oil and gas reserves operated by ExxonMobil in cooperation with other companies is close to 50%.
4. Geological characteristics of deepwater oil and gas reservoirs around the world
The deepwater oil and gas reservoirs around the world are mainly distributed in passive margin basins. Therefore, the geological characteristics of passive margin basins basically represent the geological conditions of deepwater oil and gas reservoirs.
4.1. Source rocks
The passive margin basin considered herein has undergone the vertical stacking of three prototype basins, and all depositional sequences may become high-quality source rocks (Table 4 ). As confirmed through exploration, the following five suites of source rocks may have been formed in these depositional sequences and the pre-rift strata: the lacustrine/marine source rocks formed during the rifting stage, the marine/lagoon source rocks formed during the transition stage, the marine source rocks formed during the early drift stage, the deltaic source rocks formed during the late drift stage, and the source rocks formed during the pre-rift stage. Among these source rocks, the lacustrine/marine source rocks formed during the rifting stage, the marine source rocks formed during the early drift stage, and the deltaic source rocks formed during the late drift stage contribute most to oil and gas reserves [22].
Table 4. Geological characteristics of deepwater oil and gas reservoirs in various types of passive margin basins around the world [22] |
| Basin type | Representative basin | Major source rocks | Major reservoirs | Seals (cap rocks) | Main types of traps |
|---|---|---|---|---|---|
| Inverted basin | Levant Basin | Oligocene-Miocene marine mudstone, type II, TOC: 0.5%-1.5%, HI: 300 mg/g, S2: 2 mg/g | Oligocene-Miocene Tamar Formation basin-floor fan turbidite sandstones, net reservoir thickness: 140 m, average porosity: 25%, permeability: 1000 × 10-3 μm2 | Messinian rock salt | Structural trap, structural- lithologic composite trap |
| Delta reformed basin | Niger Delta Basin | Middle/Pliocene (deltaic) prodeltaic shales, type II/III, TOC: 0.2%-4%, HI: 55-350 mg/g, S2: 5-20 mg/g, thickness: more than 3000 m | Paleogene-Neogene sandstones, porosity: generally 22%-32%, maximum porosity: 40%, average porosity: 25%, permeability: (500-1000) × 10-3 μm2 | Shales of the Akata Formation with thickness ranging from 17 m to 270 m | Structural trap |
| Salt-bearing depression- type basin | Senegal River Basin | Upper Cretaceous (depression strata) pelagic mudstones, type II, TOC: 1.3%-8.7%, HI: 300-700 mg/g, S2: 3-75 mg/g, thickness: 300-700 m | Upper Cretaceous clastic rocks/ reservoirs, maximum porosity: 35%, permeability: hundreds of millidarcy (mD); Jurassic-Lower Cretaceous carbonate platform reservoirs, porosity: 10%-23%. | Upper Cretaceous (Turonian) and Miocene marine shales | Rollover anticline, fault block, salt structure, and lithologic trap |
| Scotia Basin | Upper Jurassic (depression strata) pelagic mudstones, type II/III, TOC: 0.5%-4%, Ro: 0.8%, HI: 150-400 mg/g, S2: 3-5 mg/g, thickness: 150-1000 m | Upper Jurassic-Lower Cretaceous Mi’kmaq Formation and Mississauga Formation sandstones (main reservoirs), porosity: 4.8%-20%, permeability: (0.01-200) × 10-3 μm2 | Interlayered, laterally continuous marine and prodeltaic shales of the Mi’kmaq, Mississauga, and Logan Canyon formations | Fault-lithologic composite trap | |
| Salt-free depression- type basin | Côte D’Ivoire Basin | Lower Jurassic (depression strata) pelagic mudstones, type II/III, TOC: 0.5%-3.7%, Ro: 2.1%, HI: 21-331 mg/g, S2: 2-50 mg/g, thickness: 700 m | Lower Cretaceous Aptian-Albian sandstones, porosity: 17%-22%, permeability: 2000 × 10-3 μm2; Upper Cretaceous Turonian- Cenomanian lower turbidite sandstones, porosity: 19%-21%, permeability: (200-500) × 10-3 μm2 | Upper and Lower Cretaceous shales | Upper Cretaceous: structural-lithologic composite trap; Lower Cretaceous: fault block, anticline, and structural- lithologic trap |
| Salt-bearing fault- depression-type basin | Congo Basin | Post-salt (Upper Cretaceous, depression strata) neritic shales, type II, TOC: 4.6%, Ro: 1.4%, HI: 571 mg/g, thickness: 400 m | Top of Lower Cretaceous Aptian- Albian dolomites, limestones and sandstones, and Oligocene- Pliocene sandstones | Albian shales and Toulonian thick- bedded marine shales | Structural and lithologic traps |
| Pre-salt (Upper Cretaceous, rift strata) lacustrine shales, type I/II, TOC: 7%, Ro: 1%-2.4%, HI: 100-890 mg/g, S2: 13 mg/g, thickness: 70-1800 m | Lower Cretaceous Lucula Formation sandstones, porosity: 30%, permeability: 700 × 10-3 μm2; Barremian Toca Formation limestones, porosity: 16%- 20%, permeability: 600 × 10-3 μm2 | Lower Cretaceous mudstones and rock salt | |||
| Santos Basin | Post-salt (Upper Cretaceous, depression strata) pelagic mudstones, type II/III, TOC: 0.2%-2.5%, Ro: 0.5%-0.8%, HI: 30-295 mg/g, S2: 3- 12.9 mg/g, thickness: 200-1000 m | Upper Cretaceous turbidite sandstones: porosity: 20%-33%, permeability: (1000-4000) × 10-3 μm2 | Upper Cretaceous pelagic argillaceous shales | Lithologic traps | |
| Pre-salt (Upper Cretaceous, rift strata) lacustrine shales, type I/II, TOC: 2%-6%, HI: 900 mg/g, S2: 13 mg/g, thickness: less than 1500 m | Lower Cretaceous carbonate reservoirs, porosity: 5%-25%, average porosity: 16%, permeability: (1-2000) × 10-3 μm2 | Upper Cretaceous evaporitic salt rock | Structural- stratigraphic composite traps | ||
| Salt-free fault- depression- type basin | Tanzania Basin | Lower Cretaceous (depression strata) marine shales, type III, TOC: 1.78%-12.2%, Ro: 1.2%, HI: 129 mg/g | Paleocene-Miocene sandstones and Cretaceous sandstones, average permeability: 40 × 10-3 μm2, porosity: 10%-30%, average porosity: 23% | Paleogene-Neogene marine argillaceous shales and shales of the Upper Cretaceous Ruaruke Formation | Structural and stratigraphic traps |
| Jurassic (rift strata) neritic shales, type II/III, TOC: 0.3%-10%, non-maturity-over-maturity, HI: 40-1000 mg/g | |||||
| Faulted basin | Carnarvon Basin | Jurassic (rift strata) marine mudstones, type II/III, TOC: 2.2%-13.9%, Ro: 0.6%-1.6%, HI: 100-600 mg/g, S2: 9-11 mg/g, thickness: 800 m | Middle-Lower Jurassic reservoirs, porosity: 11%-35%, permeability: (20-5000) × 10-3 μm2 | Jurassic transgressive thick-bedded mudstones and Lower Cretaceous neritic shales | Stratigraphic- lithologic trap |
The lacustrine/marine source rocks formed during the rifting stage are mainly distributed in two types of basins, namely, faulted and fault depression basins. These source rocks are also present in the lower narrow-rift sequences of salt-free (transformed) depression-type basins, but the distribution range is limited. If delta reformed basins and inverted basins were of faulted type or fault-depression type before reformation, rifting-stage source rocks would exist in these two types of basins.
The lacustrine source rocks formed during the rifting stage are mainly distributed in the passive margin basins on both sides of the South Atlantic Ocean. During the rifting stage, rifting occurred within the continent, which is similar to the case of the present-day East African Rift. Due to the warm climate near the equator, abundant sediment supply along the periphery, and the closed anoxic environment of the faulted lake basin, the algae-rich organic matter was preserved. These lacustrine source rocks are among the source rocks of best quality in the world, which were distributed in a north-south intracontinental faulted lake basin during the rifting stage, and the main types of kerogens in these rocks are type I and type II. The source rocks of the Lower Cretaceous Melania Formation in the Gabon Coastal Basin in West Africa belong to this suit of lacustrine source rocks, with average TOC (total organic carbon) of 6.1%, maximum TOC of 20%, average content of chloroform bitumen “A” ranging from 0.072% to 0.365%, and an average SPI (Source-Potential Index) value of 46 t/m2. 95% of the crude oil found in the basins along the east coast of Brazil comes from this suite of lacustrine source rocks, whose TOC mainly ranges from 5% to 12%, with a maximum of 24.5%.
The marine source rocks formed during the rifting stage are mainly distributed in the basins on the Indian Ocean periphery and in the North Atlantic Ocean and the Eastern Mediterranean. Rifting occurred at the periphery of the continent, making the communication with seawater and the deposition of marine sediments easier. For example, during the intracontinental rifting stage from the Early Jurassic to the Middle Jurassic, the North West Shelf had been situated at the southern margin of the Paleo-Tethys Ocean, and organic-rich argillaceous shales were formed in faulted ocean basins such as the Bonaparte Basin and the Northern Carnarvon Basin. These shales contain type II and type III kerogens and mainly generate gas, with TOC ranging from 2.2% to 13.9%. They are the main source rocks in large gas fields.
Besides faulted passive margin basins, the marine source rocks formed during the early drift stage are also widely distributed in the other six subtypes of basins. These source rocks were mainly formed in the early drift stage as the sea level of the narrow ocean rose. Unlike the source rocks formed in the rifting phase, these source rocks are widely distributed in continental slope zones and even continental uplift zones. For example, the Early Jurassic Tithonian source rocks in the basins in the Gulf of Mexico and on its periphery are such source rocks, which are distributed outside the range of the oceanic crust. The main type of kerogen is type II, the TOC generally ranges from 0.5% to 5.0%, with a maximum of 16%, and the hydrogen index (HI) generally ranges between 200 and 800 (mgHC/gTOC). These rocks mainly generate oil and are the most important source rocks in depression-type basins, delta reformed basins, and inverted basins.
The deltaic source rocks formed during the late drift stage can mature and effectively supply hydrocarbons only in delta reformed (passive margin) basins. It has been confirmed that the oil and gas discovered in five delta basins (the Niger Delta Basin, the Nile Delta Basin, the Rovuma Basin, the Lower Congo Basin, and the McKinsey Basin), it has been found that oil and gas mainly originate from pre-deltaic argillaceous shales. Taking the Niger Delta Basin as an example, the TOC of the source rocks in this basin generally ranges from 0.2% and 6.5%, with an average of 2.6%, and their SPI value (S1 + S2) is 7.5 kg/t, indicating that they are good-excellent source rocks.
4.2. Reservoir-seal assemblages
The passive margin basin considered herein has undergone the vertical stacking of three prototype basins. Therefore, lithofacies change rapidly, resulting in the formation of many types of reservoir rocks and cap rocks in large oil and gas fields, and multiple types of reservoir-seal assemblages have been formed within the strata in the vertical direction [22].
It has been confirmed that the reservoir rocks of large oil and gas fields are of various types. These reservoir rocks can be classified into the following three major types: fluvial-deltaic sandstone, (micro) biogenic limestone and bioclastic oolitic limestone in the high-energy zones of shallow-water carbonate platforms, and gravity- flow gravely sandstone (carbonate rock). The main types of cap rocks include rock salt, gypsum, and argillaceous shale. In the discovered recoverable reserves of oil and gas, the oil and gas reserves in fluvial-deltaic sand bodies, gravity-flow gravely sandstones, and shallow-water carbonate rocks account for 37%, 35%, and 28%, respectively.
The reservoir-seal assemblages in large oil and gas fields in various types of passive margin basins have different characteristics (Table 4 ). For faulted basins in areas such as the northwestern margin of Australia, reservoir-seal assemblages consisting of fluvial-deltaic sandstones and transgressive shales are the major type of reservoir-seal assemblage, which include two types of assemblages, namely, assemblages composed of reservoir rocks and cap rocks within intracontinental-intercontinental rift sequences (such as the Lower-Middle Jurassic reservoirs in the Carnarvon Basin, which have porosity ranging from 11% to 35% and permeability ranging from 20 × 10-3 μm2 to 5000 × 10-3 μm2) and assemblages composed of reservoir rocks at top of rift sequences and cap rocks formed during the drift and depression stages (such as the Cretaceous reservoirs in the Browse Basin, which have porosity ranging from 7% to 27% and permeability ranging from 8 × 10⁻³ μm2 to 1000 × 10-3 μm2). The second type is more enriched with hydrocarbons. For salt-free faulted basins such as the Tanzania Coastal Basin, reservoir-seal assemblages consisting of gravity-flow sandstones and marine shales are the major type of reservoir-seal assemblage, all of which are located within the strata formed during the drift and depression stages. It is speculated that reservoir-seal assemblages also exist in faulted basins in the lower part.
However, these reservoir-seal assemblages have not been confirmed because they are deeply buried and difficult to explore. Two types of reservoir-seal assemblages have been formed in salt-bearing fault-depression basins such as the Santos Basin. The first type is the reservoir-seal assemblage formed by carbonates and evaporites at top of intracontinental-intercontinental rift strata. For these assemblages, the reservoir porosity ranges from 5% to 25%, the maximum thickness of a single pay zone is more than 400 m, and the overlying rock salt layer is stably distributed in the horizontal direction, with a length of 650 km from south to north, a width of 380 km from east to west, a large thickness, and a strong sealing capability. The second type is the reservoir-seal assemblage formed by gravity-flow sandstones and marine shales within the strata formed during the drift and depression stages. For these assemblages, turbidite sandstones are reservoir rocks, which have porosity ranging from 20% to 33% and permeability ranging from 1000 × 10-3 μm2 to 4000 × 10-3 μm2, and the Cretaceous (Aptian) rock salt and Paleogene marine argillaceous shale are cap rocks. In salt-free (transformed) depression-type basins such as the Côte D’Ivoire Basin, most reservoir-seal assemblages are composed of turbidite sandstones and marine shales formed during the depression stage, and a few assemblages are formed by carbonates and marine shales. All reservoir-seal assemblages in salt-bearing depression-type basins such as the Senegal Coastal Basin are located within the strata formed during the depression stage. However, due to the existence of rock salt and carbonate rocks, these assemblages are of various types, including both assemblages formed by gravity-flow sandstones and rock salt and those formed by gravity-flow sandstones and marine shales. As the extent of exploration increases, reservoir-seal assemblages consisting of reef-shoal complexes and marine shales or tight limestones will definitely be found. Taking the Miocene turbidite sandstones and Upper Cretaceous (Maastrichtian) sandstones as examples, the Upper Cretaceous clastic reservoirs comprise few mudstone interlayers and have porosity of up to 35% and permeability of hundreds of mD; as a potential reservoir, the Jurassic-Lower Cretaceous carbonate platform has high porosity ranging from 10% to 23%. Delta reformed basins are the most complex type. Taking the Niger Delta Basin as an example, the reservoir-seal assemblages in this basin are all located within the deltaic strata formed during the late drift stage, the well-developed reservoir-seal assemblages formed by deltaic sandstones and transgressive shales are located in the growth fault zone of the inner ring, and all of the reservoir-seal assemblages in the plastic diapirism zone of the inner ring, the thrust and fold belt of the outer ring, and the foredeep gentle slope zone are composed of gravity-flow sandstones and marine shales with porosity ranging from 22% to 32% and permeability ranging from 500 × 10-3 μm2 to 1000 × 10-3 μm2. The reservoir-cap combination of the reverse reformed basin is exactly the same as that of the pre-reformation basin. The types of the reservoir-seal assemblages in inverted basins are completely identical with those formed before the reformation of such basins.
4.3. Types of the traps
The traps in different types of passive margin basins vary greatly in type (Table 4 ), especially in the Northern Gulf of Mexico, where both rock salt and highly constructive deltaic basins are formed. In such basins, various types of traps that are favorable for hydrocarbon accumulation can form under the action of gravity-induced detachment and plastic diapirism. The three major types of traps are structural traps, lithologic traps, and structural-lithologic composite traps. The available exploration results show that the oil and gas reserves in these three major types of traps account for 39%, 35%, and 26% of the total reserves of oil and gas stored in traps. Structural traps mainly include anticlines, faulted anticlines, fault noses, fault blocks, anticlines penetrated by rock salt, post-salt drape anticlines, salt pillows, and turtle anticlines; lithologic traps mainly include updip pinch-outs and lenses; structural-lithologic composite traps are traps formed under the combined effects of structural and lithologic factors [22].
The specific types of traps in various types of passive margin basins are described below. In faulted passive margin basins, besides structural traps similar to those in rift basins (such as rollover anticlines and fault blocks), there are more structural-stratigraphic traps associated with regional unconformities resulting from thermal uplift caused by intense magmatic activities during the intercontinental rifting stage.
In salt-free fault-depression basins, drilling can only reveal the reservoir-seal assemblages within the strata formed during the depression stage due to large sediment thickness of the strata. Therefore, in addition to the lithologic traps and fault-lithologic composite traps related to deepwater gravity-flow sandstones, attention should also be paid to the structural traps and structural-stratigraphic traps in the lower undrilled rift sequence that are similar to those in faulted basins.
In salt-bearing fault-depression basins, large oil and gas fields are mainly concentrated in the carbonate sequences of post-salt drape anticlines, and in the pre-salt section, hydrocarbons are mainly concentrated in the lithologic traps and fault-lithologic composite traps related to gravity-flow sand bodies.
In salt-free (transformed) depression-type basins, hydrocarbons are mainly concentrated in lithologic reservoirs controlled by gravity-flow sand bodies in the strata formed during the depression stage, and the structural traps related to intracontinental rift sequences and carbonate traps in paleo-uplift zones related to transition formations also have favorable conditions for hydrocarbon accumulation.
Due to the existence of rock salt and carbonate rocks, the types of traps in salt-bearing (extensional) depression-type basins are complex. Composite reservoirs related to salt structures and gravity-flow sand bodies and lithologic traps formed by gravity-flow sand bodies below the steep slopes of carbonate platforms have been proven to be the two most important types of traps. In the future, the stratigraphic traps formed by reef-shoal complexes on carbonate platforms should also be explored.
The types of traps in delta reformed basins are most complex, and the reservoirs in various structural zones are of different types. Taking the Niger Delta Basin as an example, the large oil and gas fields in the growth fault zone of the inner ring are mainly concentrated in structural traps such as rollover anticlines, faulted anticlines, fault noses, and fault blocks; the lithologic traps formed by gravity-flow sand bodies are the major type of trap in the plastic diapirism zone; compressional anticlinal traps are the main type of trap in the thrust and fold belt of the outer ring; the lithologic traps formed by gravity flow channel-fan systems are the main type of trap in the foredeep gentle slope zone. If rock salt occurs, the types of reservoirs in the middle ring can be much more complex. In addition to the lithologic reservoirs (traps) related to gravity-flow sand bodies in secondary sags resulting from salt tectonics, there are also other types of reservoirs related to salt tectonics, such as puncture anticlines, drape anticlines, salt pillows, and turtle anticlines.
The traps in inverted basins are related to both the types of these basins before reformation and the extent of reformation. For example, on the landward side of the Tampico-Misantla Basin, the Veracruz Basin, and the Sureste Basin on the southwestern periphery of the Gulf of Mexico, the compressed structure underwent moderate inversion, and the reservoirs formed by compressional anticlines are therefore the main type of reservoir; as the structure extended eastward into deep water, the environment gradually transformed into an extensional tectonic setting, providing the same conditions for the formation of traps as the surrounding unreformed basins.
5. Favorable exploration areas in the future
In general, global deepwater oil and gas exploration is still in the stage of risk-taking exploration with a very low extent of exploration and is characterized by imbalance[22-23]. Favorable offshore exploration areas differ from one another in terms of basin location, source-reservoir-seal assemblage favorable for hydrocarbon accumulation, and the scale of oil and gas resources. In this paper, the favorable areas for deepwater oil and gas exploration in the future are systematically investigated based on a statistical analysis of more than 1300 deepwater oil and gas fields discovered around the world and the geological characteristics and resource potential of deepwater oil and gas reservoirs in various offshore areas.
5.1. Eastern and western coasts of the Atlantic
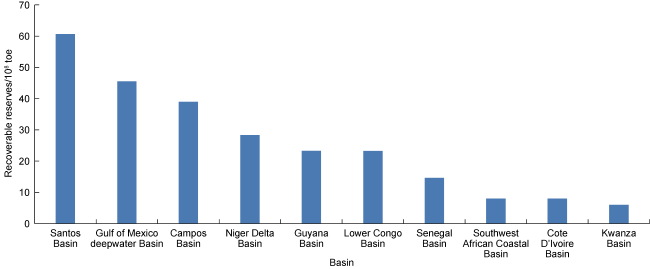
The eastern and western coasts of the Atlantic are the areas with the largest number of deepwater oil and gas discoveries and the largest reserves in the world [22]. By the end of 2022, 998 deepwater oil and gas fields had been discovered, with total oil and gas reserves of 283 × 108 toe. These deepwater oil and gas fields account for 73% of the total number of deepwater fields discovered around the globe, and the oil and gas reserves in these fields account for 70% of the world’s total deepwater oil and gas reserves (Table 5 ) [24]. The top ten basins ranked by discovered oil and gas reserves include the Santos Basin, the Gulf of Mexico deepwater basin, the Campos Basin, and the Niger Delta Basin (Fig. 4 ) [24]. Most of the aforementioned basins have been explored to low-medium extents and have huge resource potential. The extents of research, understanding and exploration of the eastern and western coasts of the South Atlantic are higher than those of the coasts of the Mid-Atlantic and the North Atlantic.
Table 5. Statistical table of deepwater oil and gas fields discovered in various regions around the world |
| Region | Number of oil and gas fields | Recoverable reserves/ 108 toe | Proportion of oil and gas reserves/%① | Number of large oil and gas fields | Time of discovery | Recoverable reserves/ 108 toe | Proportion of oil and gas reserves/%② | |
|---|---|---|---|---|---|---|---|---|
| Eastern and western coasts of the Atlantic | 998 | 283.00 | 70 | 93 | 1984-2022 | 171 | 60 | |
| Indian Ocean periphery | East African waters | 30 | 41.00 | 10 | 11 | 2010-2013 | 37 | 90 |
| Eastern periphery of the Indian Ocean | 154 | 25.00 | 6 | 6 | 1971-2006 | 10 | 41 | |
| Arctic Ocean periphery | 1 | 0.02 | 0 | |||||
| Western Pacific Coast | 112 | 14.00 | 3 | 2 | 1989, 2003 | 2 | 12 | |
| Remnant Tethys Ocean Basin | 79 | 43.00 | 11 | 11 | 1999-2021 | 33 | 76 | |
Notes: ① The ratio of the oil and gas reserves of deepwater oil and gas fields discovered in each offshore area to the total reserves of deepwater oil and gas fields; ② The ratio of the oil and gas reserves of large deepwater oil and gas fields discovered in each offshore area to the total reserves of deepwater oil and gas fields discovered in the offshore area. |
Fig. 4. Histogram of the oil and gas reserves of deepwater oil and gas fields discovered in the top ten basins on both sides of the Atlantic. |
There are various types of basins on both sides of the South Atlantic Ocean, which can be subdivided into the southern, middle, and northern sections. The degree of hydrocarbon accumulation varies greatly from one section to another. The middle section is dominated by salt-bearing fault-depression basins where hydrocarbons are most highly concentrated. These basins have the greatest resource potential. Basins such as the Santos Basin, the Campos Basin, and the Kwanza Basin will still be the key targets of deepwater oil and gas exploration in the future. Post-salt deepwater gravity flow deposits and pre-salt carbonate assemblages have broad prospects for successive major oil and gas discoveries [10,22]. The southern section is dominated by faulted basins. Currently, the deepwater exploration activities in this section are limited to Southwest African waters and the periphery of the Falkland Islands. It has been confirmed that the traps related to the top structure of the Lower Cretaceous rift sequence are hydrocarbon-rich and have good prospects for exploration. In addition, two large discoveries, namely, the Venus and Graff oil discoveries, were first made in the Lower Cretaceous basin-floor fan sandstone reservoirs in the deep water of the Southwest African Coastal Basin in 2022 [25], revealing new exploration areas with great prospects. The northern section is dominated by salt-free depression-type basins, and it has been less explored than the middle and southern sections. The range of distribution of rift sequences in such basins is relatively small. The Upper Cretaceous channel-fan depositional systems formed during the drift stage should be the favorable exploration targets. The main favorable exploration areas include the Côte D’Ivoire Basin, the Benin Basin, the Guyana Coastal Basin, the Suriname Basin, and the French Guiana Coastal Basin. Salt-bearing depression-type passive margin basins are dominant on both sides of the Mid-Atlantic. These basins have similar conditions for hydrocarbon accumulation. The extent of exploration in this area is generally low, except for the Gulf of Mexico. Only a small number of wells have been drilled in deep water, and most of these wells are located in the continental shelf region. The analogous study shows that Jurassic-Early Cretaceous carbonate platforms were formed in the basins on both sides of the Mid-Atlantic during the early depression stage and submarine fans had been developing very well along the steep slope fronts of carbonate platforms since the Late Cretaceous. It is speculated that the Cretaceous submarine fans and Paleogene-Neogene lithologic associations have the greatest exploration potential. In addition, the Jurassic-Lower Cretaceous carbonate facies zone is also a favorable future exploration target. Faulted passive margin basins are dominant on both coasts of the North Atlantic Ocean. In the Vøring Basin, Møre Basin, Faroe-West Shetland Basin, and Ssese Islands Basin on the eastern coast, 43 deepwater oil and gas fields have been discovered, with recoverable oil and gas reserves of 6.5 × 10⁸ toe. Marine argillaceous shales (serving as cap rocks) formed during the drift and depression stages are widely distributed in the deepwater zone along the western coast. The Jurassic- Cretaceous fault-block structures and structural-lithologic associations on the east coast of Greenland have good prospects for exploration.
5.2. Indian Ocean periphery
During the period from 1971 to 2010, deepwater oil and gas exploration activities around the Indian Ocean were mainly concentrated in Indian waters on the eastern periphery and along the North West Shelf of Australia, and six large deepwater oil and gas fields were discovered. The subsequent new discoveries made through exploration are mainly small oil and gas fields, and the exploration activities performed in East African waters on the western periphery during this period are very limited. In 2010, the giant gas field Prosperidade was discovered in the deep water of the Rovuma Basin. Since 2010, 30 gas fields have been discovered in the deep waters of Kenya, Tanzania, and Mozambique in East Africa, with recoverable gas reserves of 41 × 108 toe. Among these gas fields, 11 fields are large gas fields with recoverable gas reserves of 37 × 108 toe [24]. East African waters have become an emerging deepwater field rich in natural gas and an important new domain that will play a leading role in increasing natural gas reserves in the future.
East African waters are located on the western periphery of the Indian Ocean, where the following three types of passive margin basins are well-developed: faulted basin, salt-free fault-depression basin, and delta reformed basin. Currently, the extent of exploration in East African deep waters is still very low [22], and deepwater oil and gas discoveries are mainly concentrated in the Rovuma Basin and the Tanzania Basin [23]. The deepwater gravity flow channel-slope fan systems are most enriched in hydrocarbons. The Somali Basin, the Morondava Basin, and the Mahajanga Basin are faulted passive margin basins, where no exploration breakthroughs have been made. The structural traps in the rift sequences of these basins are the main favorable exploration targets [22]. Jurassic rock salt is well-developed in the Mahajanga Basin. In addition to the structural assemblages in pre-salt rift sequences, carbonate reef-shoal complexes are also worthy of attention. The Tanzania Basin is a salt-free fault-depression (passive margin) basin, and the structural traps in its rift sequences and the traps in depression zones related to gravity-flow sand bodies are all favorable exploration targets. It has been confirmed by drilling that the structural-lithologic composite traps in the south-north trending offshore shear zone are hydrocarbon-rich. Future exploration targets include the lithologic traps in the upper and lower slope zones and the carbonate reefs formed during the transition stage [22]. Delta reformed (passive margin) basins include the Rovuma Basin, the Lamu Basin, and the Mozambique Coastal Basin, and the four annular zones are all favorable exploration targets. The extents of exploration in the deepwater and ultra-deepwater zones of the Rovuma Basin are relatively high. Gas-rich zones have been discovered in the foredeep gravity-flow sand bodies. These zones involve low exploration risks and are therefore reliable areas for increasing oil and gas reserves and production. In addition, large gas fields have been discovered along the fold and thrust belt in the outer annular zone. This belt has considerable exploration potential. As predicted based on studies, four large annular hydrocarbon accumulation zones may have been formed in deep water in the northern part of the offshore Paleocene-Miocene Lamu Delta of the Lamu Basin [22]. The sediment thickness can reach 12 000 m in the Mozambique Coastal Basin, especially the northern offshore area of the basin, which is comparable to the thickness of sediments deposited in the Niger Delta Basin in West Africa. The deepwater deltaic sandstones and foredeep gravity-flow sand bodies are favorable exploration targets.
5.3. Arctic Ocean periphery
The Arctic Ocean periphery is dominated by faulted passive margin basins. Due to reasons such as harsh natural conditions and ownership, these basins have been studied and explored to very low extents. The discovered oil and gas fields are mainly distributed in the East Barents Sea Basin, the Barents Sea Platform Basin, and the Sverdrup Basin. Only one small deepwater oil and gas field has been discovered in the Sverdrup Basin up to now [24]. The deepwater basins around the Arctic Ocean contain abundant oil and gas resources. The undiscovered oil and gas resources in these basins are predicted to exceed 300 × 108 toe [26]. Regional geological studies [22,27⇓⇓⇓ -31] show that a series of back-arc extensional-foreland basins were formed in this region during the period from the Late Paleozoic to the Late Cretaceous, and in the Late Cretaceous, this region entered the rift-transition-drift- depression evolution stage, during which passive margin basins were formed. In the vertical direction, multiple suites of favorable source rocks are connected by faults formed in the rifting phase, creating favorable assemblages together with the large structure traps formed in the rifting phase. These assemblages have great exploration potential and provide favorable conditions for the formation of large reservoirs. The future exploration prospects of the Jurassic-Neogene assemblages in the East Barents Sea Basin, the Barents Sea Platform Basin, and the Kara Sea are worthy of special attention.
6. Recommendations for expanding overseas oil and gas exploration business
The extent of exploration is generally low in offshore areas around the globe, and the undiscovered offshore oil and gas resources account for about 43% of the total undiscovered resources of the world. In this paper, several recommendations for developing new deepwater exploration projects are made based on the follow-up studies conducted in recent years.
6.1. Expanding the channels for acquiring multiuser seismic data and improving the level of scientific selection of deepwater exploration areas.
Currently, the evaluation and study of new overseas deepwater projects are mainly based on the analysis and comparison of secondary data such as public documents and commercial databases, and there is a lack of primary data, especially seismic data. The seven major international oil companies usually conduct preliminary selection of exploration blocks by reviewing multiuser seismic data and then purchase seismic data for detailed evaluations. The annual expense for reviewing offshore multiuser seismic data ranges from 3 to 5 million US dollars (USD), and the annual expense for purchasing seismic data can reach USD 50 million. To avoid following international oil companies in the evaluation of new projects under a cooperation framework, Chinese oil companies need to actively expand the channels for acquiring multiuser seismic data, establish annual exploration funds to purchase multiuser seismic data, strengthen cooperation with multiuser seismic data acquisition companies such as TGS and ION, and establish cooperation mechanisms for on-demand data review in order to preselect deepwater exploration areas in a more targeted and timely manner and provide first-hand data for the scientific selection and evaluation of favorable exploration areas.
6.2. Strengthening efforts to acquire deepwater exploration and development projects in key areas such as the eastern and western coasts of the South Atlantic Ocean, East Africa, and the Arctic Ocean and accelerating the process of business arrangement for global deepwater oil and gas exploration
Characterized by favorable conditions for hydrocarbon accumulation, low extent of exploration, and great exploration potential, the large deepwater oil and gas fields around the world have become the major fields for making large oil and gas discoveries. Therefore, continuously expanding deepwater oil and gas exploration business is the inevitable choice. Chinese oil companies should make prior arrangements for deepwater oil and gas exploration and strengthen efforts to acquire exploration blocks with a focus on the three deepwater regions, namely, the eastern and western coasts of the South Atlantic Ocean, East African waters, and the western coast of the Arctic Ocean.
In recent years, oil and gas discoveries have been made successively in Brazil, Guyana, Suriname, and South Africa on both sides of the South Atlantic Ocean. So far, two assemblages, namely, the pre-salt carbonate rock assemblage and the post-salt deepwater slope fan assemblage, have been confirmed. The first assemblage is characterized by large reserves and high single-well production. In 2023, the Brazilian National Agency of Petroleum, Natural Gas and Biofuels (ANP) promulgated new administrative measures for block contracting and bidding, announcing the initiation of permanent bidding for 561 blocks in 10 offshore basins without limit on the deadline for submission of bids. In addition, Argentina, Suriname, and other countries will also invite bids for new offshore blocks. Argentina has the opportunity to negotiate bids in cooperation with YPF for early entry into new blocks. In East African waters, there are three passive margin basins, namely, the Rovuma Basin, the Mozambique Basin, and the Somali Basin. Among these basins, the Rovuma Basin has been explored to the largest extent, and multiple submarine fans with total recoverable reserves of 4.28×10¹² m3 have been discovered in the basin. The geological conditions of the other two basins are generally similar to those of the Rovuma Basin. No well has been drilled in the other two basins, but these two basins have great exploration potential. It is recommended to strengthen efforts to acquire deepwater blocks in the aforementioned areas and enter the few large frontier basins in the world at the lowest cost by undertaking exploration projects in order to consolidate resources and provide a solid foundation the development of deepwater oil and gas exploration business.
6.3. Entering and exiting exploration blocks flexibly by multiple means
International oil companies already started to engage in overseas offshore oil and gas exploration business 40 years ago. Their business scope is very wide, and they have made business arrangements in frontier exploration fields and hotspots. In terms of entry methods and strategies, international oil companies usually acquire exploration blocks in batches by multiple means such as negotiation, bidding, and equity participation. Bidding is the main means of entry into exploration blocks, and the blocks entered by means of bidding account for 60.3%. Entering and exiting blocks flexibly is a common practice adopted by international oil companies to carry out cross-border exploration activities. After obtaining exploration blocks, they will exit the blocks in due course if the exploration results are not as good as expected. Since the 1970s, international oil companies have acquired a large number of exploration blocks in offshore areas, especially the eastern and western coasts of the Atlantic, East African waters, and North African waters, but they exited most of these blocks before exploration breakthroughs were made. Apart from unsatisfactory geological conditions, the reasons for exit also include the limitations posed by the quality of seismic data, technologies for identifying sand bodies, and geological understanding. After breakthroughs in geological understanding and exploration and development technologies are made, international oil companies may re-enter the blocks that they have exited if such re-entry is consistent with their development strategies. ExxonMobil’s re-entry into the Guyana Basin and Eni’s re-entry to the Côte D’Ivoire Basin are good examples of such practice.
6.4. Acquiring blocks as large equity holders and operate blocks under the “dual exploration model”
In terms of business strategy, most international oil companies enter exploration blocks as large equity holders (35%-100%). After oil and gas discoveries are made, they operate and manage their exploration blocks under the “dual exploration model”, sell some shares, and thereby recover costs rapidly and gain considerable economic benefits before the initiation of oil/gas production. For example, Eni acquired 74 deepwater blocks around Africa through bidding, with a total area of 38 × 104 km2. After discovering the Zohr gas field in the deep water of Egypt, Eni transferred 50% of its equity shares and retained 50% of its shares for gas field development. By doing so, Eni not only quickly recovered the investment of about USD 300 million made by it in the exploration phase, but it also realized a net profit of USD 2.7 billion. Eni’s practice has become a paradigm of the “dual exploration model”. Such practice not only allows oil compa-
nies to recover costs quickly, but it can also enable exploration projects to generate great economic benefits before they are put into operation.
6.5. Strengthening cooperation with leading international oil companies having advanced deepwater technologies in asset transactions to improve the technical level and increase the oil and gas reserves of exploration blocks
The leading oil companies in the field of global deepwater oil and gas exploration include major international oil companies such as Eni, Shell and Equinor, small and medium-sized independent oil companies such as Tullow Oil, Nobel Energy and Ophir Energy, and national oil companies represented by Petrobras and Petronas. There are three optional methods to enter exploration blocks. The first option is to enter exploration blocks with oil and gas discoveries and great exploration potential through asset swaps. The second option is to enter unexplored blocks with great potential by paying historical exploration costs. The third option is to follow Shell’s practice in its acquisition of bp and acquire small independent oil companies which are in financial distress and whose stock prices are low and volatile (such as Ophir Energy and Cobalt Energy). These methods can rapidly improve the levels of technologies and equipment for deepwater exploration blocks and accelerate the development of offshore oil and gas exploration business.
6.6. Improving business operation capabilities and gradually transforming from “non-operators” to “operators”
Block operators have the right to speak in oil and gas exploration and the space for flexible business operations, which is favorable for them to gain benefits from exploration activities. China’s three major oil companies started to engage in the deepwater oil and gas exploration business in 2005, successively acquired 32 exploration and development projects in 14 countries including Australia, Myanmar, and Brazil, and achieved preliminary results in the operation of some deepwater projects, such as the rapid increase in oil and gas reserves and production of the projects in Angola and Guyana, the remarkable exploration results of the Libra project in Brazil, and the highlights in large-scale exploration of the Aram project. However, the three major Chinese oil companies participate in these projects as non-operators and small equity holders, which is not favorable for improving the level of deepwater operations and creating benefits from exploration activities. It is recommended to improve business operation capabilities, follow the operating model of international oil companies under which specialized engineering and technical service companies are hired to perform offshore exploration and development activities, cooperate with geophysical companies (such as CGG, TGS, and PGS) and the three major oilfield service companies (Transocean, Stena Drilling, and Noble Drilling), make continuous progress in the organization and management of deepwater oil and gas exploration activities, business operations, engineering technology, talent pooling and team building, and gradually transform from “non-operators” to “operators”.
7. Conclusions
Based on the process of change in new oil and gas reserves, the history of global offshore oil and gas exploration can be divided into the following three development stages: shallow-water development stage (from 1917 to 1976), deepwater development stage (from 1977 to 2009), and ultra-deepwater development stage (from 2010 to the present). The deepwater domain is currently the most important domain for carrying out global oil and gas exploration and increasing oil and gas reserves and production. Deepwater oil and gas discoveries are mainly distributed in the Gulf of Mexico, the eastern and western coasts of the Atlantic, East and North African waters, the Black Sea, the South Caspian Sea, the Bay of Bengal, the North West Shelf of Australia, and the South China Sea. Passive margin basins are the most important source of reserves of large oil and gas discoveries and additional reserves in deep waters, and oil and gas resources are mostly found in Mesozoic-Cenozoic lithologic reservoirs.
The seven major international oil companies are highly active in all aspects of deepwater oil and gas exploration and development and play a leading role in the development of global deepwater oil and gas exploration business. The strategies for deepwater oil and gas exploration include (1) taking the lead in the development of deepwater oil and gas exploration business, actively making arrangements for deepwater exploration blocks, and attaching importance to the participation in bidding for key areas; (2) prioritizing early entry into exploration blocks through bidding before oil and gas discoveries are made, and considering entry into exploration blocks through mergers and acquisitions at high prices after discoveries are made; (3) attaching importance to the accumulation of oil and gas exploration technologies and strengthening cooperation in the supply chain of technologies for deepwater oil and gas exploration; (4) adopting strategies that enable oil companies to take the lead or follow other companies in deepwater oil and gas exploration and share risks with other companies through extensive cooperation.
The favorable deepwater exploration areas around the world are mainly distributed along the eastern and western coasts of the Atlantic, the Indian Ocean periphery, and the Arctic Ocean periphery. Deep waters are key areas for oil companies to arrange for the implementation of their global oil and gas exploration strategies. In
this paper, the following recommendations for developing overseas oil and gas exploration business are proposed: (1) expanding the channels for acquiring multiuser seismic data and improving the level of scientific selection of deepwater exploration areas; (2) strengthening efforts to acquire deepwater exploration and development projects in key areas such as the eastern and western coasts of the South Atlantic Ocean, East Africa, and the Arctic Ocean, accelerating the process of business arrangement for global deepwater oil and gas exploration; (3) entering and exiting exploration blocks flexibly by multiple means; (4) acquiring blocks as large equity holders and operating blocks under the “dual exploration model”; (5) strengthening cooperation with leading international oil companies having advanced deepwater technologies in asset transactions to improve the technical level and increase the oil and gas reserves of exploration blocks; (6) improving business operation capabilities and gradually transforming from “non-operators” to “operators”.