

Introduction
Shale oil occurs in organic-rich shale strata and includes the hydrocarbon developed in interlayers of inner source siltstone, fine sandstone, carbonate rock, etc. [1-2] China has abundant shale oil resources which are mainly in medium-low maturity and medium-high maturity stages, and breakthroughs have been made successively in shale oil exploration and development. Production capacity construction of medium-high maturity shale oil has been completed initially in several exploration areas, including Gulong Sag in the Songliao Basin, Jimsar Sag in the Junggar Basin, and Longdong in the Ordos Basin [1⇓-3]. A factor limiting success in exploration and development of shale oil is mobile oil amount and mobility, which is affected by shale reservoir tightness and the shale oil occurrence states (adsorbed or free) [4]. It is generally believed that the adsorbed oil is hardly produced, and the free oil in the pore center is highly mobile. The free oil is mostly accessible and also a key parameter in evaluation of shale oil reserves [4⇓⇓⇓-8]. Therefore, quantification of adsorbed and free oil contents in shale reservoirs is of great significance for efficient shale oil exploration and development.
The free oil in conventionally cored shale is lost severely compared with that stored in the in-situ shale [9], and it is difficult to quantify the free oil content directly. Free oil amount can be calculated by subtracting the total oil amount of shale by the adsorbed oil amount which is stable relatively [10-11]. Efforts have been made previously in characterization of adsorbed oil amount of shale by experiments with improved Rock-Eval pyrolysis, solvent extraction, adsorption and 2D NMR (Nuclear Magnetic Resonance) [12⇓⇓⇓-16]. Nevertheless, shale oil sorption models are rarely reported. Research on organic matter (OM) adsorption has been carried out. In the 1960s, the USA Shell company Philippi studied hydrocarbon generation and migration firstly by applying the relationship between the extractable hydrocarbon amount of rock and the "non-carbonate carbon" amount, and believed that the extractable hydrocarbons in shale are mainly adsorbed by OM [17]. Swelling experiments were carried out to study the mechanism of hydrocarbon retention by OM and its quantitative evaluation [18⇓-20], and they are most about hydrocarbon expulsion from source rocks. In research on shale oil adsorption, Jarvie [21] proposed the recoverable evaluation index of OSI more than 100 mg/g based on learning from USA marine shale oil exploration. Some applied this index directly in study of hydrocarbon adsorption in shale. However, application of this index in China continental shale is not desirable [22]. LI et al. [23] and CAO et al. [24] developed a dual system integrating adsorption of kerogen and inorganic minerals, and established a method of calculating the adsorbed oil amount of shale by using the fixed adsorption oil coefficient of kerogen (80 mg/g) and the conversion model of pore-specific surface area of shale. Considering the difference of hydrocarbon occurrence in pores with different sizes and shapes, LI et al. [12] established an evaluation model of adsorbed oil amount based on the difference between density of adsorbed oil and free oil and the shale pore structure parameter. CUI et al. [25] proposed a Gaussian mixture mathematical model of predicting the adsorbed oil amount. In CUI’s model, TOC, the main factor of controlling oil adsorption in shale, was not considered [26]. In addition, the existing models are established according the results at room temperature, and prediction of adsorbed oil amount of shale under in-situ high temperature and high pressure conditions is rarely reported.
Currently, study on the shale oil adsorption model is still at the initial stage. Integrating adsorption of kerogen and minerals is a significant method of evaluating the adsorbed oil amount of shale. Different from the previous method of fixing the adsorbed oil capacity of kerogen and estimating the maximum adsorbed oil amount of minerals by LI et al. [23] and CAO et al. [24], a model of adsorbed oil amount of shale is proposed by considering kerogen thermal evolution, clay pore surface area occupied by oil in actual samples, formation temperature, etc. Taking the 1st member (Qing 1 Member) shale of Cretaceous Qingshankou Formation in northern Songliao Basin as an example, experiments of adsorption-swelling oil of kerogen with Ro of 0.83%-1.65% and adsorption oil of clay minerals separated from mud shale were carried out, and they were compared with previous study results. The evaluation charts of the adsorbing-swelling oil amount of kerogen and adsorbed oil capacity of minerals were established respectively. Additionally, the effects of temperature and pressure on adsorbed oil amount were explored by adsorption oil experiment at various temperatures and molecular simulation. The model is applied to evaluate the adsorbed oil amount of both the core samples at room temperature and the vertical continuous shale oil reservoirs under formation temperature and pressure conditions. The method and achievements are expected to provide a new insight for evaluating shale oil reserves and mobility.
1. Model and experiments
1.1. Model of the adsorbed oil amount of shale
Shale oil is retained in the kerogen as the adsorbed state on the organic pore surface, swollen state inside the kerogen skeleton and free state [18,27]. Both adsorbed and swollen oil is rarely mobile. Here, the shale oil on the organic pore surface and inside the kerogen skeleton is called as the adsorption-swelling oil or sorption oil of kerogen together, and both the adsorption-swelling oil of kerogen and the oil adsorbed on the mineral pore surface are named as the shale adsorbed oil.
With increase of thermal evolution degree, the OM generates hydrocarbon, and when the hydrocarbon amount exceeds the accommodation capacity of OM, the generated hydrocarbon expels the formation water into mineral pores. The clay minerals and pyrite pores accompanied by OM are near the hydrocarbon source, and provide the main space for oil and gas storage [28-29]. It is difficult to quantify the adsorbed oil amount in all shale pores due to various inorganic pore types. Here, the adsorption model is simplified by only considering the oil adsorbed in clay pores. The reasons are as follows. First, clay is the main mineral of continental shale in China. For example, a large number of clay pores are developed in Qing 1 Member shale in northern Songliao Basin and mainly contribute to the shale specific surface area [3,30]. Second, most minerals are water wet, and the wettability of clay is related to its type. In the long-term geological history, multi-valent cations on clay surface are likely to form complexes with the polar heavy components, resulting in wettability reversal [31-32]. Third, the adsorbed oil amount of clay is 18 mg/g, which is far higher than that of other minerals [23,33]. WANG et al. [26] proposed that the adsorbed oil amount of the calcareous mudstone of the Paleogene Shahejie Formation in the Jiyang Depression is higher than that of argillaceous limestone. The higher clay contents causes the higher adsorbed oil amount. Moreover, oil does not occur in all mineral pores which are restricted by connectivity.
Here, by integrating the adsorption-swelling oil amount of kerogen and the adsorbed oil amount of clay, the total adsorbed oil amount of shale (Qa) is quantified using Eq.(1). Among them, the adsorption-swelling oil amount of kerogen is calculated by the adsorption- swelling capacity of kerogen (Mk) and shale TOC value; the adsorbed oil amount of clay is calculated by the total surface area (Sc) of clay pores, and the adsorption oil amount per unit surface area of clay pores, which is the clay adsorption oil capacity (Mc) defined in this article, and the ratio of clay pore surface area occupied with adsorbed oil to total clay pore surface area (f).
${{Q}_{\text{a}}}=\frac{1}{100}TOC\text{ }{{M}_{k}}+{{S}_{c}}{{M}_{c}}f$
The key parameters in the model include Mk, Mc and f. Mk is calibrated by experiments of adsorption-swelling oil of kerogen as follows:
${{M}_{k}}=\frac{{{\rho }_{o}}\left( {{q}_{VO}}-1 \right)}{{{\rho }_{\operatorname{k}}}}\times 1000$
where qVO is obtained from the swelling oil model [34]:
${{q}_{\operatorname{VO}}}=K\frac{1}{\sqrt{2\pi }}\frac{1}{d}\exp \left[ -0.5{{\left( \frac{{{\delta }_{\text{o}}}-{{\delta }_{\text{k}}}}{d} \right)}^{2}} \right]$
$K=\frac{{{q}_{\text{V}}}}{\frac{1}{\sqrt{2\pi }}\frac{1}{d}\exp \left[ -0.5{{\left( \frac{{{\delta }_{\text{l}}}-{{\delta }_{\text{k}}}}{d} \right)}^{2}} \right]}$
${{\delta }_{\text{o}}}\text{=}\sum{{{W}_{i}}{{\delta }_{i}}}$
The maximum adsorbed oil amount of clay pores (qc) is measured in experiments of adsorbed oil of clay minerals. Mc is determined by dividing qc by the clay specific surface area (Ac) as follows:
${{M}_{\text{c}}}=\frac{{{q}_{\text{c}}}}{{{A}_{\text{c}}}}$
f is determined by the ratio of the actual adsorbed oil amount of clay in shale samples (Qac) to qc as follows:
$f=\frac{{{Q}_{ac}}}{{{q}_{\operatorname{c}}}}$
1.2. Experimental samples
1.2.1. Shale and kerogen samples
The study area is located in Cretaceous Qing 1 Member in northern Songliao Basin where typical continental shale oil is developed. In recent years, breakthroughs have been made successively, and a national demonstration area of shale oil development was established, showing promising prospects [3]. In this study, 42 samples of Qing 1 Member shale were selected, and 13 samples with Ro of 0.83%-1.65%, Type I and II1 OM, TOC of 1.41%-3.75%, and S1 of 1.21-4.39 mg/g were selected for kerogen enrichment. The mineral is dominated by clay with average content of 42.68% and quartz with average content of 23.15%, followed by pyrite and calcite with contents of less than 10% (Table 1 ). The TOC of kerogen is 37.15%-59.84%. Previous study shows that most OM in the shale are adsorbed on the clay mineral surface and filled in the pores, and the organic-clay complex has the stable properties [2,35]. This possibly causes the undesirable purity of enriched kerogen samples.
Table 1. Basic geochemical parameters and mineral components of Qing 1 Member shale in northern Songliao Basin |
| Sample No. | Ro/ % | Type | TOC/ % | S1/ (mg·g-1) | S2/ (mg·g-1) | Contents of major minerals/% | Specific area/ (m2·g-1) | Kerogen TOC/% | Kerogen specific area/ (m2·g-1) | |||||
|---|---|---|---|---|---|---|---|---|---|---|---|---|---|---|
| Clay | Quartz | Plagioclase | Calcite | Dolomites | Pyrite | |||||||||
| 1 | 0.83 | I | 2.67 | 1.60 | 15.85 | 14.9 | 12.5 | 4.0 | 0 | 60.4 | 5.1 | 3.48 | 59.84 | 3.18 |
| 2 | 0.91 | II1 | 1.65 | 1.32 | 7.18 | 50.1 | 23.6 | 13.9 | 2.4 | 0 | 5.4 | 31.54 | 40.15 | 5.19 |
| 3 | 0.94 | II1 | 2.45 | 1.87 | 13.28 | 20.7 | 8.1 | 2.1 | 0 | 61.3 | 3.4 | 9.68 | 53.28 | 0.55 |
| 4 | 1.05 | II1 | 1.41 | 1.24 | 5.23 | 52.9 | 21.5 | 13.2 | 1.1 | 6.4 | 2.7 | 33.75 | 46.19 | 17.55 |
| 5 | 1.07 | II1 | 1.88 | 1.86 | 7.15 | 48.4 | 24.8 | 20.0 | 0 | 0 | 4.3 | 24.25 | 44.71 | 1.66 |
| 6 | 1.15 | I | 2.40 | 2.22 | 10.14 | 45.7 | 28.1 | 14.4 | 2.5 | 4.7 | 4.6 | 18.80 | 43.72 | 3.63 |
| 7 | 1.21 | II1 | 1.68 | 1.43 | 3.47 | 41.8 | 24.4 | 15.5 | 5.4 | 0 | 5.9 | 33.54 | 45.66 | 40.47 |
| 8 | 1.24 | II1 | 2.61 | 3.65 | 8.73 | 47.8 | 30.2 | 8.5 | 5.8 | 1.7 | 3.4 | 29.14 | 58.21 | 52.86 |
| 9 | 1.30 | II1 | 2.44 | 2.90 | 5.27 | 48.3 | 22.9 | 15.8 | 0 | 7.6 | 5.4 | 34.08 | 37.15 | 25.47 |
| 10 | 1.37 | II1 | 3.75 | 4.39 | 5.50 | 51.4 | 25.9 | 10.3 | 6.7 | 0 | 5.7 | 34.65 | 50.83 | 60.12 |
| 11 | 1.53 | I | 2.18 | 2.87 | 4.07 | 42.9 | 28.2 | 22.8 | 0.4 | 0 | 3.5 | 22.74 | 43.88 | 37.82 |
| 12 | 1.54 | I | 2.11 | 1.47 | 4.32 | 44.4 | 25.9 | 17.0 | 2.9 | 1.6 | 3.3 | 23.10 | 44.47 | 51.79 |
| 13 | 1.65 | II1 | 1.85 | 1.21 | 1.61 | 45.6 | 24.8 | 13.4 | 0 | 8.4 | 5.2 | 32.74 | 43.52 | 74.92 |
Low temperature nitrogen adsorption experiments show that the shale pore specific surface area is 3.48-34.65 m2/g, with an average of 25.50 m2/g, and it is positively correlated to the clay mineral content. The specific surface area of kerogen is 0.55-74.92 m2/g, with an average of 28.86 m2/g. The specific surface area of kerogen increases with increase of Ro. When Ro is greater than 1.3%, the organic pore scale increases accompanied by light hydrocarbon cracking [36], and the specific surface area of kerogen is larger than that of shale.
1.2.2. Clay samples
No. 2, 8, 10 and 13 shale samples were selected to separate the pure clay by hydrostatic water sedimentation. The mineral components and specific surface area parameters of clay samples are listed in Table 2 . The separated clay samples have the clay content higher than 60%, followed by quartz with the content of about 1/4. Clay is dominated by illite/smectite formation, with a small amount of chlorite. The specific surface area of clay sample is 36.33-47.23 m2/g, which is higher than that of corresponding shale, indicating that clay pores mainly contribute to shale pore specific surface area.
Table 2 Mineral components and specific surface area of clay samples |
| Sample No. | Major mineral components/% | Relative clay mineral amount/% | Specific area/ (m2·g-1) | ||||
|---|---|---|---|---|---|---|---|
| Clay | Quartz | Plagioclase | Pyrite | Illite/ smectite | Illite | ||
| 2 | 60.0 | 24.6 | 9.3 | 3.3 | 40 | 55 | 47.23 |
| 8 | 65.2 | 28.6 | 6.2 | 0 | 44 | 40 | 36.33 |
| 10 | 61.9 | 27.7 | 7.8 | 2.6 | 38 | 45 | 38.32 |
| 13 | 68.0 | 20.6 | 8.9 | 2.5 | 34 | 56 | 42.94 |
1.3. Main experimental methods
1.3.1. Experiments of adsorption-swelling oil of kerogen
A total of 104 experiments of swelling oil were carried out with 13 kerogen samples at various maturity stage and 8 organic solvent samples. The experiments were carried out with following steps. (1) Pick a dry and clean glass tube with open ends. (2) Stack and compact the high-purity quartz cotton at the tube bottom, use a spoon to send the kerogen sample to the tube bottom, and prevent kerogen adherence on the inner wall of the tube. Use a glass rod to tamp the kerogen sample and centrifuge it for 20 min at a speed of 8000 r/min. After centrifugation, measure the kerogen height with electronic vernier caliper for several times, and calculate the average and record it as H1. (3) The tube is immersed vertically in the organic solvent, and when bubbles are observed, knock the tube wall slightly to escape bubbles. Referring to previous learning [19,37⇓⇓⇓ -41], the immersion duration is set as 24 h. Centrifugation is operated again after immersion, and the kerogen height is recorded as H2. The centrifugation speed is set here by checking when the change of the kerogen mass is stable.
The kerogen swelling ratio is calculated with the change of kerogen height before and after being immersed in solvent (qV):
${{q}_{\text{V}}}=\frac{{{H}_{2}}}{{{H}_{1}}}$
The organic solvents of N-octane, xylene, 2-methylthiophene, cyclohexanone, n-octanol, pyridine, ethanol and formic acid were selected, including alkane, benzene, ketone, alcohol, acid and non-hydrocarbon components. The solubility of saturated, aromatic and non-hydrocarbon asphaltene reported previously [34] is covered in this study.
The experiments of adsorption-swelling kerogen are operated with above procedures. A quartz tube with kerogen at the bottom is immersed vertically in an organic solvent and is placed in ovens at various temperatures for 24 h, and then, the quartz tube is taken out and is centrifuged at room temperature.
1.3.2. Experiments of oil adsorption of clay
Experiments of oil adsorption by clay were carried out in Shimadzu UV-2450 ultraviolet spectrophotometer with 4 clay samples as the adsorbent, toluene and asphaltene as the adsorbate, and n-heptane as the solvent. The asphaltene is acquired from shale oil with Ro of about 0.9% of Qing 1 Member of Well A and prepared by washing with n-heptane, precipitation and centrifugation. The adsorption experiments are carried out as following steps. (1) Formulate the solutions of various concentrations, and operate full-wave band scanning to determine a characteristic peak of an adsorbate in a solvent. (2) Formulate a solution of a given concentration, scan a characteristic peak to determine the relation between the concentration and absorbance (ABS), and establish an absorbance-concentration calibration equation. (3) Add a small amount of clay into the solution, and operate ultrasonic oscillation during the immersion during of 24 h to ensure full adsorption. (4) When absorption is finished, take the supernatant to measure the absorbance, and calculate the solution concentration after absorption according to the calibration equation. Calculate the adsorbing amount qc according to the difference in supernatant concentrations before and after adsorption:
${{q}_{\text{c}}}=\frac{\left( {{C}_{i}}-{{C}_{\operatorname{f}}} \right)V}{W}$
1.3.3. Step-by-step Rock-Eval experiments
Rock-Eval 6 instrument was used to carry out step-by-step Rock-Eval experiments with shale and the separated clay samples. The temperature step was controlled with the IFPEN method [42]. According to JIANG et al. [14], LI et al. [43] and our study [44], the hydrocarbon amount released in Rock-Eval below 450 °C is approximately equal to the amount of rock extracts (chloroform bitumen "A"), though kerogen cracking already occurs at 450 °C. Because the IFPEN method sets the temperature of pyrolysis hydrocarbon release as 350 °C, the pyrolysis hydrocarbon release amount below 450 °C is set as the total shale oil amount here.
1.3.4. SEM observation
SEM observation is carried out in ZEISS Crossbeam 550 FE-ESEM and EDAX energy spectrum. Before experiment, both sealed and conventionally cored samples were cut to the size of 1.0 cm×1.0 cm×0.2 cm and treated with argon ion polishing and plating. Observation of sealed coring samples requires quick preparation to reduce fluid loss. Shale oil occurrence is observed directly under low voltage and low current conditions and at 20 °C.
2. Experimental results and model parameters
2.1. Micro characteristics of shale oil occurrence
SEM observation shows that residual oil exists in some pores of conventionally cored shale samples of Qing 1 Member in the study area, and mainly occurs in organic pores, clay pores and pyrite intercrystalline pores (Fig. 1a -1d). After long-term exposure, free oil in the pore center is lost a lot, showing the characteristics of void pores. Under the action of gas-liquid interfacial tension, residual oil occurs on the pore surface in the form of "smooth shape" and "concave liquid level", and sticky oil occurs in some pores. Reeder et al. [45] compared the kerogen morphology before and after oil extraction, and found that the kerogen structure after oil extraction collapses obviously, suggesting a large amount of shale oil dissolved in the kerogen framework. Jarvie [46] suggested that oil swollen in kerogen leads to organic pore shrinkage and even no pores observed under SEM, and then, illusion of "under developed organic pores" of occurs shale in oil window. Therefore, the kerogen/OM in the dark black area possibly develops swollen shale oil in this SEM observation of shale.
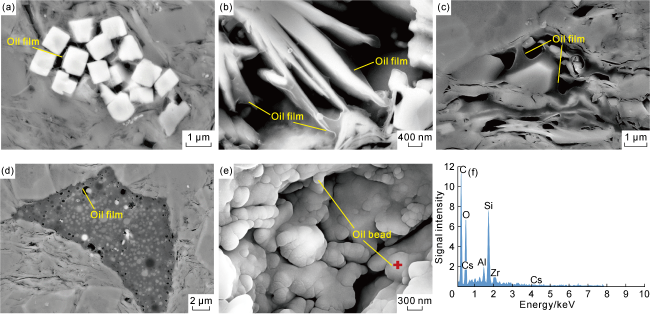
Fig. 1. Occurrence space of shale oil in Qing 1 Member in Songliao Basin. (a) No.1 sample, Ro=0.83%, oil film in pyrite intercrystalline pores; (b) No.4 sample, Ro =1.05%, oil film in clay pores; (c) No.6 sample, Ro=1.15%, oil film on organic pore surface; (d) No.7 sample, Ro=1.21%, oil film in pyrite-organic pore; (e) oil droplet characteristics in sealed coring samples; (f) Energy spectrum of "+" position in sealed coring samples (e). |
Different from conventionally cored shale, sealed coring shale with large intergranular pores (pits) of quartz still have a large amount of beaded oil after rapid preparation and analysis, and the energy spectrum shows a higher carbon peak (Fig. 1 e-1f). The beaded oil is speculated to be the free oil lost during conventional coring and has strong mobility.
2.2. Kerogen swelling mechanism and adsorption-swelling oil capacity
2.2.1. Swelling mechanism
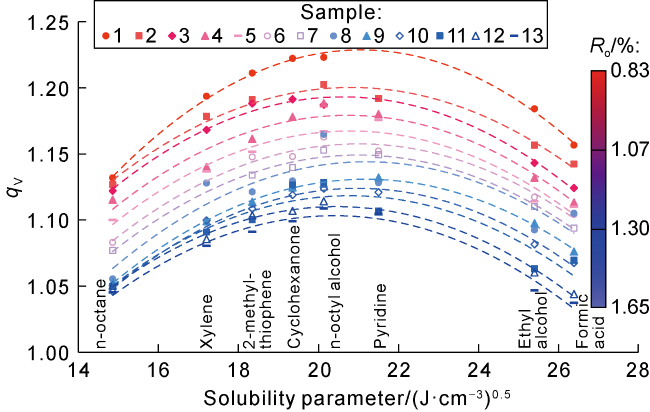
Fig. 2. Swelling ratio of various maturity kerogen in solvents in Qing 1 Member of the study area. |
For the single organic solvent, qV of kerogen decreases as the maturity increases, indicating weakening swelling oil capacity. This is mainly due to the kerogen chemical structure. Previous X-ray diffraction analysis revealed that the most obvious structural unit of solid bitumen and liquid hydrocarbon during swelling oil is the amorphous carbon (γ band) composed of aliphatic carbon with the spacing reduced gradually and arrangement more compact. The liquid hydrocarbon hardly enters the micro-crystalline formed by tightly stacked aromatic carbons which are hardly affected by swelling [47]. Thus, the kerogen with the higher ration of aliphatic carbon absorbs and swells more hydrocarbons. With increase of maturity, the unstable structures in kerogen such as branched chain/side chain gradually fall off, the aliphatic carbon content decreases, aromatization is enhanced, the crosslinking density increases, the structure is more rigid[48], and the oil swelling capacity is weakened (Fig. 2 ).
2.2.2. Adsorption-swelling oil capacity
Based on the swelling ratio of kerogen adsorbing and swelling various organic solvents, the parameters K and d in the optimization model are fitted according to Eq. (4). The object of the kerogen adsorption-swelling experiment is simple organic solvent (Fig. 2 ). The properties of those single solvents and shale oil differ greatly, thus, the composition and density of crude oil should be considered to evaluate actual adsorption-swelling shale oil amount of kerogen. The shale oil component and density can be predicted according to the maturity of the study area (Fig. 3 ). The solubility parameters of shale oil with various maturities can be obtained by weighted average of component family proportions and solubility parameters according to Eq. (5). Based on this, K of various maturity kerogen is coupled to get the absorbing-swelling shale oil amount by kerogen according to Eqs. (2) and (3).
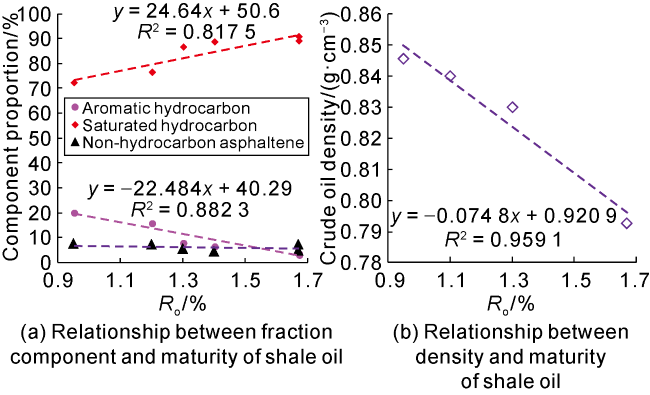
Fig. 3. Quantitative relationship between characteristic parameters and Ro of Qing 1 Member shale oil in the study area. |
Taking 13 samples in this study as an example, when Ro is 0.83%-1.65%, the adsorption-swelling oil capacity (or sorption oil capacity) of kerogen is about 50-250 mg/g. According to the swelling oil experiments of kerogen simulated thermally in gold tubes and that enriched in naturally evolved samples in Fig. 4 , the swelling oil amount of kerogen decreases with increase of Ro within a wide range. For kerogen Ro < 0.6%, Ballice and Larsen [49] carried out swelling experiments of oil shale from Goynuk area of Turkey by thermal simulation to various maturity and derived average qV of oil shale close to 1.5.Here, the relation between the oil density and Ro (Fig. 3 ) is used to convert them swelling oil amount to 500 mg/g. According to the swelling oil ratio of kerogen with Ro of 0.47%-0.92% in naturally evolved samples from Kelemen et al. [19], the swelling oil amount is estimated as about 250-550 mg/g. There are differences in swelling oil amount of kerogen obtained in different study, and the swelling oil amount of kerogen reported by Guangzhou Geochemical Research Institute of Chinese Academy of Sciences also varies. For example, WEI et al.[39] conducted thermal simulation on kerogen from lower sub-member of Shahejie Formation 3rd Member of Jiyang Depression in golden tube, and found that the swelling oil amount of kerogen with Ro of 0.6%-1.0% is about 50-120 mg/g. SUN et al. [41] proposed that for kerogen in the upper sub-member of Shahejie Formation 4th Member of Jiyang Depression, when Ro is 0.7%-1.25%, the swelling oil amount is about 100-300 mg/g, which is close to the results in this study. Beside the maturity, the swelling oil capacity of kerogen is related to its type and thermal evolution. Walters et al. [50] reported that the swelling ratio of Type II kerogen is higher than that of Type III kerogen.The swelling ratio of kerogen in naturally evolved samples is generally higher than that in thermally simulated samples. We suggest that this is possibly due to the kerogen chemical structure. Geological evolution of kerogen mostly occurs below 200 °C, and thermal simulation is carried out above 300 °C and even at 600 °C. High temperature possibly changes the physicochemical properties of kerogen and causes chemical reaction that does not occur at geologic temperature less than 200 °C [51]. Secondary cracking of hydrocarbon is more significant in thermal simulation experiment in closed system, and a large amount of coke is generated during coking reaction [52], which causes more concentrated aromatic ring structure and higher cross-linking density, resulting in the swelling capacity possibly lower than that of naturally evolved sample. According to the measured swelling oil amount of 13 naturally evolved kerogen, the relationship between the swelling oil amount and Ro was fitted (Fig. 4 ).
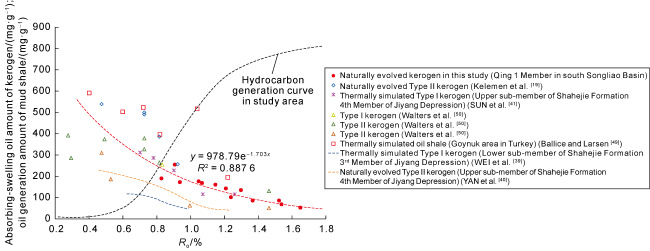
The kerogen swelling oil experiments above were conducted under conditions of abundant oil supply. In the course of geological evolution, the hydrocarbon generated by kerogen in the early stage of low maturity or immature stage cannot realize full saturation. The actual swelling oil amount of kerogen should be determined by considering the effects of hydrocarbon generation. Previously, hydrocarbon generation thermal simulation experiments on dark black shale (TOC=11.02%, Type I, Ro=0.54%) in the study area was completed in Guangzhou Institute of Geochemistry, Chinese Academy of Sciences, and the hydrocarbon generation curve of kerogen was established, as shown in black dashed line in Fig. 4 . When Ro is less than 0.8%, hydrocarbon generated by kerogen cannot realize full saturation, and its actual adsorption- swelling oil amount is equal to the oil generation amount Mg. When Ro is equal to 0.8%, the hydrocarbon generation amount of kerogen approximates to the adsorption-swelling oil amount. When Ro is greater than 0.8%, the oil generation amount Mg of kerogen is larger than the adsorption-swelling oil amount (Fig. 4 ). Thus, the actual adsorption-swelling oil amount of kerogen is expressed as:
${{M}_{\operatorname{k}}}=\left\{ \begin{align} & {{M}_{\text{g}}}\ \ \ \ \ \ \ \ \ \ \ \ \ \ \ \ \ \ \ \ \ \ \ {{R}_{\text{o}}}<0.8\% \\ & 978.79{{e}^{-1.703{{R}_{\text{o}}}}}\ \ \ \ \ \ \text{ }{{R}_{\text{o}}}\ge 0.8\% \\ \end{align} \right.$
The accuracy of Mk quantification in this study is possibly affected by the low purity of the enriched kerogen samples (the kerogen TOC is basically less than 60%, as listed in Table 1 ). Currently, there is controversy on effect of the kerogen purity on its swelling amount. Ballice [53] carried out swelling oil experiments with oil shale from Goynuk area in Turkey, and found that after removing the minerals from shale, the swelling amount of some samples increased. Nevertheless, Larsen et al. [37] suggested that inorganic minerals have little effects on shale swelling, even if the mineral content in kerogen reaches 40%. In addition, due to the difference in solubility parameters of various solvents, the solvents with a medium-high solubility parameter reach the equilibrium in a short time, and those with the low solubility parameters take a long time [54]. In this study, the duration for immersing the solvent in kerogen is set as 24 h, which is based on previous learning, and it possibly increases the uncertainty of quantification of swelling oil.
2.3. Adsorbed oil capacity of clay
We carried out experiments of clay absorbing toluene, clay absorbing asphaltene, competitive adsorption of toluene and asphaltene by clay in the study area. In experiments of the single component adsorption (Fig. 5 ), the toluene amounts adsorbed by different clay vary little. Maximum adsorption occurs when the toluene concentration is about 1000 mg/L, and the adsorbing toluene amount of clay is 18.95-22.91 mg/g, with an average of 21.49 mg/g. In contrast, there are big differences in the absorbing asphaltene amount of various clay. Maximum adsorption occurs when the asphaltene concentration is about 800 mg/L. The adsorbing asphaltene amount of clay is 24.91-37.8 mg/g, with an average of 29.48 mg/g.
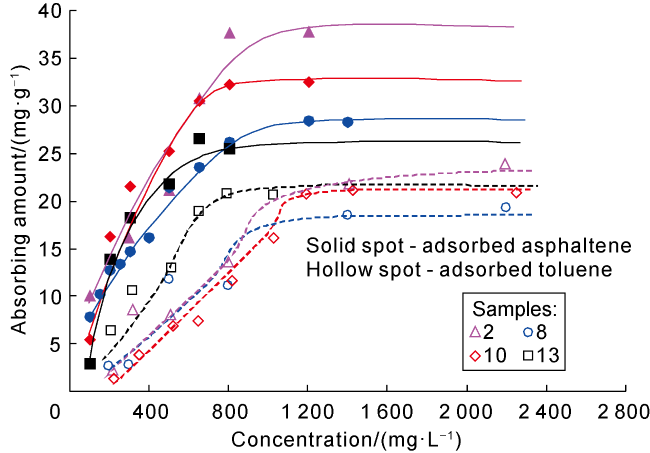
Fig. 5. Relationship between the absorbing amount of toluene and asphaltene by clay and their concentrations. |
In experiments of competitive adsorption of toluene and asphaltene by clay (Fig. 6 ), the adsorbing toluene and asphaltene amounts of clay under various asphaltene concentrations are detected by setting n-heptane as the solution, and controlling the mass ratio of n-heptane to toluene as 10:1 and the toluene concentration as about 63 425 mg/L. When the asphaltene concentration is low, the clay mainly adsorbs toluene. With increase of the asphaltene concentration, the adsorbing asphaltene amount of clay increases, and the adsorbing toluene amount decreases. When the asphaltene concentration exceeds 300 mg/L, the clay adsorbs more asphaltene amount and less toluene amount. When the asphaltene concentration is 650-800 mg/L, the adsorbing asphaltene amount of clay reaches a maximum and tends to be stable, and little toluene is adsorbed. Thus, when aromatic hydrocarbon and asphaltene coexists, the clay mainly adsorbs the asphaltene.
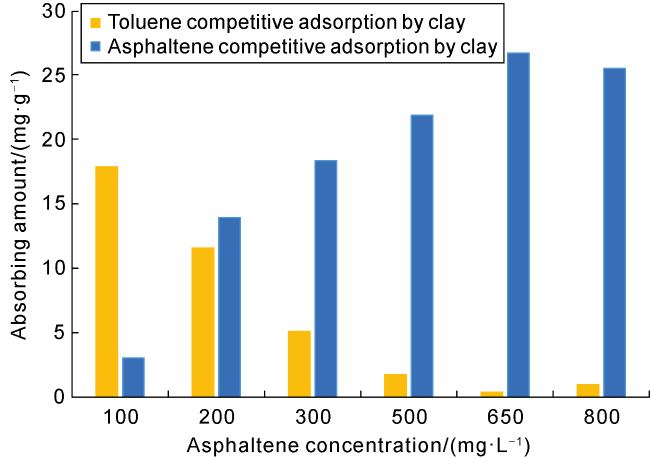
Fig. 6. Relationship between toluene and asphaltene competitive adsorption amount and asphaltene concentration. |
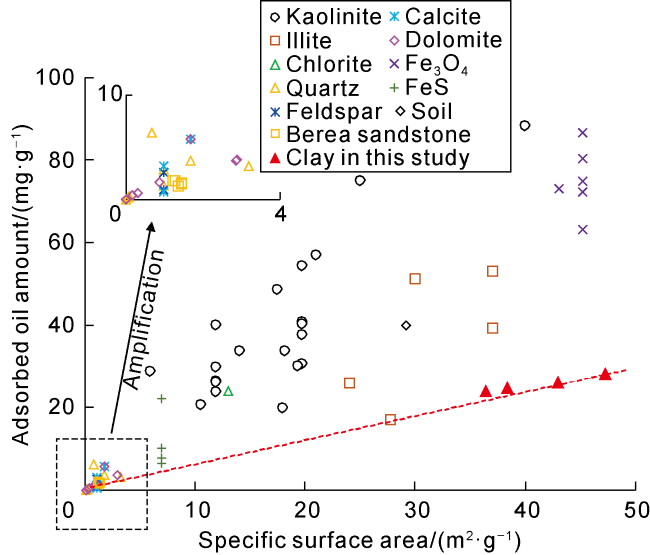
In the above competitive adsorption experiment, when the asphaltene concentration reaches 800 mg/L, the proportion of saturated hydrocarbons (n-heptane) in the solution system is about 90.81%, aromatic hydrocarbons (toluene) is about 9.08%, and asphaltene is only 0.11%. Compared with the shale oil composition in the study area [3], although the asphaltene content used in this experiment is low, the results show that the clay still mainly adsorbs asphaltene. Here, the result of clay adsorbing asphaltene is used as a proxy of the adsorbed oil capacity of clay, and the evaluation chart of adsorbed oil capacity of minerals is plotted, as shown in Fig. 7 . In this study, the adsorbed oil capacity of clay pores is about 0.63 mg/m2. Compared with the results reported previously, the findings are obtained as follows. First, the adsorbed oil amount of minerals is positively correlated to their specific surface area, which indicates that the specific surface area is a key factor affecting the mineral adsorption amount. This is the reason why the clay specific surface area is used to calculate the adsorption amount of clay in this model, which is different from that LI et al. [23] use mineral contents to calculate the adsorbed oil amount. SEM observation shows that large areas of mineral particles do not necessarily contribute to pores. Second, the clay has a higher specific surface area and generally adsorbs more oil than other minerals. This is why only clay adsorption is considered in the simplified model. Third, although kaolinite has a low specific surface area, its adsorbed oil amount is higher than that of illite, which is possibly of the biased oil wettability of kaolinite [55]. Fourth, compared with the absorbing oil amount of kaolinite and illite reported previously, the result obtained in this study is lower. The pure minerals are applied in previous report, by contrast, some clay pores separated from shale in this study may be water wet.
2.4. Ratio of clay pore surface area occupied with adsorbed oil
Oil does not occur in all clay pores in shale. The oil adsorbing amount of clay should not be evaluated by multiplying the specific surface area by the adsorbed oil capacity, and the ratio of clay pore surface area occupied with adsorbed oil to total clay pore surface area (f) in shale samples should be considered. Trial of obtaining the f value has been done with two methods.
(1) The actual adsorbed oil amount of the separated clay (Qac) is measured directly through the step-by-step Rock-Eval experiments. The Qac value of these clay is 1.21-4.08 mg/g, with an average of about 2.57 mg/g (Table 3 ). Especially, No.13 clay has the lowest adsorbed oil amount, which is possibly caused by its lighter shale oil components. This method estimates f as 0.05-0.13, with an average of about 0.10. The process of clay separation by this method causes loss of shale oil, and the obtained f value is relatively low.
Table 3. Results of the step-by-step Rock-Eval experiment and adsorbed oil amount of clay separated from shale |
| Sample No. | Clay pyrolysis at temperature steps/(mg·g-1) | Qac/(mg·g-1) | qc/(mg·g-1) | f | |||
|---|---|---|---|---|---|---|---|
| S1-1 | S1-2 | S1-3 | S2* | ||||
| 2 | 0.10 | 0.76 | 3.32 | 4.92 | 4.08 | 29.76 | 0.13 |
| 8 | 0.25 | 0.97 | 1.36 | 2.83 | 2.33 | 22.89 | 0.10 |
| 10 | 0.31 | 1.58 | 1.10 | 2.74 | 2.69 | 24.14 | 0.11 |
| 13 | 0.31 | 0.76 | 0.46 | 1.09 | 1.21 | 27.05 | 0.05 |
(2) First, the total adsorbed oil amount of shale is measured by the step-by-step Rock-Eval experiment, and it is subtracted by adsorption-swelling oil amount of kerogen according to Eq. (10). Then, the f value is estimated with Eq. (7). The f value evaluated with this method is 0.05-0.28, with an average of about 0.15. The oil content of clay pores in shale is mainly dominated by OSI [5]. The higher OSI value causes more shale oil to enter the inorganic pores after being saturated in OM, and the higher f value. Nevertheless, given a same OSI, the f value of the Qing 1 Member shale in northern Songliao Basin is generally higher than that of the Shahejie Formation in the Jiyang Depression (Ro<0.9%) (Fig. 8 ). As mentioned above, with the higher maturity, less oil is absorbed and swollen per TOC. Therefore, given an OSI, more oil is retained in the inorganic pores in shale with the higher maturity, and the f value is higher. In addition, from the perspective of wettability, a higher value of f is possibly due to that the illite/smectite formation is transformed into illite as the maturity increases, which leads to increase of hydrophobicity of clay mineral surface [61].
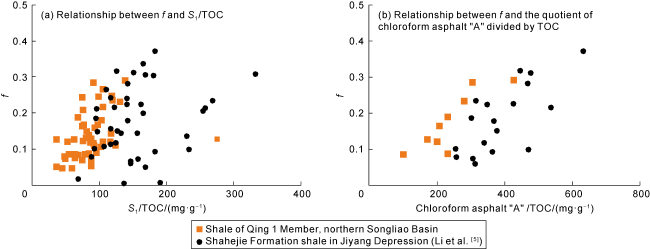
Fig. 8. Relation between f and shale oil saturation index. |
3. Geological application
3.1. Evaluation of adsorbed oil amount of shale core samples
The adsorbed oil amount of 42 shale samples in the study area was evaluated with the adsorbed oil model, and comparison with the results of the step-by-step Rock-Eval experiments is shown in Fig. 9 . The results are distributed evenly at both sides of diagonal line, with the correlation coefficient R2 over 0.70. The total adsorbed oil amount of shale is 0.76-10.12 mg/g, with an average of 4.20 mg/g. The adsorption-swelling oil amount of kerogen is 0.08-9.02 mg/g, with an average of 2.46 mg/g. The adsored oil amount of clay is 0.21-2.29 mg/g, with an average of 1.68 mg/g. The proportion of adsorption-swelling oil amount of kerogen in the total adsorbed oil is 28%-87%, with an average of about 55%, and it decreases with increase of Ro (except interbed samples, Fig. 10 ). The proportion of adsorbed oil amount of clay increases with increase of Ro. The evaluation results at room temperature show that, when Ro is greater than 1.3%, the proportion of adsorbed oil amount of clay from shale is over 50%, indicating that the shale oil adsorption is dominated by clay pores.
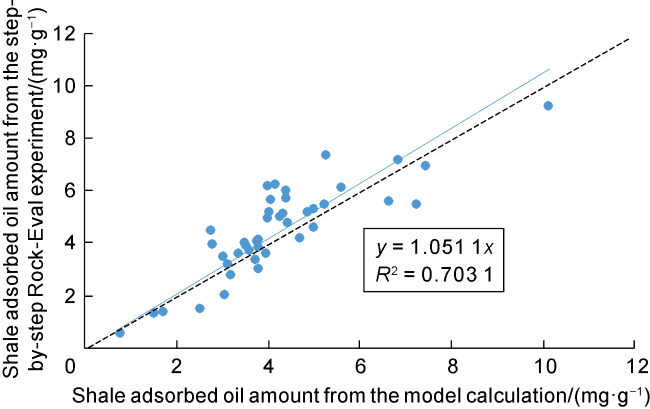
Fig. 9. Comparison of the shale adsorbed oil amount calculated by model and that obtained by the step-by-step Rock-Eval experiment. |
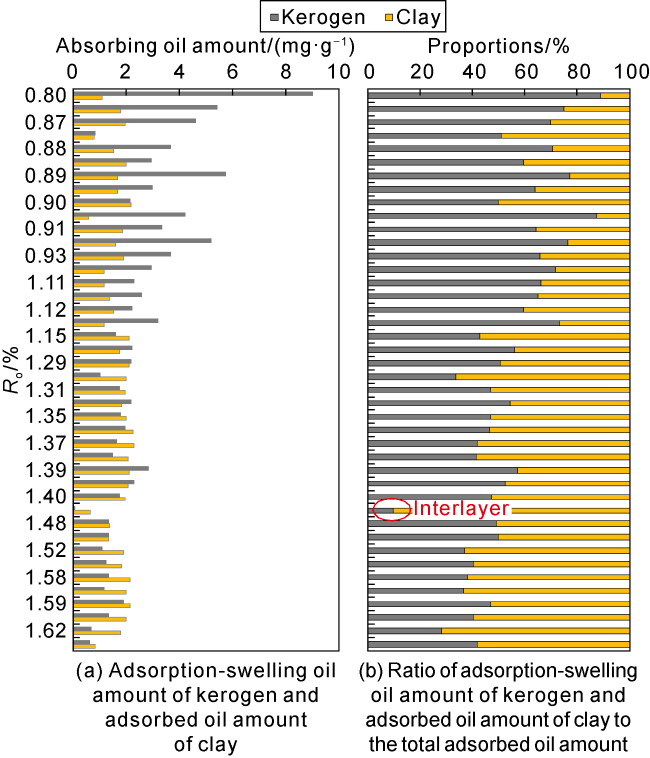
Fig. 10. Calculation results of the adsorption-swelling oil amount of kerogen with various maturity and the adsorbed oil amount of clay in shale. |
3.2. Preditcion of adsorbed oil amount under formation temperature and pressure conditions
3.2.1. Effect of temperature and pressure on oil adsorption
The above experiments of kerogen adsorption-swelling oil and clay adsorbed oil were completed under ambient conditions (25 °C, and 0.1 MPa). The effects of temperature and pressure should be considered in in-situ conditions.
(1) To reveal the effect mechanism of temperature on adsorption-swelling oil amount of kerogen, experiments of absorption-swelling oil were carried out at different temperatures with No.7 and No.10 kerogen samples. Change in volume of kerogen and solvent due to thermal effects should be considered, and there is a large difficulty of evaluating the kerogen swelling ratio by height method in Eq. (8). Here, the mass method was applied, the mass of kerogen after adsorption-swelling experiments at different temperatures is recorded (Fig. 11a ). The results of both samples show that the kerogen mass after swelling oil at 60 °C and 80 °C is similar to that at room temperature. According to Ertas et al. [38], the kerogen swelling ratio only changes slightly at 30-150 °C, which indicates little effect of temperature on swelling. This is due to that temperature has little effect on solubility parameters, the solubility parameters only change 1-2 (J/cm3)0.5 from room temperature to 400 °C [34]. The effect of temperature on oil adsorption by clay is referred to the curve of adsorbed oil capacity of clay at different temperatures established by Tian Shansi [62] (Fig. 11b ).
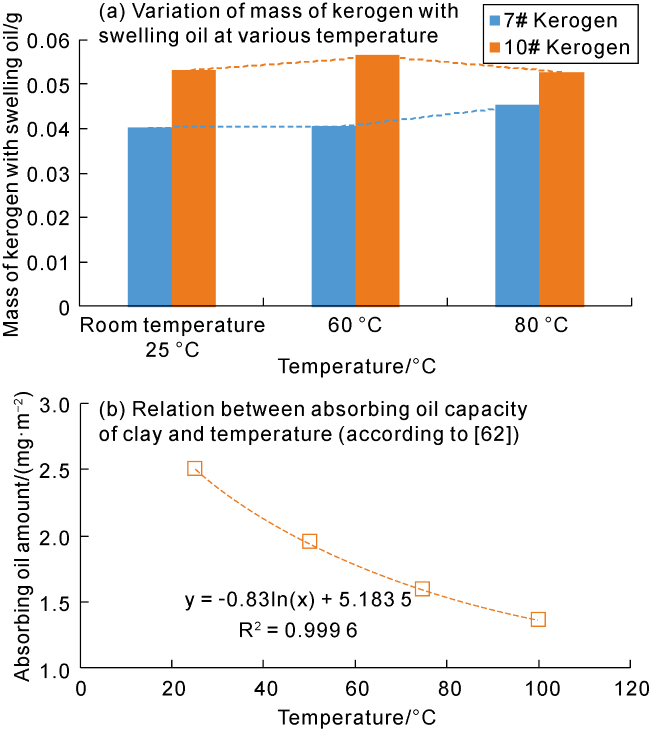
Fig. 11. Effect of temperature on the adsorbed oil amount of kerogen and clay. |
The effect of temperature on clay adsorption oil is mainly considered here. The adsorbed oil capacity of clay is coupled with the current geothermal gradient (4.2 °C/100 m) in the study area, and the adsorbed oil capacity of clay with various maturity are established, as illustrated in Fig. 12 .
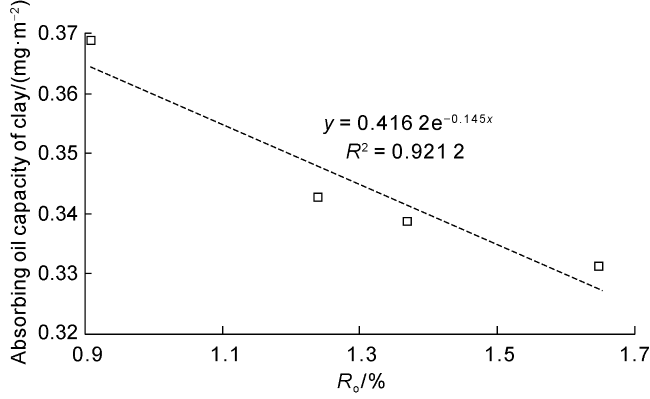
Fig. 12. Variation of the adsorbed oil capacity of clay at different maturities. |
3.2.2. Evaluation of adsorbed oil amount from shale oil wells
Based on the above model and the effect of temperature and pressure on adsorption oil, the total adsorbed oil amount of Qing 1 Member shale with Ro of 0.85%-1.65% in 6 wells in the study area is estimated. Specific surface area of clay pores in shale is calculated by subtracting the shale specific surface area by the kerogen specific surface area, and the former is calculated according to formula for conversion of porosity-specific surface area [23], and kerogen specific surface area is estimated with maturity.
As shown in Fig. 13a , the predicted total adsorbed oil amount is 0.62-10.68 mg/g, with an average of 3.48 mg/g, and it decreases as the shale maturity increases. When the geothermal effect is neglected, the predicted total adsorbed oil amount of shale is 1.17-11.33 mg/g, with an average of 4.33 mg/g, which is basically consistent with the evaluation results of 42 cores. Taking Well F as an example, Fig. 13b shows the vertical prediction results of adsorption-swelling oil amounts of kerogen, adsorbed oil amount of clay pores and shale total adsorbed oil amount respectively. When Ro is 1.55%-1.65%, the estimated total adsorbed oil amount of shale under the formation conditions of this well ranges from 1.40 mg/g to 4.13 mg/g, with an average of 2.47 mg/g. From the perspective of vertical prediction results, although the total adsorbed oil content evaluated at room temperature (Fig. 13b , green line) is very close to the measured value (semi filled scatter), it is different from those obtained at room temperature. When considering the influence of formation temperature, the reduction effect of temperature on the amount of adsorbed oil by clay is obvious, leading to that the adsorbed oil from shale still dominated by organic matter.
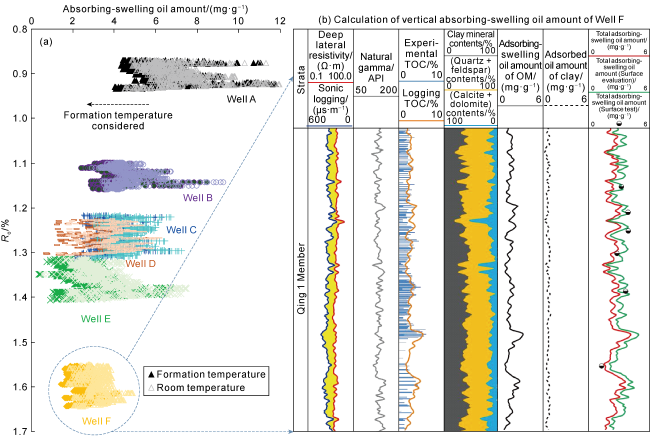
Fig. 13. Prediction results of the adsorbed oil amount of shale in typical wells. |
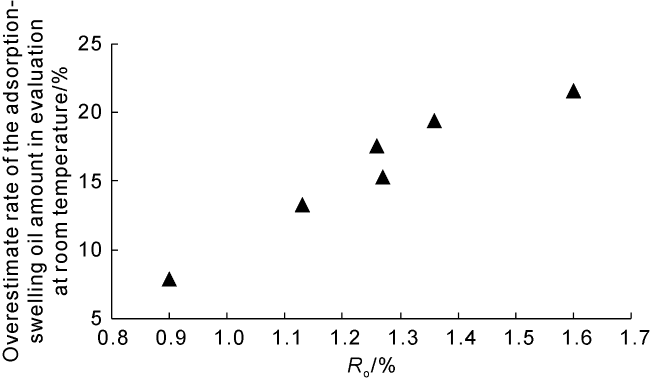
Previous evaluation of absorbed oil amount of shale is mostly based on understanding obtained in experiments under conditions of room temperature and pressure [5,12,15,26]. As shown in Fig. 14 , the laboratory test at room temperature often overestimates the adsorbed oil amount of shale about 8%-22%, with an average of about 15%, and the higher shale maturity causes a larger deviation. Therefore, the effects of shale maturity and formation temperature should be considered in evaluating the adsorbed oil amount of high maturity shale.
Fig. 14. Relation between the overestimate rate of the adsorption-swelling oil amount of shale and the maturity in evaluation at room temperature. |
It should be noted that the adsorbed oil amount measured and predicted by rock pyrolysis here mainly refers to the heavy hydrocarbons with relatively high boiling point. The research object is conventionally cored shale samples where a large amount of light components are lost. Some proposed that the adsorbed oil is not lost [9]. Nevertheless, authors found that the pyrolysis analysis parameter of S2 peak shows a decreasing trend in some sealed coring shale exposed in the open environment, indicating loss of some adsorbed oil. In addition, the adsorbed oil on pores and swelling oil in kerogen skeleton are quantified uniformly there, but their occurrence mechanisms are different. Especially for the high maturity shale, adsorption capacity of the organic pores is possibly dominant. The evaluation model and chart for adsorbed oil presented here and prediction of adsorbed oil amount of shale under conditions of in-situ temperature and pressure with molecular simulation method provide references for the industry.
4. Conclusions
In this study, a model of evaluating the adsorbed oil amount of shale is proposed by integrating adsorption-swelling oil in kerogen and adsorbed oil in clay pores. Taking Qing 1 Member shale in the northern Songliao Basin as an example, the main understandings are obtained as follows.
Maturity has a significant effect on the adsorption- swelling oil capacity of kerogen. As the maturity increases, the adsorption-swelling oil capacity of kerogen decreases. When Ro is 0.83-1.65%, the adsorption-swelling oil amount of kerogen is about 50-250 mg/g.
Clay mainly adsorbs the asphaltene component in shale oil, with an average adsorption amount of about 29.48 mg/g. The adsorbed oil capacity of clay pores is about 0.63 mg/m2. The ratio of clay pore surface area occupied with adsorbed oil to total clay pore surface area in Qing 1 shale samples is 0.05-0.28, with an average of about 0.15, which is mainly controlled by OSI and Ro.
The total adsorbed oil amount of shale evaluated by the adsorbed oil model is in good agreement with that measured by the step-by-step Rock-Eval experiments. When Ro is 0.83-1.65%, the ratio of kerogen adsorbed-swollen oil to the total adsorbed oil is about 28%-87%, and it decreases with increase of maturity. When Ro is greater than 1.3%, oil adsorption in shale is dominated by clay absorption.
As the temperature increases, the adsorption-swelling oil capacity of kerogen is basically not changed, while the adsorbed oil capacity of clay decreases. Based on the adsorbed oil amount at the present formation temperature of Qing 1 Member, the adsorbed oil amount measured at room temperature is overestimated by 8%-22% (average 15%).
In this study, starting from experiments of adsorption-swelling oil of kerogen with various maturity and oil adsorption by clay, we quantitatively characterized the adsorption-swelling oil capability of kerogen and the adsorbed oil capability of clay, and determined the ratio of clay pore surface area occupied with adsorbed oil to total clay pore surface area and the effects of temperature on oil adsorption. The model is of great significance to study occurrence mechanism of shale oil of various maturity and quantitative evaluation of in-situ shale oil reserves.
Nomenclature
Ac—specific surface area of clay sample, m2/g;
Ci, Cf—concentration of supernatant after initial adsorption and equilibrium adsorption in experiments of oil adsorption in clay, mg/L;
d—deviation factor, dimensionless;
f—ratio of clay pore surface area with adsorbed oil to total clay pore surface area in shale sample, dimensionless;
H1, H2—kerogen height before and after swelling, mm;
i—type of components family in the oil;
K—scale factor of swelling model, dimensionless;
Mc—adsorbed oil capacity of clay pores, mg/m2;
Mg—oil generation amount of shale, mg/g;
Mk—kerogen adsorption-swelling oil capacity, mg/g;
OSI—oil saturation index, mg/g;
Qa—total adsorbed oil amount of mud shale, mg/g;
Qac—actual adsorbed oil amount of clay in shale samples, mg/g;
qc—maximum adsorbed oil amount in experiments of oil adsorption in clay, mg/g;
qV—organic solvent swollen ratio in kerogen adsorption-swelling, dimensionless;
qVO—shale oil swollen ratio in kerogen adsorption-swelling, dimensionless;
S1—hydrocarbon product amount generated during rock pyrolysis at 300 °C for 3 min, mg/g;
S2—hydrocarbon product amount generated during rock pyrolysis from 300 °C to 650 °C, mg/g;
Sc—specific surface area of clay pores in shale samples, m2/g;
V—solution volume, L;
W—clay mass, g;
Wi—proportion of components family in shale oil components, %;
δk, δo, δl—solubility parameters of kerogen, shale oil and organic solvent, (J/cm3)0.5;
ρo, ρk—shale oil and kerogen density, g/cm3.