

Introduction
Beach-bar refers to sand bodies commonly developed in lake basins, and is an umbrella term for beach and bar. As beach and bar sand bodies are usually contraposed and difficult to be separated from each other, the term "beach-bar" is commonly used to describe beach and bar sand bodies [1⇓-3]. Beach-bar sandstone possesses abundant oil and gas resources and favorable exploration and development potential. Oil and gas fields with beach bars as reservoirs have been discovered in the Uinta Basin in the United States, and Bohai Bay, Songliao, Sichuan and other basins in China [4⇓⇓-7], demonstrating broad exploration prospects of beach-bar sandstone. Many understandings on the sedimentary characteristics [8⇓⇓-11], genesis mechanism [12⇓⇓-15], controlling factors [11,15 -16] and sedimentary models [14,17] of beach bars have been made by scholars at home and abroad. It is believed that beach-bar sandstones are characterized by fine grains, thin sand and mud interbeds, wide distribution and thicker bar than beach sandstone. They are formed by re-sedimentation of peripheral delta deposits after undergoing transformation by waves, lake currents or storms in lake bays and margins. Their development scale and distribution pattern are controlled by various factors [12,18 -19].
During the Neogene period, the Qaidam Basin was covered by the deposits of saline lake facies [20⇓-22]. Many scholars at home and abroad have conducted research on sedimentary reservoirs in this basin [23⇓⇓⇓-27], and reported the development of clastic and carbonate reservoirs. Earlier researches mainly focused on the continental clastic rocks and lacustrine carbonate rocks, but less on the beach bars. With the deepened oil and gas exploration and increasing investment on the exploration of lithologic reservoirs, beach bars have attracted high attention from oil fields, and researches on beach-bar sandstones have been carried out successively [28⇓-30]. The results showed that beach-bar sandstones are developed better in saline lake basins, and have a wider distribution under the influenced of saline water bodies. It is silt and fine sandstone characterized by small single-layer thickness, low-angle cross-bedding, and high content of lime and mud matrix. Controlled by factors such as saline water and hydrodynamic conditions, the sandstone tends to migrate toward the center of the lake basin. Present exploration faces problems including where to find favorable lithologic oil and gas reservoirs, what factors control the distribution of beach-bar sandstones, and what the characteristics of oil and gas accumulation are in beach-bar sandstones.
This paper uses typical sedimentary characterization, particle size analogy and analysis, multi-factor control and other methods to conduct comprehensive analysis of outcrops and sedimentary characteristics of the saline lake basin based on field outcrops, cores, particle size measurement, present sediments in the Qinghai Lake, and experimental and testing results. It’s confirmed that delta and beach bar deposits are developed. After investigating the sedimentary sequences, development characteristics and sand control factors of beach bars, the sedimentary model of beach bars is established. It's proposed that the development of oolitic limestone and micrite at the top of beach-bar sandstone is one of the typical features of saline lake facies. The spatiotemporal distribution characteristics and multi-factor sand control mechanism of beach-bar sandstone are clarified. It’s found that the overlapped area of the Neogene beach-bar sandstone is predicted to be 3000 km2, which strongly support the exploration plan of the Neogene lithologic reservoirs in the Qaidam Basin.
1. Overview
The Qaidam Basin is located in the northern part of the Qinghai-Tibet Plateau, surrounded by the Kunlun Mountains, Altun Mountains, and Qilian Mountains. It is 850 km long from east to west, 150-300 km wide from north to south, covering an area of approximately 121 000 km2, where the Neogene sedimentary thickness achieves up to 17 200 m. In the southwest of the basin (called southwestern Qaidam Basin), the Neogene strata include, from bottom to top, the Paleocene-Eocene Lulehe Formation (E1+2), the lower member of the Oligocene Lower Ganchaigou Formation (E31) and the upper member of the Lower Ganchaigou Formation (E32) of the Oligocene, the Miocene Upper Ganchaigou Formation (N1), the Pliocene Lower Youshashan Formation (N21), the Upper Youshashan Formation (N22) and the Shizigou Formation (N23) of the Neogene, and the Holocene-Pleistocene Qigequan Formation (Q1+2) of the Quaternary. This study area is located in the southwestern Qaidam Basin, where the Neogene is the main target for high-efficiency exploration and reserve and production increase of lithologic oil reservoirs recently. Therefore, the Upper Ganchaigou Formation and the Lower Youshashan Formation of the Neogene are the geological objectives in this study (Fig. 1 ).
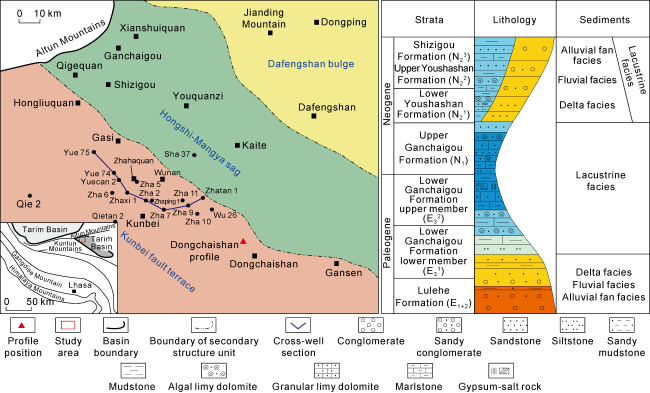
Fig. 1. Location of the study area and composite histogram of the southwestern Qaidam Basin. |
2. Sedimentary characteristics of beach-bar sandstone of saline lake facies
Field outcrops, drilling cores, thin sections, and other data are used to determine the lithology, bedding, thickness and other petrologic features of beach-bar sandstone in the study area. The lithofacies assemblages, sedimentary cycle patterns, and development laws are summarized.
2.1. Sedimentary lithofacies assemblages of beach-bar sandstones
Firstly, taking the Dongchaishan outcrop as an example (Fig. 2a ), the Upper Ganchaigou Formation strata consist of gray and brownish-gray mudstone, sandy mudstone and siltstone and fine sandstone. The sandstone is 0.2-3.0 m thick, has good sorting and low matrix content, with low-angle swash cross-bedding (Fig. 2b ), ripple marks (Fig. 2c ), parallel bedding and flamy structures (Fig. 2d ), low-angle cross-bedding (Fig. 2e ) and burrows. The sandstones are characterized by flat bottom and convex top on the section, and the single-phase sandstone has characteristic reverse graded particles.
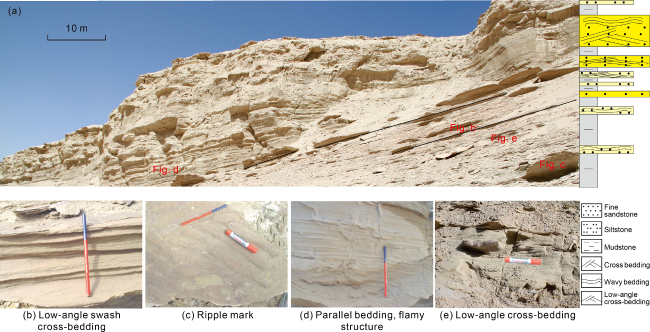
Fig. 2. Sedimentary characteristics of the Neogene Upper Ganchaigou Formation on Dongchaishan section. |
Secondly, the data of 3580 m cores from 91 wells in the study area show that the lithology of beach bars is siltstone and fine sandstone with single-layer thickness mostly ranging from 0.5 m to 3.0 m and locally reaching 5.0 m, and the sand-to-ground ratio is 0.1-0.3. Low-angle cross-bedding (Fig. 3a -3c), wave ripple (cross)-bedding (Fig. 3d -3f), wave-lenticular-vein bedding (Fig. 3g , 3h) are commonly observed in the cores. The particles are dominantly reverse graded and composite graded, and associated with algal limestone and micrite, indicating they are lacustrine deposits.
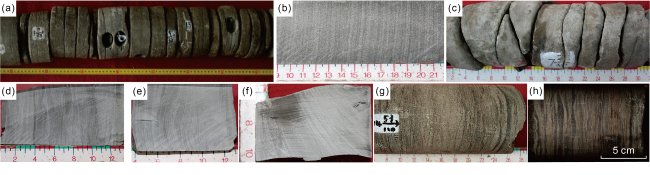
Fig. 3. Typical sedimentary phenomena of Neogene beach-bar sandstones in southwestern Qaidam Basin. (a) Well Zhaping1, 3273.00-3274.80 m, fine sandstone, low-angle cross-bedding; (b) Well Zhaping1, 3277.20-3277.35 m, fine sandstone, low-angle cross-bedding; (c) Well Zha2, 3125.93-3126.12 m, fine sandstone, low-angle cross-bedding; (d) Well Zhaping1, 3277.30-3277.42 m, fine sandstone, low-angle cross-bedding - wave ripple bedding; (e) Well Zhaping1, 3283.80-3283.88 m, siltstone, low-angle cross-bedding - wave ripple bedding; (f) Well Zhaping1, 3249.60-3249.65 m, siltstone, wave ripple bedding; (g) Well Zhaping1, 3465.98-3466.20 m, fine sandstone, wavy-vein bedding; (h) Well Zhaping1, 3409.69-3409.81 m, siltstone, wavy-lenticular bedding. |
2.2. Sedimentary cycle patterns of saline lake beach-bar sandstones
After an integrated analysis of the sedimentary sequences and petrological features revealed by drilling cores, three sedimentary cycle patterns are identified in the beach bars in the southwestern Qaidam Basin (Fig. 4 ).
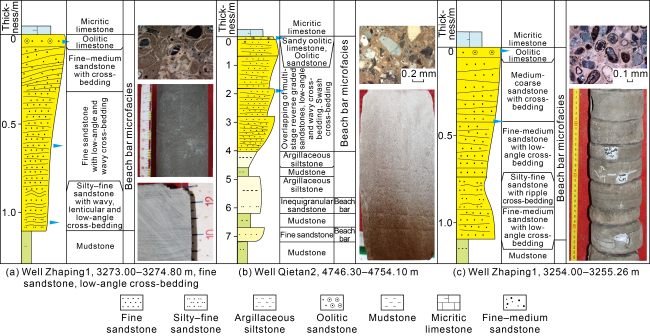
Fig. 4. Typical sedimentary sequences of the beach-bar sandstone of the Upper Ganchaigou Formation in Zhahaquan area. |
(1) Single-stage reverse cycle with upward-coarsening grains (Fig. 4a ). From bottom to top, the lithology changes from mudstone, fine sandstone with wavy, lenticular and low-angle cross-bedding, fine sandstone with cross-bedding, to oolitic limestone and micrite (Fig. 5 ). The sandstone has single-layer thickness of 1.1 m, good sorting and extremely low matrix content, reflecting a slowly decreasing lake level and stronger hydrodynamics under the condition of a relatively steady lake level.
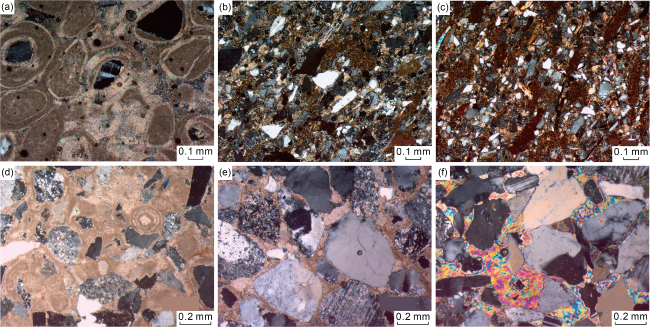
Fig. 5. Typical photos of sedimentary cycles of beach bars in Zhahaquan area (under cross-polarized light, x100). (a) Well Zhaping1, 3242.68 m, oolitic limestone; (b) Well Zhaping1, 3244.37 m, lime-bearing inequigranular feldspar sandstone; (c) Well Zhaping1, 4744.44 m, lime-bearing silty-very fine feldspar sandstone; (d) Well Qieshen2, 4743.54 m, calcarenitic oolitic limestone; (e) Well Qieshen2, 4743.73 m, lime-bearing medium-coarse feldspar lithic sandstone; (f) Well Qieshen2, 4744.44 m, gypsum-bearing fine-medium lithic feldspar sandstone. |
(2) Stacking pattern of multiple reverse cycles (Fig. 4b ). From bottom to top, the lithology varies from mudstone, muddy siltstone, fine sandstone with multiple stages of low-angle cross-bedding, oolitic sandstone, sandy oolitic limestone and micrite (Fig. 5b ). The sandstone has a single-layer thickness of about 1 m and a staking thickness of 4.4 m, good sorting and extremely low matrix content, reflecting an oscillating fall of lake level and changing hydrodynamics.
(3) Compound pattern of normal and reverse cycles (Fig. 4c ). The lithology from bottom to top changes from mudstone, fine sandstone with low-angle cross-bedding, fine siltstone with wavy bedding, fine-medium sandstone with low-angle cross-bedding, medium-coarse sandstone with cross-bedding, sandy oolitic limestone and micrite. The sandstone has good sorting and low matrix content, reflecting a rising-falling lake level and weakening-strengthening hydrodynamic condition.
Oolitic limestone and oolitic sandstone occur at the top of the beach-bar sandstones in all the three cycles (Fig. 4 ), which is a typical feature that distinguishes saine lake basin beach bars from freshwater lake basin ones. Their development is closely related to some superficial ooids developed in the turbulent area influenced by wave action. Feng [31] suggested that the formation of ooids is mainly controlled by the intensity of water flow that transports the core of ooids and the turbulence intensity of the saline water environment. When the turbulence intensity is lower than the capability transporting the maximum particles but greater than the capability transporting the minimum particles, both ooids and oolitic sandstone are developed in the ooid-forming environment, and most of the ooids are superficial ooids.
2.3. Development of beach-bar sandstone in saline lake basin
2.3.1. Cross-well section of saline lake basin beach bars
Based on the distribution of the Neogene sedimentary facies zones in the southwestern Qaidam Basin, eight nearly E-W cross-well sections were established along the direction from the provenance to the basin center. For example, the southern section across Well Yue75 and Well Zhatan1 (Fig. 6 ) reveals that the sediments mainly come from the west, and controlled by terrigenous clastic supply and progradation and retrogradation of delta sand bodies. Wells Zhaxi1 and Zha2 located near the braided-river delta front mainly deposit thick beach-bar sand bodies (single-layer thickness of 2.0-5.0 m), while wells Zha9 and Zhatan1 far away from the braided river delta mainly deposit thin beach-bar sand bodies (single-layer thickness of 0.2-1.5 m). The correlation results show that the beach bars are multi-layered and overlapped vertically, and extend with long distance in single stage (generally over 5 km) and are continuous and overlapped laterally. They also have the distribution characteristics of lateral migration towards the center of the lake basin under the influences of lake level fluctuation and progradation and retrogradation of delta sand bodies.
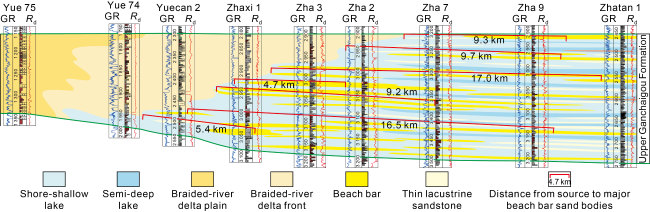
Fig. 6. W-E cross-well section of the Upper Ganchaigou Formation in the Yuejin-Zhahaquan area, southwestern Qaidam Basin (see section position in |
After a comparative analysis of sedimentary facies, it is believed that the beach-bar sandstones in the southwestern Qaidam Basin have the distribution of multiple-stage vertically stacked pattern, lateral migration, and continuous stacked pattern in the plane.
2.3.2. Planar distribution of saline lake basin beach bars
This paper uses outcrops and cores data to determine the sedimentary types, cored wells to establish the single well facies, cross-well section correlation to analyze the variation and facies zone boundaries between wells, and seismic sedimentology and sand content to predict the distribution of sand bodies. The sedimentary facies maps of 14 stratigraphic units in the Upper Ganchaigou Formation and Lower Youshashan Formation were established by the combination of point, line and plane to characterize the planar distribution and vertical evolution of the Neogene beach bar sandstone in the saline lake basin. Four sand groups (Fig. 7 ) were selected as examples, during the depositional period of the Upper Ganchaigou Formation (Fig. 7a , 7b), two river systems were developed mainly under the control of the source from the west. The braided river and braided river delta system formed by the north one is mainly distributed near the Hongliuquan-Gasi area, while the braided river and braided river delta system formed by the south one is distributed in the Yuejin-Zhahaquan area. Furthermore, under the influence of the Dongchaishan braided river delta system and the Qigequan-Ganchaigou fan delta system, the sand-to-ground ratio is less than 10% in the outer front of delta. The total area of the braided river and braided river delta system and the fan delta system is 2750 km2, while the shore-shallow lake area is 4700 km2. In areas such as Shizigou, Huatugou, Youshanshan, Yingdong, Zhahaquan and Wunan, sand bodies of lacustrine beach bar microfacies were developed, with sand-to-ground ratio ranging from 10% to 30%, and covering 1700 km2, which accounts for 36% of the shore-shallow lake area. Thin lacustrine sandstone and carbonate rock are widely distributed in the other areas of the shore-shallow lake. They are NW-SE trending and intersect with the lake shoreline in oblique en echelon distribution. Single-stage sand bodies are small, but different stages of sand bodies are overlapped and widely and continuously distributed. The Lower Youshashan Formation (Fig. 7c , 7d) inherited the sedimentary characteristics of the Ganchaigou Formation, with obvious progradation features of the sand bodies of two western braided river and braided river delta systems towards the lake basin. The measurements based on well data show that the longest migration is 20 km, the beach-bar sand bodies migrated towards southern Ganchaigou, eastern Yingdong, eastern Zhahaquan and Wudong in the lake basin. The shoal-shallow lake area is 5300 km2, of which the sedimentary area of beach-bar sandstone is 2300 km2, accounting for 43% of the shoal-shallow lake area. Thin lacustrine sandstone and carbonate are widely distributed. They are NW-SE trending and obliquely intersect with the lake shoreline in en echelon distribution.
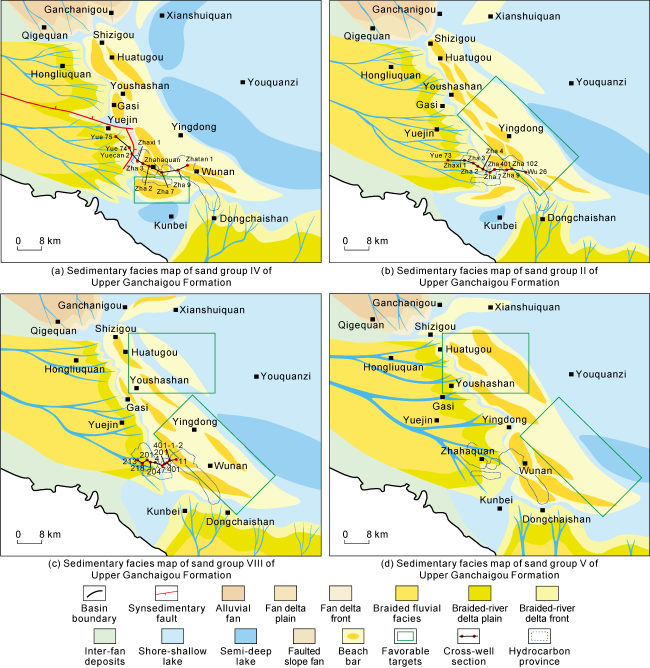
Fig. 7. Sedimentary facies map of some sand groups in the Upper Ganchaigou-Lower Youshashan formations, southwestern Qaidam Basin. |
3. Controlling factors of the development of saline lake basin beach-bar sandstone
Lacustrine beach bar deposits are widely developed in both ancient and modern lake basins. It is generally believed that factors such as the shape of lake basin bottom, hydrodynamics, source supply, and lake level change are the controlling factors for the development of beach bar deposits [2,7,22]. This paper mainly studies the sand control factors of saline lake basin beach bars from the aspects of water salinity, debris input, ancient landform and hydrodynamic conditions.
3.1. Water salinity controls the sedimentation rate and offshore distance of beach-bar sandstone
The density of saline water at 20 °C is 1.05-1.23 g/cm3, while that of fresh water is 1.0 g/cm3, which results in certain differences in sedimentation.
Firstly, simulation experiments were conducted to verify the control of water salinity on the sedimentation rate and transport distance of sediments. In the experiments, saline solutions with mass fractions of 0, 10‰, 20‰, 30‰, 40‰, 50‰, 60‰, and 70‰ were prepared, and coarse, medium, fine, silt, and mixed samples (40% coarse siltstone + 30% fine siltstone + 30% fine sandstone) were used. The first step was to observe the sedimentation rates. The sample particles were poured into glass tubes (1.2 m high) containing solutions with different salinities, and the sedimentation time was recorded with a stopwatch (Table 1 ). The results show that salinity has a small effect on the sedimentation rates of coarse and medium samples, but significantly influences the sedimentation rates of fine and silt samples and the fine-grained ones within mixed sample. For example, the initial time that silt particles reach the bottom of the glass tube in saline solutions with mass fractions of 30‰ and 70‰ was 1.66 times and 4.52 times that in freshwater, respectively, and the time that all silt particles took to reach the bottom is 1.39 times and 2.72 times that in freshwater, respectively. According to the calculation in Table 2 , the sedimentation rates of fine siltstone in saline solutions with mass fractions of 30‰ and 70‰ are only 48.4% and 15.8% of that in freshwater, respectively, indicating that water salinity has a controlling effect on the sedimentation rate of fine-grained rocks (Fig. 8 ). In the second step, the same salinity, mixed samples, and water flow velocity were applied in the experiment for transport distance measurement (Table 2 ). Within 24 h, the transport distance of mixed sand in freshwater and saline solutions with mass fractions of 30‰ and 70‰ was 2.34, 3.12 and 4.92 m, respectively. The transport distance in 30‰ and 70‰ solutions is 1.33 times and 2.1 times that in freshwater, respectively; it is 1.39 times and 2.14 times that in freshwater, respectively within 48 h. It’s observed that fine-grained sediments have larger transport distances in saline water bodies, and the higher the water salinity is, the longer the transport distance is. It indicated that water salinity has a controlling effect on the transport distance of fine-grained sediments (Fig. 9 ).
Table 1. Sedimentation rates of different-grained samples at different salinities |
| Salinity/‰ | Initial time when some particle reaches the bottom/s | Final time when all particle reaches the bottom/s | ||||||||
|---|---|---|---|---|---|---|---|---|---|---|
| Coarse sands | Medium sands | Fine sands | Coarse silty sand | Mixed sands | Coarse sands | Medium sands | Fine sands | Coarse silty sand | Complex sand | |
| 0 | 13.01 | 16.30 | 23.37 | 31.77 | 28.56 | 15.10 | 5.23 | 10.01 | 28.68 | 16.21 |
| 10 | 14.46 | 17.55 | 26.78 | 33.66 | 32.32 | 15.90 | 7.62 | 13.12 | 32.34 | 29.00 |
| 20 | 14.66 | 17.86 | 29.04 | 41.56 | 35.04 | 16.70 | 8.91 | 15.33 | 36.55 | 41.12 |
| 30 | 14.95 | 19.55 | 33.63 | 52.87 | 36.20 | 17.20 | 9.42 | 19.11 | 39.79 | 58.89 |
| 40 | 15.43 | 20.75 | 35.23 | 69.04 | 38.91 | 17.80 | 11.15 | 22.23 | 43.94 | 74.23 |
| 50 | 16.78 | 20.95 | 38.78 | 82.72 | 39.38 | 17.90 | 14.09 | 26.36 | 46.88 | 97.18 |
| 60 | 17.26 | 21.82 | 40.48 | 102.31 | 43.28 | 18.20 | 16.78 | 31.19 | 58.46 | 125.24 |
| 70 | 18.27 | 22.46 | 41.02 | 143.71 | 46.25 | 18.80 | 20.44 | 38.46 | 78.11 | 186.27 |
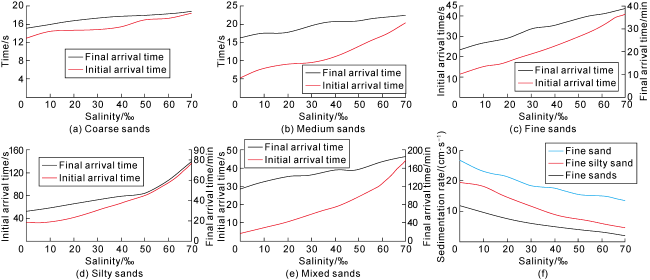
Fig. 8. Sedimentation rates of different grains at different salinities. |
Table 2. Sedimentation rates and transport distances of different-grained samples at different salinities |
| Salinity/‰ | Average sedimentation rate/(cm•s-1) | Transport distance/m | |||
|---|---|---|---|---|---|
| Fine sand | Coarse silty sand | Fine silty sand | 24 h | 48 h | |
| 0 | 26.68 | 19.47 | 11.89 | 2.34 | 3.21 |
| 10 | 23.17 | 18.14 | 9.80 | 2.41 | 3.53 |
| 20 | 21.31 | 14.71 | 7.44 | 2.79 | 3.92 |
| 30 | 18.37 | 11.60 | 6.13 | 3.12 | 4.46 |
| 40 | 17.48 | 8.92 | 5.10 | 3.51 | 4.99 |
| 50 | 15.43 | 7.47 | 4.17 | 3.89 | 5.54 |
| 60 | 14.89 | 5.82 | 3.29 | 4.44 | 6.04 |
| 70 | 13.22 | 4.61 | 1.87 | 4.92 | 6.87 |
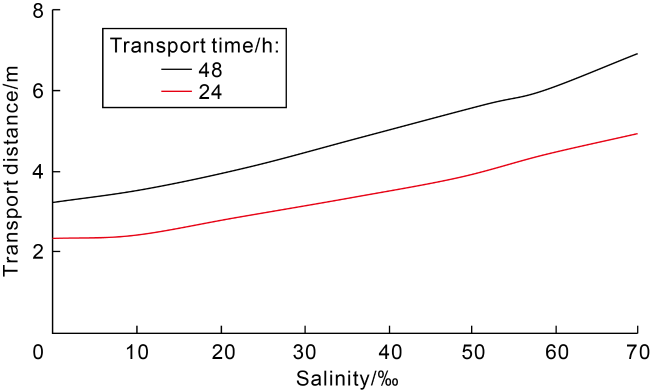
Fig. 9. Transport distances of mixed sands at different salinities. |
Secondly, water salinity has a significant impact on the distribution range of sediments. The author [20] has conducted systematic sampling of the Neogene strata in the Qaidam Basin, quantitative restoration of paleosalinity with the Couch formula using data of boron element and clay mineral content, and calculated the paleosalinity using salt inclusion to determine the planar variation of the paleosalinity. In this study, additional mudstone samples were collected from the key sand groups in N1 and N21 in the southwestern Qaidam Basin, and the same methods were used for paleosalinity restoration. It should be noted that there is a large discrepancy between the paleosalinity restored by the boron element method and the inclusion method, but the paleosalinity restored by the boron element method can be used as a normal systematic error. The superimposition of paleosalinity on the sedimentary facies map (Fig. 10 ) shows that the salinity is 8‰-10‰ in the delta front, 8‰-18‰ in the shoal- shallow lake, higher than 18‰ in the semi-deep lake, and higher than 8‰ in the lake basin. It indicates that beach bars are developed in the lake water with a salinity of 8‰-16‰, generally ranging between 10‰ and 18‰. Therefore, water salinity controls the sedimentation rate and offshore distance of beach-bar sand bodies.
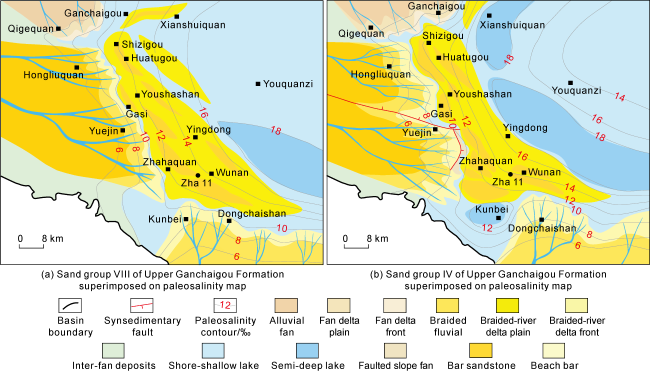
Fig. 10. Sedimentary facies maps of key sand groups of Upper Ganchaigou-Lower Youshashan formations superimposed on paleosalinity maps, southwestern Qaidam Basin. |
3.2. Debris input controls the scale and accumulation of beach-bar sand bodies
It was shown by the sedimentary facies distributions of different sand groups in the southwestern Qaidam Basin (Fig. 10 ) that during the N1-N21 period, the northern water system extended 70 km and controlled an area of 1100 km2, and the southern water system extended 95 km and controlled an area of 1700 km2 in the study area, indicating that the debris input of the southern water system was greater than that to the northern one. The major areas that the northern water system influenced include Huatugou, Youshanshan and Gasai, etc., where the beach-bar sand bodies have a distribution width of 10-15 km and a distribution area of 400-700 km2. The major areas that the southern water system affected include Yuejin, Zhahaquan and Wunan, etc., where the beach-bar sand bodies have a distribution width of 10-35 km and a distribution area of 800-1100 km2. It indicates that the distribution width and area of beach-bar sandstones are wider with sufficient debris supply.
3.3. Ancient landform controls the shape and stacking style of beach-bar sandstone
During the depositional period of the Upper Gangchaigou Formation, the southwestern Qaidam Basin had a geomorphological setting higher in the west and lower in the east, including uplift, slope and depression, and developed two types of ancient landforms (Fig. 11a ). One is the ancient low uplift in the slope area locally, represented typically by Gasi area, a nearly NS-trending low uplift area. On its west side, braided river delta front deposits were developed. With a medium-intensity of debris supply, thick beach-bar sandstones with a few layers were developed on the ancient low uplift. Blocked by the low uplift, its east side was dominated by carbonate rock and mudstones and had relatively limited distribution of beach-bar sandstones (Fig. 11b ). The other one is a wide and gentle slope area, represented typically by Zhahaquan area that is adjacent to the braided river delta front to the west. With abundant debris supply, the beach-bar sand bodies were vertically stacked and laterally continuous in wide and large distribution (Fig. 11c ). Ancient landforms have a significant controlling effect on beach bars that are barely distributed in low paleouplift areas and extensive in wide and gentle slope areas.
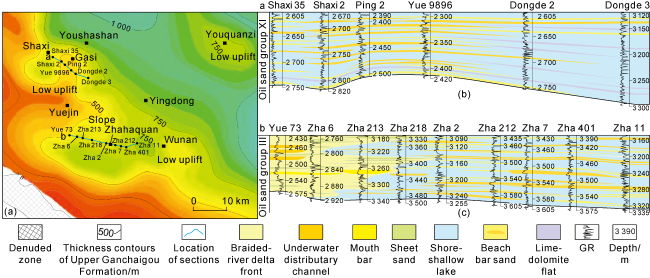
Fig. 11. Ancient landforms and sections of beach-bar sand bodies of the Upper Ganchaigou Formation in southwestern Qaidam Basin. |
3.4. Monsoon driving effect controls the long axis extension direction of beach-bar sandstone
Some scholars [32⇓⇓-35] have conducted researches on paleowind direction identification and analyzed its impact on beach bar sedimentation. Shang and Hu et al. [36-37] proposed that wave action affects beach bar sedimentary differentiation and lake waves control the formation and distribution of beach-bar sandstone. Jiang et al. [2] reported that waves are the driving force while the provenance is the material basis for the formation of beach- bars, and put forward a formation pattern of "wind (wind waves)-provenance (sediment supply)-basin (basin evolution)" for beach bars. Wang et al. [18] believed that hydrodynamics is the main geological force, and influenced by the northwest winds, beach bars were mainly developed on the east, north, and south of the lake basin in the Qinghai Lake. According to the hydrodynamic characteristics (Fig. 12a , 12b) and the distribution of sand bodies (Fig. 12c , 12d) of the Erlangjian sand spit of the Qinghai Lake, the irregular shape and directional distribution of the sand spits are controlled by the northwest wind waves. An et al. [38] studied the evolution of the monsoon-arid environment in China and the growth of the Qinghai-Tibet Plateau since the Neogene. They suggested that monsoons controlled the climate of China's continental environments since 24 Ma (Neogene), and monsoons were intensified since 16 Ma. The modern distribution of beach bars in the Qinghai Lake is greatly influenced by wind direction. The Neogene beach bars in the southwestern Qaidam Basin are distributed in NW-SE en echelon (Figs. 7 and 12e ). Based on previous research results of monsoons and Qinghai Lake, it is believed that the Neogene beach-bar sandstone in the saline lake basin are influenced by the northwest monsoon, and the jointing effect of wind-driven waves, coastal currents and lake currents are the key drivers of the en echelon distribution of beach-bar sandstone in the southwestern Qaidam Basin.
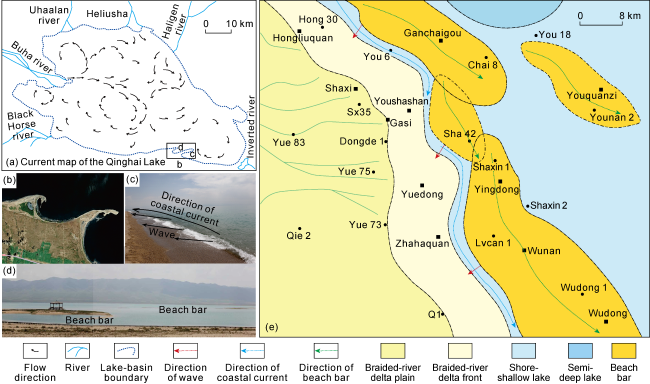
Fig. 12. Modern lake current and typical beach bars in the Qinghai Lake, and beach-bar sandstone map superimposed on wave and coastal current map in southwestern Qaidam Basin. |
4. Hydrocarbon accumulation of beach-bar sandstone in saline lake basin and its favorable exploration areas
4.1. Distribution of oil and gas in beach-bar sandstones and related reservoir types
4.1.1. Distribution of oil and gas in beach-bar sandstones
Based on the recent well test results, oil and gas shows in core samples, and well logging interpretations of the Neogene in the southwestern Qaidam Basin, six E-W oil and gas distribution sections were compiled. For example, on the Yuejin-Zhahaquan-Wunan (Well Yue73-Well Wu26) section (Fig. 13 ), braided river delta sand bodies are sourced from the west, and Yuejin area is dominated by the braided river delta front. The braided river delta of Upper Ganchaigou-Lower Youshashan formations has progradation features, and the influence from late delta sand bodies expands to the Zha 104 wellblock. The sand bodies in the braided river delta front are well developed and have good connectivity. Oil layers are only developed at the bottom of N21 in Well Zha3, while other layers are interpreted as water layers and dry layers by logging data. The shoal-shallow lake facies covers a large area with widely distributed beach-bar sand bodies. The beach-bar sand bodies have favorable oil-bearing properties. They have multiple oil layers vertically, and horizontally are stacked and continuous, migratory laterally. However, not all beach-bar sand bodies contain oil, presenting a reservoir distribution featured by "one reservoir in one sand body".
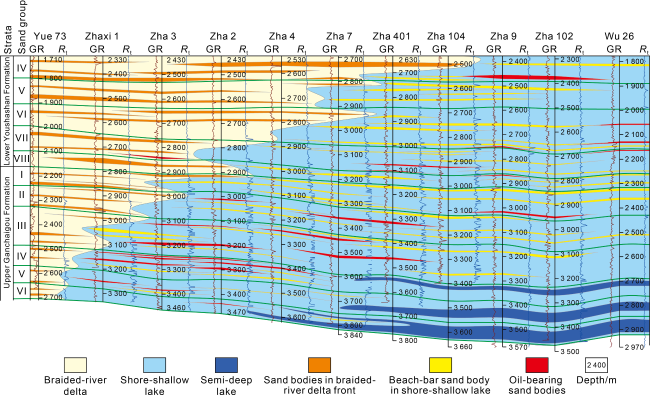
Fig. 13. The Upper Ganchaigou-Lower Youshashan stratigraphic section across wells Yue73 and Wu26 in southwestern Qaidam Basin (see |
4.1.2. Reservoir types and accumulation patterns
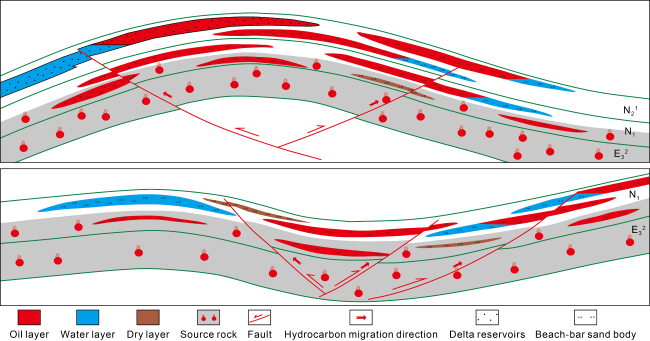
Based on well test results and oil and gas distribution characteristics, five oil reservoir sections were compiled. For example, on the Upper Ganchaigou Formation oil reservoir section across Well Zha213-Well Zha11 in Zhahaquan area (Fig. 14 ), there is no unified oil-water interface in oil reservoirs. Oil reservoirs are developed at structural highs (such as Well Zha201 and Well Zha11), structural lows (such as Well Zha210), and slopes (such as Well Zha4). According to the structural features, it’s believed that there are three types of reservoir, namely structural reservoir, structural-lithologic reservoir and lithologic reservoir in Zhahaquan area. The correlation among source rocks, faults and beach-bar sand bodies reveals a reservoir-forming feature of "one reservoir in one sand body". However, effective hydrocarbon accumulation depends on the spatiotemporal configuration of oil sources, faults, and effective sand bodies. Therefore, oil and gas accumulation patterns were established for the beach-bar sandstone reservoirs in the saline lake basin (Fig. 15 ). Comprehensive analysis indicates that thick beach-bar sand bodies in depression and structural wings, and oil-source faults control the oil and gas accumulation. Specifically, thick beach-bar sand bodies control the distribution of effective reservoirs and oil-source faults control the main migration direction of oil and gas.
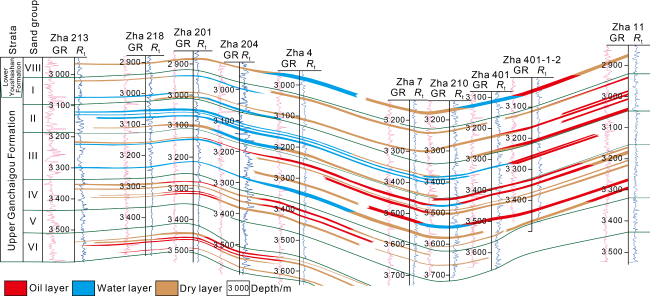
Fig. 14. The Upper Ganchaigou oil reservoir section across wells Zha213 and Zha11 in southwestern Qaidam Basin (see |
Fig. 15. Hydrocarbon accumulation patterns of beach-bar sand bodies in saline lake basin. |
4.2. Favorable exploration areas of beach-bar sandstones
Through an analysis of the distribution and spatial and temporal relationship among hydrocarbon source rocks, faults, and beach-bar sand bodies, combined with oil and gas shows, three favorable exploration targets of the beach bars of the Upper Ganchaigou Formation-Lower Youshashan Formation are proposed in the southwestern Qaidam Basin (Fig. 7 ).
(1) The southern Zhahaquan area (Fig. 7a ), with the lower part of the Upper Ganchaigou Formation as the target layer. This area has similar source-storage-transportation conditions for oil and gas to Zhahaquan area where industrial oil and gas have been found, and thick beach-bar sand bodies are developed. Therefore, the southern Zhahaquan area is a realistic exploration target for beach bar reservoirs.
(2) The Yingdong-eastern Wunan area (Fig. 7b -7d), located in the Yingxiongling structural belt. The upper part of the Upper Ganchaigou Formation and the Lower Youshashan Formation are the target layers. Industrial oil and gas have been discovered in neighboring Yingdong and Wunan areas, and lacustrine carbonate reservoirs and oil-source faults are developed. Therefore, this area is an important option for the exploration and discovery of large-scale beach bar reservoirs in the southwestern Qaidam Basin.
(3) The eastern Huatugou area (Fig. 7d ), located in the Yingxiongling structural belt. The Lower Youshashan Formation is the target layer. In neighboring Huatugou and Youyuangou areas, industrial oil and gas have been discovered with developed beach-bar sand bodies and lacustrine carbonate reservoirs, and oil-source faults are developed near the Hongshi hydrocarbon generation depression. Therefore, this area is an important target for the exploration and discovery of large-scale beach bar reservoirs in the southwestern Qaidam Basin.
5. Conclusions
The beach bar sand bodies developed in the Neogene saline lake basin in the southwestern Qaidam Basin are fine sandstone and siltstone with wavy bedding, low- angle cross bedding, and lenticular-vein bedding. There are three types of sedimentary sequences, i.e., single-stage upward-coarsening sequence, overlapping of multi-stage upward-coarsening sequences, and upward-fining mixed with upward-coarsening sequences. The top of beach-bar sandstone generally develops oolitic limestone and micrite. The Neogene beach bars in saline lake basin are stacked in multiple stages, and migratory laterally and extensive and continuous in NW-SE trending pattern. The stacking area of beach-bar sandstone is predicted to be 3000 km2.
The water body of saline lake basin with salinity ranging from 8‰ to 18‰ influences the sedimentation rate and offshore distance of the beach bars. Terrigenous debris input controls the scale and enrichment of beach-bar sandstones, which is distributed within a range of 3-15 km from the delta front. Ancient landform controls the morphology and stacking style of beach-bar sand bodies. Less beach-bar sand bodies are distributed in low uplift area, while more in wide and gentle slope area. The northwest monsoon has an impact on the long axis extension direction of beach-bar sandstones, resulting in the NW-SE en echelon distribution.
The beach bars have a reservoir-forming feature of "one reservoir in one sand body", with thick beach-bar sand bodies controlling the effective reservoir distribution, oil-source faults controlling the direction of oil and gas migration and accumulation direction, and the good match of oil-source faults and thick beach-bar sand bodies in depression area and structural wings control oil and gas distribution and accumulation. Three favorable exploration targets were proposed: (1) southern Zhahaquan area, (2) Yingdong-eastern Wunan area, and (3) eastern Huatugou area. They provided important basis for the exploration breakthrough to shallow lithologic oil reservoirs in the southwestern Qaidam Basin. High-yield industrial oil and gas flows have been obtained from Well Qietan2 drilled in Zhahaquan area. The development characteristics and distribution prediction of lacustrine beach-bar sand bodies are of great significance to the extensive exploration of lithologic oil and gas reservoirs in the southwestern Qaidam Basin.