

Introduction
Tight shale oil reservoirs are widely distributed in the Ordos Basin and have good development prospects [1-2]. To develop unconventional tight shale oil reservoirs with low porosity and low permeability, multi-stage and multi-cluster fracturing horizontal wells are the essential means[3⇓⇓-6]. At present, the parallel well factory mode (PWFM) is commonly adopted [7]. Some shale oil reserves of the Changqing Oilfield are distributed in environmentally sensitive areas of water or forest sources, where PWFM cannot be applied. As a result, the fan well factory mode (FWFM) is proposed. Because the orientations of the horizontal wellbores in a fan-shaped well pattern are usually deviated from the direction of the minimum horizontal stress by different angles, and the well spacing between adjacent horizontal wells increases continuously from the heel to the toe, hydraulic fractures would not propagate on a plane, which affects fracturing performance to some extent. It is urgent to comprehensively design the well-factory fracturing program for fan-shaped well patterns based on geology-engineering integration.
In this paper, a FWFM geomechanical model is firstly established based on a fan-shaped well pattern. By applying an induced-stress model, the stress evolution in the conventional and potential production zones is analyzed.
Additionally, considering stress interference and fracture propagation, a fracturing design for effectively stimulating the potential production zone is proposed. Then production evaluation and prediction are carried out. Finally, a fracturing parameter optimization method based on geological-engineering integration is developed for volumetric fracturing of fan-shaped horizontal well pattern.
1. Integrated geology and engineering modeling of volumetric fracturing
1.1. 3D geomechanical model
The Young's modulus and Poisson's ratio of reservoir rock are calculated by [8]:
${{G}_{\text{dyn}}}=13\ 474.45\frac{{{\rho }_{\text{b}}}}{{{D}_{\text{ts}}}^{2}}$
${{K}_{\text{dyn}}}=13\ 474.45\frac{{{\rho }_{\text{b}}}}{{{D}_{\text{tc}}}^{2}}-\frac{4{{G}_{\text{dyn}}}}{3}$
${{E}_{\text{dyn}}}=\frac{9{{G}_{\text{dyn}}}{{K}_{\text{dyn}}}}{{{G}_{\text{dyn}}}+3{{K}_{\text{dyn}}}}$
${{E}_{\text{sta}}}=0.65{{E}_{\text{dyn}}}+43.6$
${{E}_{\text{sta}}}=\frac{R_{\text{sp}}^{2}-2}{2R_{\text{sp}}^{2}-2}$
${{\nu }_{\text{sta}}}=0.95{{\nu }_{\text{dyn}}}$
The formulas for calculating the initial horizontal principal stresses are [8]:
${{\sigma }_{\text{h}}}=\frac{{{v}_{\text{sta}}}{{\sigma }_{\text{v}}}}{1-{{v}_{\text{sta}}}}-\frac{{{v}_{\text{sta}}}\alpha {{p}_{\text{p}}}}{1-{{v}_{\text{sta}}}}+\alpha {{p}_{\text{p}}}+\frac{{{E}_{\text{sta}}}{{\varepsilon }_{\text{H}}}}{1-{{v}_{\text{sta}}}^{2}}+\frac{{{v}_{\text{sta}}}{{E}_{\text{sta}}}{{\varepsilon }_{\text{h}}}}{1-{{v}_{\text{sta}}}^{2}}$
${{\sigma }_{\text{H}}}=\frac{{{v}_{\text{sta}}}{{\sigma }_{\text{v}}}}{1-{{v}_{\text{sta}}}}-\frac{{{v}_{\text{sta}}}\alpha {{p}_{\text{p}}}}{1-{{v}_{\text{sta}}}}+\alpha {{p}_{\text{p}}}+\frac{{{E}_{\text{sta}}}{{\varepsilon }_{\text{h}}}}{1-{{v}_{\text{sta}}}^{2}}+\frac{{{v}_{\text{sta}}}{{E}_{\text{sta}}}{{\varepsilon }_{\text{H}}}}{1-{{v}_{\text{sta}}}^{2}}$
The brittleness index is calculated by using elastic parameters [9]:
${{B}_{\text{I}}}=\frac{1}{2}\left( \frac{{{E}_{\text{sta}}}-{{E}_{\text{sta}}}_{\text{min}}}{{{E}_{\text{sta}}}_{\text{max}}-{{E}_{\text{sta}}}_{\text{min}}}+\frac{{{v}_{\text{sta}}}-{{v}_{\text{sta}}}_{\text{max}}}{{{v}_{\text{sta}}}_{\text{min}}-{{v}_{\text{sta}}}_{\text{max}}} \right)$
1.2. Calculation of induced stress based on dislocation theory
$\frac{{{\sigma }_{xx}}}{{{\sigma }_{0}}}={{b}_{x}}\frac{y}{R\left( R+\lambda \right)}\left[ 1+\frac{{{x}^{2}}}{{{R}^{2}}}+\frac{{{x}^{2}}}{R\left( R+\lambda \right)} \right]+ {{b}_{y}}\frac{x}{R\left( R+\lambda \right)}\left[ 1-\frac{{{x}^{2}}}{{{R}^{2}}}-\frac{{{x}^{2}}}{R\left( R+\lambda \right)} \right]$
$\frac{{{\sigma }_{yy}}}{{{\sigma }_{0}}}=-{{b}_{x}}\frac{y}{R\left( R+\lambda \right)}\left[ 1-\frac{{{y}^{2}}}{{{R}^{2}}}-\frac{{{y}^{2}}}{R\left( R+\lambda \right)} \right]- {{b}_{y}}\frac{x}{R\left( R+\lambda \right)}\left[ 1+\frac{{{y}^{2}}}{{{R}^{2}}}+\frac{{{y}^{2}}}{R\left( R+\lambda \right)} \right]$
$\frac{{{\sigma }_{zz}}}{{{\sigma }_{0}}}={{b}_{x}}\left[ \frac{y\lambda }{{{R}^{3}}}+\frac{2\nu y}{R\left( R+\lambda \right)} \right]+{{b}_{y}}\left[ -\frac{x\lambda }{{{R}^{3}}}-\frac{2\nu x}{R\left( R+\lambda \right)} \right]$
where ${{\sigma }_{0}}={E}/{\left[ 8\pi \left( 1-{{\nu }^{2}} \right) \right]}\;, R=\sqrt{{{x}^{2}}+{{y}^{2}}+{{\left( d-z \right)}^{2}}}$.
1.3. Simulation of fracture propagation based on discrete lattice method
$\left\{ \begin{align} & {{F}_{\text{N, }t+\Delta t}}\text{=}{{F}_{\text{N, }t}}+{{{\dot{u}}}_{\text{N, }t}}{{k}_{\text{N}}}\Delta t \\ & {{F}_{\text{S, }t+\Delta t}}\text{=}{{F}_{\text{S, }t}}+{{{\dot{u}}}_{\text{S, }t}}{{k}_{\text{S}}}\Delta t \\ \end{align} \right.$
When the normal stress or shear stress exceeds the tensile strength or shear strength of the spring, micro- cracks will be induced. The cracks are connected via fluid channels. The flow rate from fluid elements A to B is [11]:
$Q=\beta {{K}_{\text{r}}}\frac{{{a}^{3}}}{12\mu }\left[ {{p}_{\text{A}}}-{{p}_{\text{B}}}+{{\rho }_{\text{w}}}g({{z}_{^{\text{A}}}}-{{z}_{^{\text{B}}}}) \right]$
1.4. Post-fracturing production simulation of fan-shaped horizontal well pattern
The post-fracturing production model is established based on a two-phase black-oil model, by following the mass balance equation and the Darcy's law:
$\frac{\partial \left( {{\rho }_{\text{o}}}\phi {{S}_{\text{o}}} \right)}{\partial t}+\nabla \cdot \left[ -{{\rho }_{\text{o}}}\frac{K{{K}_{\text{ro}}}}{{{\mu }_{\text{o}}}}\left( \nabla {{p}_{\text{o}}}-{{\rho }_{\text{o}}}g\nabla D \right) \right]=\frac{{{\rho }_{\text{o}}}{{Q}_{\text{o}}}}{{{V}_{\text{p}}}}$
$\frac{\partial \left( {{\rho }_{\text{w}}}\phi {{S}_{\text{w}}} \right)}{\partial t}+\nabla \cdot \left[ -{{\rho }_{\text{w}}}\frac{K{{K}_{\text{rw}}}}{{{\mu }_{\text{w}}}}\left( \nabla {{p}_{\text{w}}}-{{\rho }_{\text{w}}}g\nabla D \right) \right]=\frac{{{\rho }_{\text{w}}}{{Q}_{\text{w}}}}{{{V}_{\text{p}}}}$
If capillary force is ignored, there is ${{p}_{\text{o}}}={{p}_{\text{w}}}$. The relationship between fluid compressibility and density is:
${{C}_{o}}=\frac{1}{{{\rho }_{o}}}\frac{\partial {{\rho }_{o}}}{\partial {{p}_{o}}}$
${{C}_{w}}=\frac{1}{{{\rho }_{w}}}\frac{\partial {{\rho }_{w}}}{\partial {{p}_{w}}}$
If no source of flow (oil and water), ${{Q}_{\text{o}}}={{Q}_{w}}=0$.
The final post-fracturing production model coupled with the above equations is:
$\left[ {{S}_{\text{w}}}\phi {{c}_{\text{w}}}+\left( 1-{{S}_{\text{w}}} \right)\phi {{c}_{\text{o}}} \right]\frac{\partial {{p}_{\text{o}}}}{\partial t}+\nabla \cdot \left[ -\left( \frac{K{{K}_{\text{rw}}}}{{{\mu }_{\text{w}}}}\nabla {{p}_{\text{o}}}+ \right. \right. \left. \left. \frac{K{{K}_{\text{ro}}}}{{{\mu }_{\text{o}}}}\nabla {{p}_{\text{o}}}-\frac{K{{K}_{\text{ro}}}}{{{\mu }_{\text{o}}}}{{\rho }_{\text{o}}}g\nabla D-\frac{K{{K}_{\text{rw}}}}{{{\mu }_{\text{w}}}}{{\rho }_{\text{w}}}g\nabla D \right) \right]=0$
1.5. Integrated simulation procedures
The integration of geology and engineering connects four disciplines (i.e., well drilling and completion, geology, reservoir stimulation and productivity evaluation) together. Based on the theoretical models mentioned above, the specific integration of geology and engineering for volumetric fracturing for FWFM is established (Fig. 1 ), including four modules: geo-mechanical modeling, calculation of induced stress field, fracturing design optimization, and productivity evaluation.
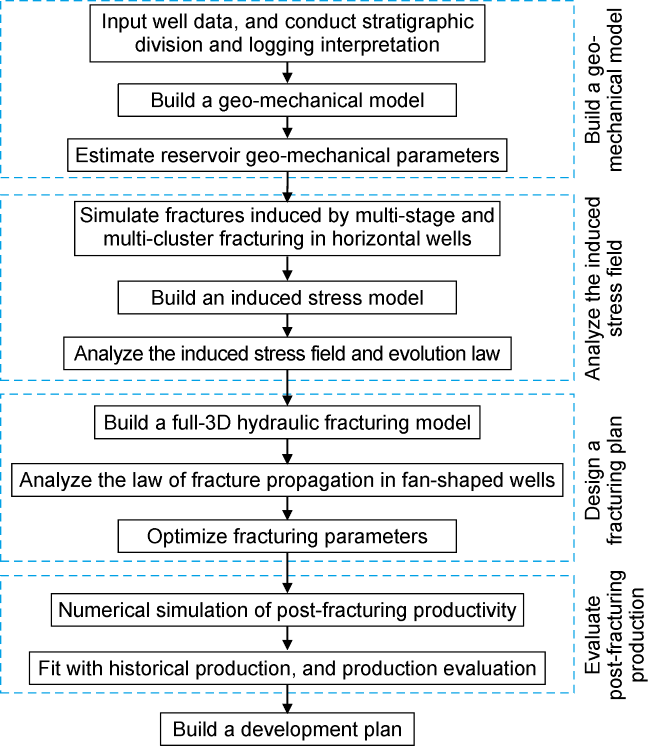
Fig. 1. Technical process of an integrated geology and engineering method for fan-shaped well pattern. |
2. 3D geomechanical modeling of fan-shaped well pattern
Totally, 14 traditional horizontal wells, 7 fan-shaped horizontal wells, and 1 oblique horizontal well are deployed on a fan-shaped well pattern for developing shale oil reservoirs in Changqing Oilfield (Fig. 2 ). The area where traditional horizontal wells are located is called a traditional production area, in which horizontal wellbores are mainly arranged along the optimal direction (that is the direction of the minimum horizontal stress). The angle between the horizontal sections of well 1, wells 4 to 7 and the direction of the minimum horizontal stress is relatively small (less than 60°), so the expected stimulation performance is good. The angle between the wellbore sections of wells 2 and 3 and the direction of the minimum horizontal stress is relatively large (more than or equal to 60°), so they are difficult to be stimulated. The area where these two wells are located is called a potential production area. In the potential production area, the well spacing near the heel is relatively small, so the corresponding well section is defined as zone I, while the well spacing far away from the heel is relatively large, so the well section is defined as zone II. Similarly, in the conventional production area, the well section near the heel is called an interference zone, while the well section far away from the heel is a non-interference zone, respectively.
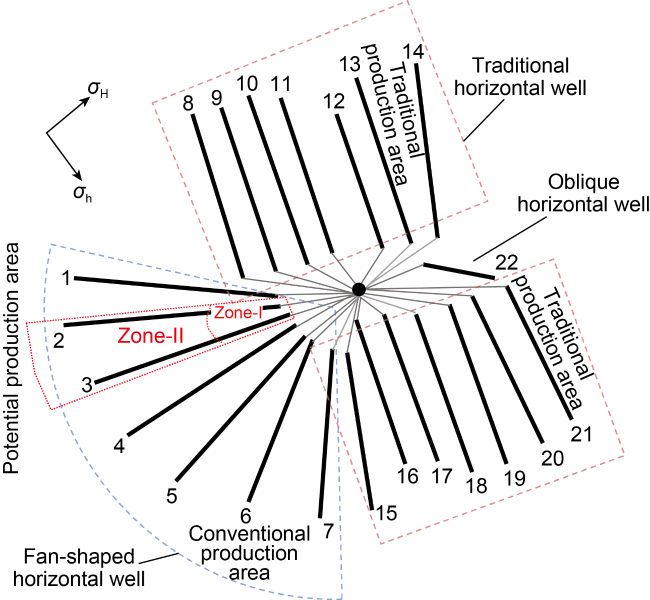
Fig. 2. FWFM development model for H1 pad. |
Based on the aforementioned geomechanical approach, field data acquired on the fan-shaped well pattern, and logging interpretation, the reservoir geomechanical parameters are obtained. Then the refined model for reservoir lithofacies, physical properties and geomechanics is established using the Kriging interpolation algorithm. The simulation results of geomechanical parameters are shown in Fig. 3 . According to the geomechanics model, the elastic modulus of the reservoirs is 28-34 GPa, the Poisson's ratio is 0.15-0.30, the porosity is 8%-9%, the permeability is (0.08-0.10)×10−3 μm2, the minimum horizontal stress is 26-32 MPa, the maximum horizontal stress is 32-40 MPa, and the brittleness index is 0.5-0.6.
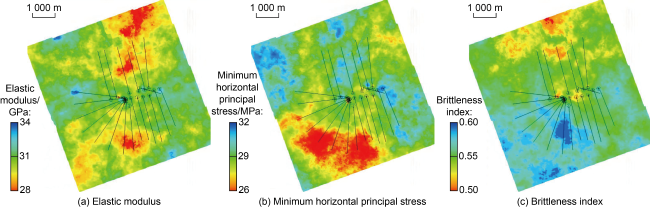
Fig. 3. Distribution of geo-mechanical parameters. |
3. Induced stress in fan-shaped well pattern
The stress field of the fan-shaped well pattern obtained from the 3D geomechanical model (Fig. 3b ) was directly imported into the induced stress model based on the dislocation theory. Then the stress field was updated according to the horizontal fracturing design (Fig. 4 ). Taking wells 1 to 7 which deviate from the direction of the minimum horizontal stress (σh) as a case, we optimize the fracturing design of fan-shaped well pattern based on the stress field.
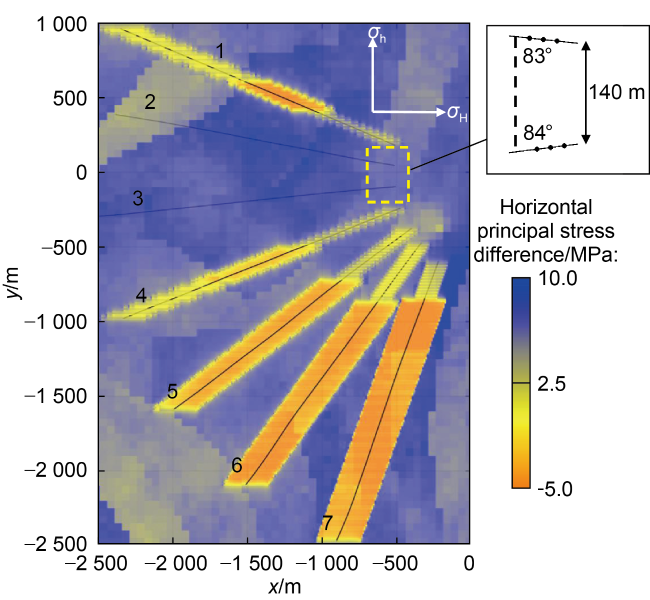
Fig. 4. Distribution of stress field in fan-shaped well pattern. |
3.1. Fracturing design for the conventional production area
Before fracturing the horizontal wells in the potential production area, we need to consider the impact of the stress induced in the conventional production area. Due to the stress shadow effect, the difference between the maximum and the minimum horizontal stresses in the potential production area will reduce (and even stress reversal may occur). This phenomenon can promote the fractures of formation as perpendicular as possible to the horizontal wellbore, and improve fracturing stimulation. Therefore, the work plan is first to implement fracturing on the wells in the conventional production area, and then on the wells in the potential production area. The specific fracturing sequence in the conventional production area is Well 1 → Well 7 → Well 6 → Well 5 → Well 4, and the fracturing design for the interference zone is different from that for the non-interference zone. The former is fractured by one cluster per stage, while the latter is three clusters per stage.
The design of stage spacing and cluster spacing is mainly based on the difference between the maximum and the minimum horizontal stresses. When the difference is less than zero, it indicates that stress reverse occurred after fracturing on the horizontal wells in the conventional production area. Fig. 5 shows the induced stress effect generated by previous fracturing stages on the horizontal stress difference in subsequent fracturing stages, in which the initial stress field is considered. It’s found that when the stage spacing is larger than 15 m, the horizontal stress difference is always larger than 0, indicating that stress reversal hasn’t occurred after hydraulic fracturing with this fracturing design; when the stage spacing is 10 m and the number of stages is more than 2, the horizontal stress difference is less than 0, indicating that stress reversal has occurred. Based on the fracturing sequence and fracturing design, the fracture layout of the horizontal wells in the conventional production area was optimized (Table 1 ).

Fig. 5. Effect of previous fracturing stages on the horizontal stress difference in subsequent stages. |
Table 1. Fracture design in horizontal wells in the conventional production area |
| Well No. | Interference zone | Non-interference zone | |||||
|---|---|---|---|---|---|---|---|
| Horizontal section/m | Number of fractures | Stage spacing/m | Horizontal section/m | Number of fractures | Stage spacing/m | Cluster spacing/m | |
| 1 | 220 | 11 | 20 | 560 | 42 | 30 | 15 |
| 4 | 260 | 13 | 20 | 480 | 33 | 30 | 15 |
| 5 | 320 | 16 | 20 | 890 | 75 | 15 | 10 |
| 6 | 370 | 18 | 20 | 1250 | 105 | 15 | 10 |
| 7 | 240 | 12 | 20 | 1630 | 150 | 15 | 10 |
3.2. Induced stress in the potential production area
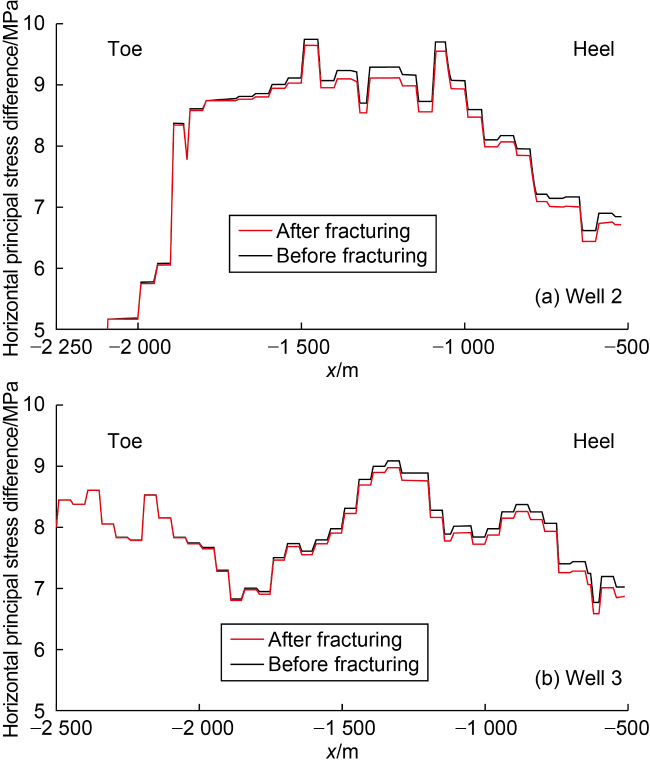
Fig. 6. Changes of horizontal stress difference along horizontal wellbores. |
4. Fracturing design for the potential production area
It is very important to clarify the propagation mechanism of hydraulic fractures, especially in a fan-shaped horizontal well pattern where the wellbores are nearly perpendicular to the direction of the minimum horizontal stress [14⇓-16]. The angles between the horizontal wellbores of wells 2 and 3 in the potential production area in H1, and the direction of the minimum horizontal stress are 83° and 84°, respectively, and the distance between the two wells is 140 m at the heel (Fig. 4 ). To compare the impacts of fracturing parameters on fracturing results, four fracturing schemes with three clusters per stage were designed for zone-I at the heel (Table 2 ). The effect of cluster spacing was studied by comparing scheme 1 with scheme 2. By keeping the same cluster spacing, the influences of fracturing only one well in the fan-shaped well pattern were analyzed between scheme 3 and scheme 4.
Table 2. Fracturing schemes for zone-I at the heel |
| Scheme | Cluster spacing/ m | Fracturing sequence | Injection rate/ (m³•min−1) |
|---|---|---|---|
| 1 | 30 | First fracturing well 2, and then fracturing well 3 | 12 |
| 2 | 8 | First fracturing well 2, and then fracturing well 3 | 12 |
| 3 | 30 | Only fracturing well 2 | 12 |
| 4 | 30 | Only fracturing well 3 | 12 |
According to post-fracturing analysis, it’s found that there was a fracture hit between wells 2 and 3 in scheme 1, making the hydraulic fractures in Well 3 not effectively propagate due to the stress shadow effect (Fig. 7a ). In scheme 2, there were fracture hits between clusters in Well 2, and some fractures in well 3 can propagate laterally, but fracture hits were still significant (Fig. 7b ). After comparing schemes 1 with 2, it is concluded that a large cluster spacing mitigates fracture interference between clusters, but there is still fracture interference between wells, resulting in the inability to effectively stimulate Well 3, so scheme 2 is not excellent, or not recommended. Compared with scheme 4 (Fig. 7d ), scheme 3 stimulated longer fractures perpendicular to the wellbore, the fractures are very complex (Fig. 7c ) and the fractured area is the largest, so scheme 3 is the best for Zone-I.

Fig. 7. Results of fracture propagation of four schemes. |
The fracturing optimization for zone-II was carried out in the same way. The optimal plan is to fracture Well 2 first and then Well 3, at an injection rate of 12 m³/min, a cluster spacing of 30 m, a stage spacing longer than 290 m, and a fracturing period of 1 h.
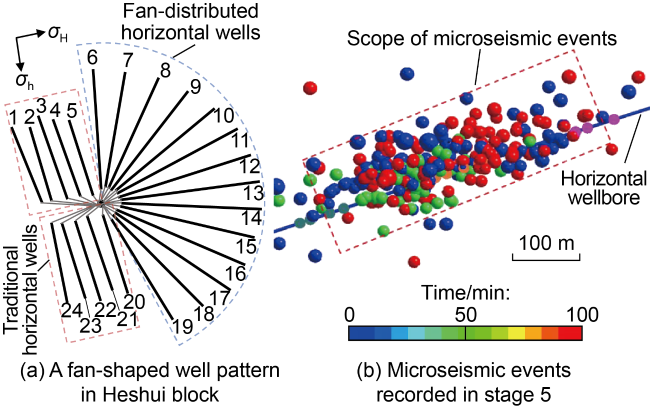
Fig. 8. Microseismic events after hydraulic fracturing in a fan-shaped well pattern in Heshui block (dots represent seismic events, and the color represents their occurrence time). |
5. Post-fracturing production simulation of fan-shaped horizontal well pattern
In field fracturing operation, hydraulic fractures in the conventional horizontal well area are usually perpendicular to the horizontal wellbores, while those in the fan-shaped horizontal well area deviate from the direction of the maximum horizontal stress by different angles. To simplify the fracture shapes, referring to the distribution of microseismic events in Fig. 8b , the well trajectories of the fan-shaped horizontal wells and the fracture lattices based on discrete lattice method were imported into the reservoir model, and then the post-fracturing production model was established.
After constructing the post-fracturing production model, the oil production of four schemes in Table 2 was compared. In the reservoir simulator, the fracture geometry was input, and the fracture width and permeability were converted into fracture conductivity. The swept scope of pore pressure after producing for 100 d (Fig. 9 ) and the cumulative oil production were calculated. It is found that schemes 2 and 3 induced larger sweep scopes of pore pressure, and scheme 4 induced the smallest sweep scope. The cumulative oil production after 100 d from scheme 3 is the highest (0.560 t), followed by scheme 2 (0.334 t), scheme 1 (0.239 t), and scheme 4 (0.158 t). Considering the sweep scope of pore pressure and oil production, scheme 3 is the best. Next, detailed evaluation and analysis of production capacity is focused on scheme 3.
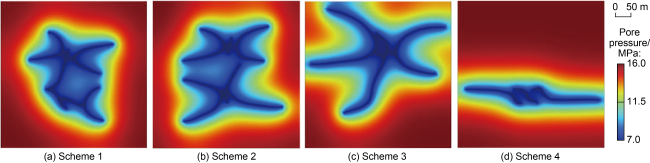
Fig. 9. Pore pressure distribution after production for 100 d. |

Fig. 10. Pore pressure based on scheme 3 after production for 3 and12 years |
The evolution of pore pressure with time along white line AB (the path passing through the toe of the horizontal wells) in Fig. 10 was traced and presented in Fig. 11 . The pore pressure at the black dot (representing the midpoint between the toes of two wells) on path AB was calibrated. Compared with the initial pore pressure, the pore pressure only decreased by 0.58 MPa after production for 10 years (the red dot in Fig. 11 ), and 1.00 MPa after 12 years (the purple dot in Fig. 11 ). According to the pore pressure profile at the toe of well 18 (along path CD) in the conventional production area (Fig. 12 ), the sweep scope of pore pressure in the conventional production area is much larger than that in the fan-shaped well area. Obviously, the reserves at the toes of the fan-shaped wells have not been effectively utilized. It is necessary to enhance hydraulic fracturing stimulation effect of the toe area by densifying induced fractures and adjusting their distribution to enlarge fractured volume and increase the level of reservoir utilization.

Fig. 11. Pore pressure distribution along AB in the potential production area (red and purple dots mean the pore pressure at the midpoint between the toes of the two wells after production for 10 and 12 years, respectively). |

Fig. 12. Pore pressure distribution along CD in the conventional production area. |

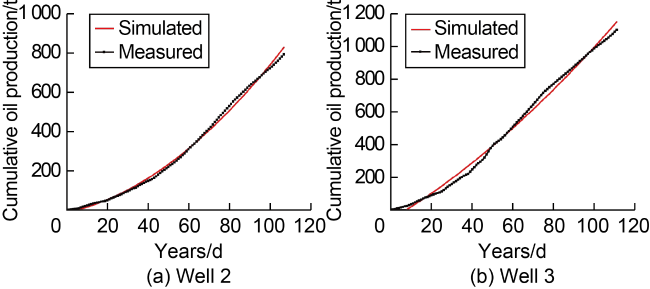
Fig. 13. Measured and simulated oil production. |
Fig. 14. Measured and simulated cumulative oil production. |
6. Conclusions
It is necessary to comprehensively design the fracturing schemes for a fan-shaped well pattern from the perspective of geological-engineering integration, in order to improve the performance of fracturing stimulation. For the H1 fan-shaped well pattern in Changqing Oilfield, after fracturing the conventional production area, the maximum reduction of the horizontal stress difference in the potential production area is 0.2 MPa. Such reduction cannot cause stress reversal, but is conducive to the lateral propagation of hydraulic fractures.
According to the comparison of fracturing schemes and productivity evaluation, for zone-I of the potential production area, the best scheme is only fracturing Well 2, with a cluster spacing of 30 m and an injection rate of 12 m3/min per stage; for zone-II, the best scheme is fracturing Well 2 and then Well 3, with a cluster spacing of 30 m and an injection rate of 12 m3/min per stage.
The sweep scope of pore pressure drop in the potential production area is small, indicating that the reservoir is not effectively utilized. It’s necessary to optimize the hydraulic fracturing design for the toe area, such as by densifying the induced fractures and adjusting the hydraulic fracture distribution, in order to enlarge the fractured volume and increase the level of reservoir utilization.
Nomenclature
a—fracture width, m;
bx, by—components of Burgers vector in two directions;
Bi—brittleness index, dimensionless;
co, cw—oil, water compressibility factors, Pa-1;
d—initial relative height, m;
Dtc, Dts—P-wave and S-wave time differences, μs/m;
D—reservoir depth, m;
E—elastic moduli, Pa;
Edyn, Esta—dynamic, static elastic moduli, Pa;
Estamax, Estamin—maximum, minimum static elastic moduli, Pa;
Fn,t, Fs,t—normal, shear stresses at time t, Pa;
Fn, t+Δt, Fs, t+Δt—normal, shear stresses at time t+Δt, Pa;
g—gravitational acceleration, m/s2;
Gdyn—dynamic shear modulus, Pa;
Kdyn—dynamic bulk modulus, Pa;
K—permeability, m2;
Kro, Krw—relative permeabilities of oil, water, dimensionless;
Kr—relative permeability, dimensionless;
kn, kS—normal, tangential stiffnesses, N/m;
pA, pB—fluid pressures in elements A and B, Pa;
po, pw—oil, water pressures, Pa;
pp—pore pressure, Pa;
Q—injection rate, m3/s;
Qo, Qw—injection rates of oil, water, m3/s;
R—distance, m;
Rsp—acoustic slowness, μs/m;
So, Sw—oil, water saturations, dimensionless;
t—time, s;
Δt—time step, s;
Vp—unit rock volume (generally 1), m3;
x, y, z—spatial coordinates, m;
zA, zB—water heads in fluid elements A and B, m;
α—effective stress coefficient, dimensionless;
β—correction constant of flow rate, dimensionless;
ρo, ρw—oil, water densities, kg/m3;
ρb—rock density, kg/m3;
νsta, νdyn—static, dynamic Poisson's ratios, dimensionless;
νsta,max, νsta,min—maximum, minimum static Poisson's ratios, dimensionless;
ν—Poisson's ratio, dimensionless;
σ0—constant stress, Pa;
σv, σH, σh—vertical, maximum horizontal, minimum horizontal stresses, Pa;
σxx, σyy, σzz—stresses in the directions of x, y, z, Pa;
εh, εH—minimum, maximum horizontal strains, dimensionless;
μ—fluid viscosity, Pa•s;
μo, μw—oil, water viscosities, Pa•s;
λ—relative heigh, m;
ϕ—porosity, %;
${{\dot{u}}_{\text{n, }t}}, {{\dot{u}}_{\text{s, }t}}$—normal, tangential velocities at time t, m/s.