

Introduction
With the support of 3D seismic attribute fusion technology, important progress has been made in recent years in the effective identification [1-2], internal structure sculpting [3⇓⇓⇓⇓-8], kinematic characterization [9⇓-11], and dynamics mode building [12⇓-14] of strike-slip faults in the deep to ultra-deep layers in the Tarim Basin. Around the exploration of the strike-slip fault zones, geological resources of 10×108 t of oil equivalent have been proven in the Fuman Oilfield [15-16]. However, with the continuous advancement of oil and gas exploration in major strike- slip fault zones, finding new exploration areas among faults is an important way to maintain the increase of ultra-deep oil and gas reserves and production. Recently, well FD1 made a breakthrough to the condensate gas reservoirs in the second member of the Yingshan Formation in the Ordovician intraplatform shoals between two NE-trending strike-slip faults (FI19 and FI20) in the Fuman Oilfield. It not only broke through the forbidden exploration zone in the ultra-deep carbonate intraplatform shoal below 8000 m, but also confirmed that the intraplatform shoal has the ability to accumulate oil and gas between major faults [17]. During the formation of major strike-slip faults, due to relative displacement difference, large-scale secondary faults are developed between the major fault zones. The exploration breakthrough in well FD1 confirmed that the intraplatform shoal reservoirs modified by secondary faults have an important exploration potential and is the next focus of exploration in the Fuman Oilfield. Therefore, it is of great significance to determine the mechanism of condensate gas reservoirs to deeply understand the factors on oil and gas accumulation in the ultra-deep reservoirs in the eastern part of the Fuman Oilfield.
The formation of deep to ultra-deep condensate gas reservoirs can be attributed to two mechanisms: primary and secondary. The former refers to the condensate gas generated directly from the organic matter in highly mature stage, while the latter refers to the condensate gas reservoirs transformed from early reservoirs, by crude oil cracking and gas injection. The formation of condensate gas reservoirs must have two conditions: (1) The formation temperature is between the critical temperature of the hydrocarbon system and the critical condensation temperature, and the formation pressure is greater than the dew point pressure at the formation temperature. (2) The gas content of hydrocarbons exceeds the amount of liquids, creating conditions for liquid retrograde condensation in the gas phase, which is the main way to form secondary condensate gas reservoir [18⇓⇓⇓-22].
Crude oil cracking is an important factor controlling the formation of deep to ultra-deep marine gas reservoirs in China. Crude oil cracking is controlled by a variety of factors, such as temperature, pressure, thermal gradient, and type of kerogen, among which temperature is the most important controlling factor. Early researches suggested that the temperature for crude oil cracking to natural gas is 150-190 °C [23-24]. Although the threshold temperature for crude oil cracking (or the lowest temperature for crude oil preservation) varies greatly from region to region due to many factors, more and more exploration examples [25⇓⇓⇓⇓⇓-31] and crude oil cracking experiments [32⇓⇓-35] have shown that liquid hydrocarbon can be preserved at least 170-180 °C, and the threshold temperature for a large amount of crude oil cracking to produce natural gas is 190-220 °C. The condensate gas reservoir of well FD1 is characterized by high temperature and high pressure. Both the reservoir and that below it has entered the window for crude oil cracking, so it is necessary to clarify its hydrocarbon genesis.
This paper analyzes the formation process of condensate gas reservoirs of well FD1 based on drilling results, low-order faults, and the physical properties and hydrocarbon genesis of the reservoirs in intraplatform shoals. The findings will provide supports for deep understanding of the reservoir conditions and distribution rules in the Middle and Upper Ordovician intraplatform shoals in the ultra-deep low-order fault zones, the Tarim Basin.
1. Geological background
The Fuman Oilfield is located at the center of the A’man Transitional Belt, and bounded the Tabei Paleo- uplift in the north, the Tazhong Paleo-uplift in the south, the A’wati Sag in the west, and the Manjiaer Sag in the east, and the main part is in the A’man Transitional Belt in the northern depression (Fig. 1a ). From the Cambrian to the early Middle and Late Ordovician, the main part of the Tarim Basin was a platform, and the platform margin was oriented in the south-north direction. Under the control of the third episode of the middle Caledonian movement (TO1-2y2), the stress field in the Tarim Basin changed from tensile to compressive in the late Middle and Late Ordovician [36⇓-38], and the platform margin changed from NS to nearly WE [39]. At the same time, NE and NW trending strike-slip fault systems began to develop in the plate [7] (Fig. 1b ).
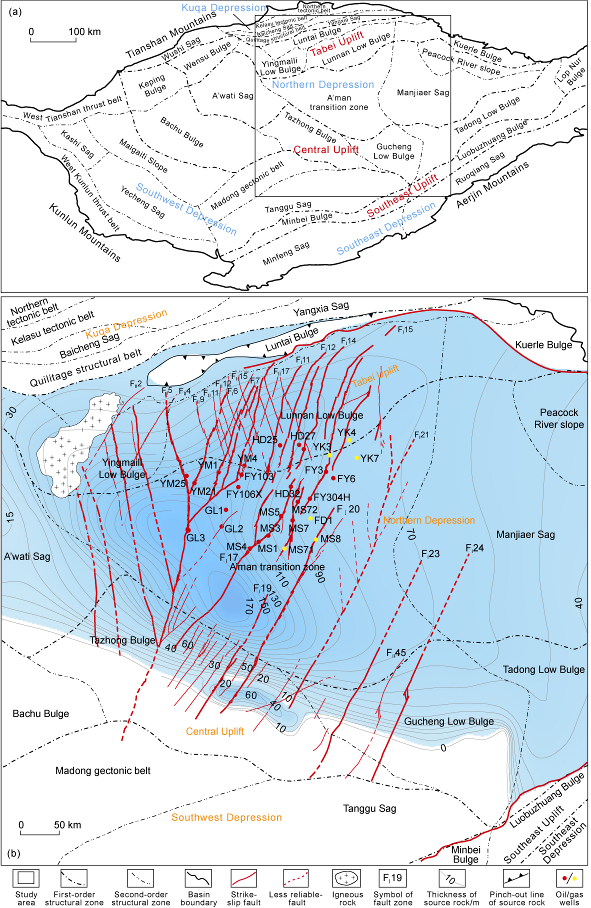
Fig. 1. (a) Location of the study area and (b) location of well FD 1 in the Fuman Oilfield. |
The carbonate reservoirs in the Ordovician Yingshan- Yijianfang formations in the Fuman Oilfield are fractured- vuggy carbonate reservoirs controlled by strike-slip faults. On the plane, oil and gas are mainly distributed as strips along the deep and big faults or the secondary faults connecting sources, generally characterized by "big fault, big reservoir" and "small fault, small reservoir". There is no uniform OWC (oil-water contact) in different fault belts, and even in different traps in the same fault belt. The main sources of Ordovician oil and gas in the A’man Transition Belt are the hydrocarbon source rocks in the condensed section of slope facies in the Lower Cambrian Yuertusi Formation and the hydrocarbon source rocks of the Cambrian to the Middle-Lower Ordovician basin-slope facies in the eastern Manjiaer Sag. The comprehensive research of fluid inclusions and geochemical characteristics of hydrocarbons shows that the key period of hydrocarbon accumulation is from Late Hercynian to Himalayan Period. Hydrocarbon accumulation is characterized by “Cambrian hydrocarbon source, vertical transport, and multi-stage and fault-controlled accumulation” [40].
2. The FD1 reservoirs
2.1. Geological characteristics
Drilling data reveals that the Yingshan Formation platform facies is 80-240 m thick in the Fuman area, and it is the thinnest in the northwest and northeast areas, generally less than 100 m, and the thickness is stable in the A’man Transition Belt in the northern depression (140-200 m), and becomes thicker towards the Manjiaer Sag [41]. The Yingshan Formation lasting 10.4 Ma is divided into two third-order sequences and four fourth- order sequences [42]. The three-order sequences (To1-2y2) divide the Yingshan Formation into two members (upper and lower). The exposure time of the interface (TO1p) between the Yingshan Formation and the underlying Penglaiba Formation is less than 8 Ma [42]. According to the short-term exposed interface (scouring and eroding, oxidizing and selective and penecontemporaneous dissolution), early diagenetic signs (ctenoid texture, geopetal structure) and lithologic conversion surface, the upper member of the Yingshan Formation (Y2) is divided into two fourth-order sequences (Y21 and Y22) (Fig. 2 )
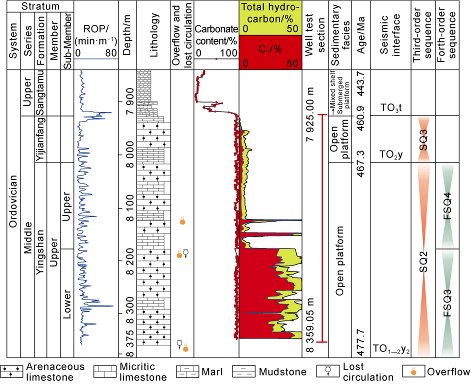
Fig. 2. Comprehensive stratigraphic histogram of well FD 1. |
The lower member of Yingshan Formation (Y1) was developed in a tensile tectonic environment which was characterized by a restricted platform facie distributed from south to north. Y2 gradually changed to open platform facies distributed near east to west with changing from a tensile tectonic environment to a compressional tectonic environment. The platform facies are divided into three subfacies: intraplatform shoal, interplatform depression or platform flat, platform margin shoal [43]. The reservoirs in Y2 in well FD1 belong to an intraplatform sandy debris shoal (Fig. 3 ).
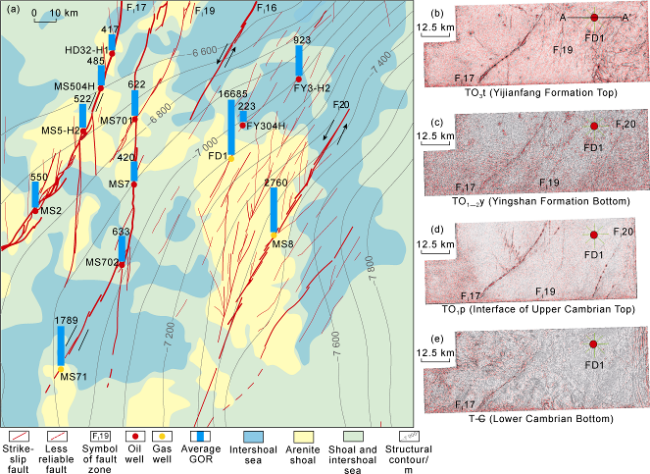
Fig. 3. (a) Structures, sedimentation, and GOR distribution at the top of the Yijianfang Formation around well FD1 and (b-e) fault morphology index maps with 0.25 subduction coefficient. |
Well FD1 was drilled since March 10, 2022, and completed in Y22 at MD 8359.05 m and VD 8318.39 m on September 6, 2022 (Fig. 2 ). During the drilling, overflow occurred for 3 times, and the cumulative lost circulation of drilling fluid with density of 1.20-2.35 g/cm3 is 6713.9 m3. Gas measurement found 41.95 m thick reservoir with the maximum total hydrocarbon of 99.9%, indicating a high-quality reservoir. In the LST (Lowstand Systems Tract) of every third-order sequence, interlayer karstification occurred due to the exposure of the intraplatform shoal to the surface and the leaching of meteoric fresh water. Alveolar cavernous quasi-layered reservoirs are found in the inner reef of the platform margin, and dissolution caves are found in the contemporaneous faults. However, early dissolution caves generally developed 2-4 generations of cements in the late burial stage [44], and these dissolution caves are prone to collapse and difficult to preserve.
Table 1. Measured porosity and permeability of deep to ultra-deep Ordovician rock core in the Tarim Basin |
| Well/Region | Layer | Porosity/% | Permeability/10-3 μm2 | Remark | Data source | |||
|---|---|---|---|---|---|---|---|---|
| Range | Average | Range | Average | |||||
| SHN4 | O2yj | 9.20 | 0.01 | 1 full diameter sample with interlayer karstification | References [42, 45] | |||
| O1-2y1 | 0.6-3.8 | 1.90 | 0.040-1.040 | 0.31 | 4 full diameter samples with interlayer karstification | |||
| O1-2y2 | 17.5-20.5 | 19.00 | 23.500-73.400 | 48.45 | 2 full diameter samples with silicification and interlayer karstification | |||
| SHN7 | O2yj | 0.2-3.5 | 1.95 | 0.002-3.500 | 1.24 | 11 full diameter samples with interlayer karstification | ||
| O1-2y1 | 1.3-3.9 | 2.35 | 0.040-3.700 | 0.61 | 13 full diameter samples with interlayer karstification | |||
| SHN6 | O2yj | 0.5-2.4 | 1.19 | 0.010-4.900 | 0.92 | 10 full diameter core samples | ||
| SHB2 | O2yj | 1.0-4.4 | 2.10 | 0.010-3.700 | 0.30 | Reference [43] | ||
| O1-2y1 | 1.7-3.2 | 1.70 | 0.020-38.800 | 3.80 | ||||
| O1-2y1 | 8.00 | 2 silicified core samples | ||||||
| Shunbei Oilfield | O1-2y—O2yj | 2.0-9.0 | 2.07 | 0.010-5.520 | <1.00 | 71 core samples | Reference [46] | |
| Fuman Oilfield | O1-2y—O2yj | 1.8-4.5 | 2.17 | 0.100-1.000 | Reference [47] | |||
| Tazhong Uplift | O1-2y2 | 1.8-4.5 | <0.010 or >10.000 | Logging data from Wells G60, G70, T162 | Reference [48] | |||
2.2. Low-order fault zone
Well FD1 is located at the low-order fault zone between two first-order NE strike-slip faults (FI19 and FI20) (Fig. 3a ). These secondary faults are vaguely visible on TO3t and TO1-2y2 morphological index maps with 0.25 subduction coefficient. They are mainly NEE and NNE trending and locally NW trending, and consistent with the occurrence of the first-order strike-slip faults (Fig. 3b , 3c ). But they are not visible on the morphologic index map with 0.25 subduction coefficient at the interface of the Upper Cambrian top and the Lower Cambrian bottom (Fig. 3d , 3e ). FI19 fault can be seen at the top of the Yijianfang Formation, the bottom of the Yingshan Formation, the top of the Upper Cambrian and the bottom of the Lower Cambrian, indicating that the first-order strike-slip fault runs through the Lower Cambrian from the Yijianfang Formation, and it is a good channel for vertical oil and gas migration. FI20 is visible at the Upper Cambrian top, but it is not visible at the Lower Cambrian bottom.
On the WE seismic profile across well FD1 (Fig. 4a ), there not only developed dense inner low-order faults, but also developed extremely dense inner beads caused by multi-periods interlayer karstification at the third and fourth sequence interfaces in the Middle-Lower Ordovician intraplatform shoals. Observed on the deeper seismic profile (Fig. 4b ), the low-order faults and beads were formed during the key tectonic revolution of the third episode of the Middle Caledonian movement [37-38], and they are not directly connected with the source rocks of the Lower Cambrian Yuertusi Formation. This indicates that the low-order faults play an important role in the development of high-quality reservoirs and hydrocarbon migration. On the other hand, it also shows that oil and gas must vertically migrate to the carrier layer through the first-order strike-slip fault that connects the source rocks of the Yuertusi Formation, and then laterally migrate and accumulate.
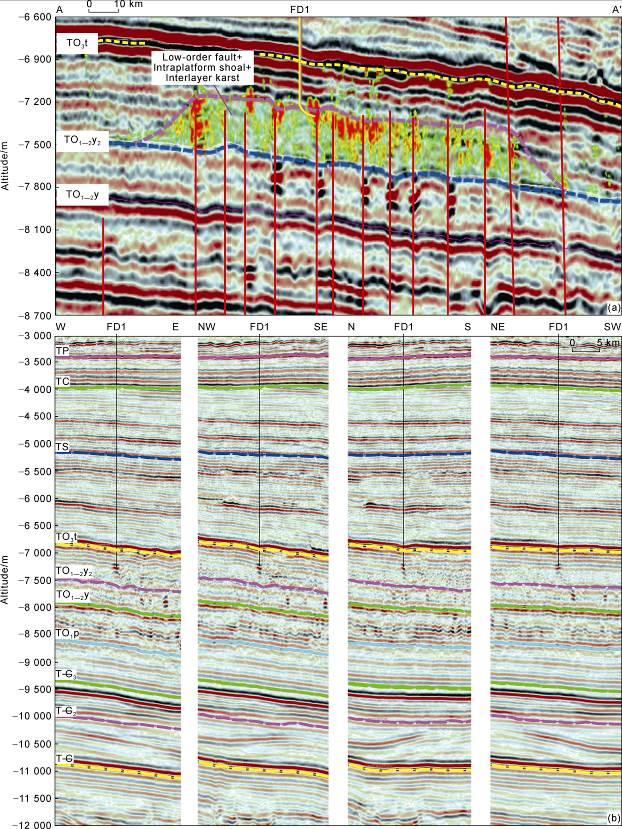
Fig. 4. 3D seismic profile across well FD1 (see the section location in Fig. 3). (a) AA' seismic profile; (b) "米-type" seismic profile. TP—Bottom of the Permian; TC—Bottom of the Carboniferous; TS—Bottom of the Silurian; TO3t—Bottom of the Tumuxiuke Formation; TO1—2y2—Bottom of the second submember of Upper Yingshan Formation; TO1—2y—Bottom of Yingshan Formation; TO1p—Bottom of Penglaiba Formation; T—C3—Bottom of Upper Cambrian; T—C2—Bottom of Middle Cam-brian; T—C—Bottom of Cambrian. |
2.3. Temperature, pressure and fluid characteristics
Routine test was conducted at 7925.00-8359.05 m in well FD1. The tubing pressure is 90.07 MPa, the open flow gas is 405 053 m3/d, and the open flow oil is 24.276 m3/d through a 7 mm nozzle. The GOR is 16 685 m3/m3, indicating a condensate gas reservoir.
Based on twelve wells drilled into the Middle-Upper Ordovician by the Sinopec Northwest China Petroleum Bureau in the FI17 strike-slip fault (the middle depth of the oil and gas layer is 7549.20-8185.19 m), the formation temperature of the Middle-Upper Ordovician is 152-171 °C, the formation pressure is 61.76-91.64 MPa, and the pressure coefficient is 0.81-1.21, indicating a normal to low-amplitude overpressure system. In two wells drilled into the Middle-Upper Ordovician in the FI20 strike-slip fault zone (the middle depth of the oil and gas layer is 8062.01-8178.01 m), the formation temperature of the Middle-Upper Ordovician is 141-178 °C, the formation pressure is 72.81-95.47 MPa, and the pressure coefficient is 0.92-1.19, also indicating a normal to low-amplitude overpressure system. Therefore, the formation temperature at 8000 m in and around well FD1 is 160-180 °C; the formation pressure is greater than 90 MPa, and the pressure coefficient is not more than 1.2, indicating a normal to low-amplitude overpressure system.
GOR is 223-923 m3/m3 in FI16, 417-3524 m3/m3 in FI17, 420-1789 m3/m3 in FI19, and 2876-7652 m3/m3 in FI20 (Table 2 ). GOR shows an increasing trend from north to south and from west to east [15,49] (Fig. 3 ). However, the GOR in Well FD1 in a low-order fault zone is high (16 685 m3/m3), even an order of magnitude higher than that in FI20 strike-slip fault. Its genetic mechanism still needs to be further understood.
Table 2. GOR in and around well FD 1 in the Fuman Oilfield |
| Fault Zone | Well | Layer | GOR (m3/m3) |
|---|---|---|---|
| Low-order fault zone between FI19 and FI20 | FD1 | O1—2y | 16 685 |
| FI16 | FY3-H2 | O1—2y | 923 |
| FI16 | FY304H | O1—2y | 223 |
| FI17 | HD32-H1 | O1—2y | 417 |
| FI17 | MS504H | O1—2y | 485 |
| FI17 | MS2 | O1—2y | 550 |
| FI17 | MS5-H2 | O2yj | 522 |
| FI19 | MS7 | O1—2y | 420 |
| FI19 | MS701 | O1—2y | 622 |
| FI19 | MS702 | O1—2y | 633 |
| FI19 | MS71 | O1—2y | 1789 |
| FI20 | MS8 | O1—2y | 2760 |
3. Analysis of hydrocarbons genesis
3.1. Genesis of crude oil
The content of saturated hydrocarbon in the crude oil in well FD1 is as high as 80.6%, but only 2.4% aromatic hydrocarbon, 0.8% resin, and 0.53% asphaltene. The ratio of saturated to aromatic hydrocarbons is 33.58. The aromatic hydrocarbon is primarily composed of naphthalene compounds, and the naphthalene-to-phenanthrene ratio is approximately 6. The ratio of pristane to phytane (Pr/Ph) is 1.00; Ph/nC18 = 0.13; Pr/nC17 = 0.12; C27, C28, and C29 steranes are 35.25%, 27.05%, and 37.70%, respectively; C24Tet/C26TT = 0.92; and Re/P (retene/phenanthrene) = 0.016. In addition, a little gammacerane was detected (Fig. 5 ). These characteristics suggest that the crude oil was mainly generated from algae-bearing organic matter, which formed in a more reducing environment with saltwater-brackish water.
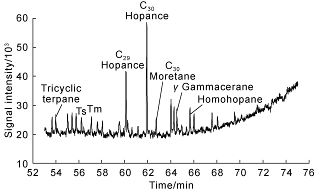
Fig. 5. Crude oil mass chromatogram in Well FD1 (m/z=191). |
The equivalent vitrinite reflectance (Rc) value of the crude oil in well FD1 is 0.77%, calculated using the methylphenanthrene index (MPI) formula (Rc = 0.88 × MPI + 0.2). The Rc value suggests that the crude oil is mature, and it was generated near the hydrocarbon generation peak.
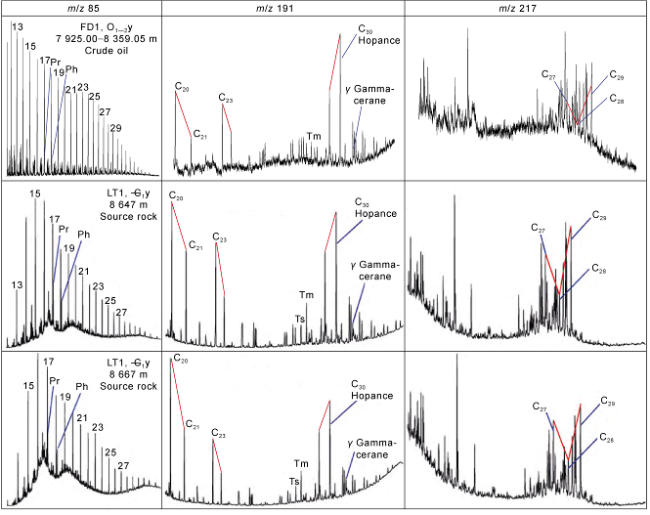
Fig. 6. Comparison of biomarkers of crude oil from well FD1 with the source rock of Yuertusi Formation in well LT1 (adapted from Reference [21]). |
3.2. Origin of natural gas
The natural gas from well FD1 contains 95.45 mol% CH4, 2.59 mol% C2H6, 0.70 mol% C3H8, 0.30 mol% iC4H10, 0.45 mol% nC4H10, 0.19 mol% iC5H12, and 0.17 mol% nC5H12. The drying coefficient is 0.97, indicating dry gas. The δ13C values are as follows: δ13C1 ranges from -48.10‰ to -47.57‰, δ13C2 from -27.90‰ to -27.77‰, δ13C3 from -26.30‰ to -26.23‰, δ13CiC4 from -28.40‰ to -28.35‰, and δ13CnC5 from -26.30 ‰ to -26.25‰ (Table 3 ).
Table 3. Analysis results of natural gas compositions and stable carbon isotopic compositions in the Fuman Oilfield |
| Fault zones | Well | Layer | Depth/ m | Dry coefficient | Mole fraction/mol% | δ13C/‰ | Ro1/ % | Ro2/ % | Data sources | ||||||||||
|---|---|---|---|---|---|---|---|---|---|---|---|---|---|---|---|---|---|---|---|
| CH4 | C2H4 | C3H8 | iC4H10 | nC4H10 | iC5H12 | nC5H12 | CH4 | C2H4 | C3H8 | iC4H10 | nC4H10 | ||||||||
| Secondary faults between FI19 and FI20 | FD1 | O1-2y2 | 7925.00- 8359.05 | −48.10 | −27.90 | −26.30 | −28.40 | −26.30 | 0.61 | 0.77 | PetroChina Research Institute of Petroleum Exploration & Development | ||||||||
| 0.970 | 95.45 | 2.59 | 0.70 | 0.30 | 0.45 | 0.19 | 0.17 | −47.57 | −27.77 | −26.23 | −28.35 | −26.25 | 0.65 | 0.81 | China University of Geosciences (Wuhan) | ||||
| FII17 | FY105X | O2yj | 7369.00- 7435.00 | 0.754 | 70.67 | 9.48 | 6.38 | 1.50 | 2.88 | 0.87 | 0.99 | Tarim Oilfield Company | |||||||
| FI15 | FY303- H2 | O2yj | 7235.50- 7429.60 | 0.611 | 56.73 | 14.50 | 11.51 | 2.38 | 4.73 | 1.08 | 1.19 | ||||||||
| FI5 | GL1 | O1-2y2 | 7530.00- 7750.00 | 80.96 | 9.97 | 4.58 | 0.74 | 1.26 | 0.24 | 0.20 | |||||||||
| FI5 | GL2 | O2yj+O1-2y | 7342.00- 7628.04 | 85.51 | 4.19 | 0.88 | 0.44 | 0.54 | 0.26 | 0.21 | |||||||||
| FI5 | GL3 | O2yj+O1-2y | 7684.11- 8505.98 | −49.99 | −32.46 | −31.06 | −31.49 | −29.99 | 0.50 | 0.63 | |||||||||
| FI5 | GL3-H12 | O2yj | 7652.00- 7986.26 | 0.002 | 0.16 | 29.40 | 23.97 | 6.25 | 11.75 | 3.26 | 3.46 | ||||||||
| FI10 | GL3-H6 | O2yj | 7635.00- 7807.13 | 0.727 | 66.44 | 10.82 | 6.36 | 1.47 | 2.95 | 0.95 | 1.14 | ||||||||
| FI17 | HD32-H9 | O2yj | 7256.00- 7634.00 | 0.774 | 72.23 | 10.50 | 5.76 | 1.05 | 2.15 | 0.52 | 0.64 | ||||||||
| FI17 | MS1 | O2yj | 7509.50- 7665.62 | 0.895 | 82.16 | 5.59 | 2.27 | 0.47 | 0.71 | 0.20 | 0.19 | ||||||||
| FI17 | MS1-H1 | O2yj | 7484.00- 7716.00 | 0.706 | 58.95 | 8.29 | 6.50 | 2.03 | 3.72 | 1.32 | 1.37 | ||||||||
| FI17 | MS1-H2 | O2yj | 7480.00- 8128.00 | 0.776 | 67.48 | 7.40 | 5.10 | 1.52 | 2.71 | 0.94 | 0.97 | ||||||||
| FI17 | MS2 | O1-2y2 | 8057.96- 8470.00 | 0.779 | 72.24 | 7.67 | 5.22 | 1.58 | 2.83 | 1.02 | 1.07 | ||||||||
| FI17 | MS301H | O1-2y | 7532.00- 8639.60 | −46.15 | −34.09 | −32.39 | −32.32 | −31.38 | 0.75 | 0.94 | |||||||||
| FI17 | MS301H | O1-2y | 7532.00- 8639.60 | −46.05 | −33.96 | −32.18 | −31.74 | −31.06 | 0.76 | 0.95 | |||||||||
| FI17 | MS4 | O2yj | 7573.00- 8202.00 | −43.54 | −32.49 | −30.80 | −30.55 | −29.35 | 0.99 | 1.24 | |||||||||
| FI17 | MS4 | O2yj | 7573.00- 8202.00 | −43.86 | −32.28 | −29.99 | −29.68 | −28.63 | 0.96 | 1.20 | |||||||||
| FI17 | MS4 | O2yj | 7573.00- 8208.00 | 0.752 | 71.85 | 6.95 | 5.06 | 1.85 | 3.28 | 1.43 | 1.48 | ||||||||
| FI17 | MS401H | O2yj | 7499.50- 8240.00 | 0.824 | 76.30 | 6.24 | 3.96 | 1.28 | 2.13 | 0.85 | 0.82 | ||||||||
| FI17 | MS501H | O2yj | 7613.00- 8033.00 | 0.765 | 67.99 | 8.18 | 5.63 | 1.47 | 2.92 | 0.88 | 0.97 | ||||||||
| FI17 | MS502H | O1-2y1 | 7370.50- 7820.00 | 0.685 | 63.73 | 9.53 | 8.53 | 2.56 | 4.71 | 1.44 | 1.45 | ||||||||
| FI17 | MS503H | O2yj | 7596.00- 8305.00 | 0.708 | 61.95 | 8.05 | 7.03 | 2.34 | 4.25 | 1.41 | 1.36 | ||||||||
| FI17 | MS5-H4 | O2yj | 7652.00- 8116.00 | 0.698 | 60.63 | 8.47 | 7.16 | 2.27 | 4.34 | 1.43 | 1.50 | ||||||||
| FI6 | YM10 | O2yj | 7198.09- 7237.55 | 0.718 | 67.59 | 9.43 | 7.35 | 2.06 | 3.84 | 1.26 | 1.33 | ||||||||
| FII9 | YM1-8 | O2yj | 7276.05- 7342.00 | 0.800 | 75.72 | 6.67 | 4.89 | 1.54 | 2.70 | 0.99 | 1.03 | ||||||||
| FI6 | YM211H | O2yj | 7463.00- 7690.00 | 0.362 | 30.88 | 19.39 | 18.99 | 4.27 | 7.43 | 1.68 | 1.63 | ||||||||
| FI6 | YM211- H2 | O2yj | 7491.00- 8030.00 | 0.001 | 0.12 | 25.65 | 23.81 | 6.17 | 12.10 | 3.57 | 3.79 | ||||||||
| FI6 | YM21-2X | O2yj | 7521.96- 7885.00 | 0.640 | 56.31 | 11.48 | 8.78 | 2.32 | 4.67 | 1.43 | 1.59 | ||||||||
| FI6 | YM21-4X | O2yj | 7561.50- 7765.10 | 0.709 | 60.10 | 10.26 | 6.26 | 1.55 | 3.12 | 1.02 | 1.19 | ||||||||
| FI6 | YM21-5X | O2yj | 7510.00- 7935.00 | 0.785 | 68.71 | 9.79 | 4.42 | 0.88 | 1.68 | 0.55 | 0.64 | ||||||||
| FI7 | YM 2-3X | O2yj | 7251.22- 7331.00 | 0.718 | 66.43 | 9.02 | 6.85 | 2.04 | 3.80 | 1.35 | 1.54 | ||||||||
| FI7 | YM 2-4X | O2yj | 7317.68- 7395.00 | 0.615 | 57.82 | 11.84 | 10.45 | 3.06 | 5.53 | 1.80 | 1.95 | ||||||||
| FI7 | YM6C1 | O2yj | 7420.00- 7480.00 | 0.705 | 63.10 | 9.13 | 7.31 | 2.14 | 3.99 | 1.31 | 1.36 | ||||||||
| FI10 | YM801- H6 | O2yj | 7278.00- 7440.00 | 0.844 | 78.08 | 6.68 | 3.59 | 0.90 | 1.58 | 0.53 | 0.56 | ||||||||
Compared with the natural gas in the strike-slip fault zones in the Shunbei and Fuman areas, the natural gas from well FD1 exhibits abnormally heavy C2-C4 carbon isotopic compositions, and similar C1 carbon isotope composition (Fig. 7 ), but no H2S. This suggests that the origin of the natural gas in well FD1 is different from that in the major strike-slip fault zone in the Shunbei and Fuman areas, and it has not been altered by thermochemical sulfate reduction (TSR). Although the C2-C4 carbon isotope compositions are similar to those of dry gas directly generated from type III kerogen and crude oil cracking at higher temperature, the C1 methane carbon isotope is lighter. The reason may be attributed to the mixing of the (allochthonous) crude oil cracking gas from ultra-deep reservoirs after evaporation fractionation, with a small amount of (in-situ) Ordovician crude oil cracking gas, which results in such dry gas with a high GOR [51].
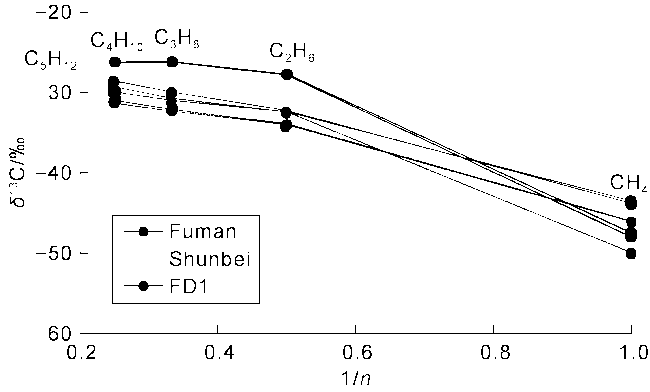
Fig. 7. Relationship between the reciprocal of carbon number (1/n) of natural gas and its stable carbon isotope composition. |
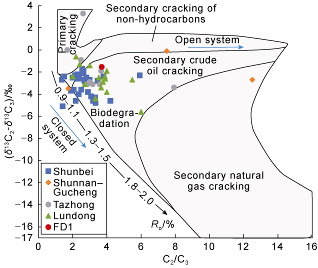
Based on the relationship between C2/C3 ratio and (δ13C2-δ13C3 values) (Fig. 8 ), there are associated gas from kerogen cracking and secondary cracking gas from crude oil and natural gas in the Tazhong area. In the Gucheng zone and Shunnan areas, natural gas is primarily originated from secondary cracking gas, with a small proportion of crude oil cracking gas, suggesting an open system. In the Shunbei area, the natural gas primarily consists of secondary cracking gas from crude oil, and a minor amount of kerogen cracking gas. The maturity ranges from 0.5% to 1.1% [54], indicating of a close system. The natural gas from well FD1 is a semi-open system with secondary cracking gas from crude oil. The equivalent maturity value (Ro is 0.77% to 0.81%, Table 3 ) is similar to its crude oil maturity (Ro is 0.77%) and does not exhibit the characteristics of “heavy oil and dry gas” [20].
The relationship between the ln(C1/C2) and ln(C2/C3) ratios of natural gas in Fig. 9 further confirms that the primary source of natural gas in the well FD1 is from crude oil cracking. Moreover, it reveals that the maturity (Ro) of this gas ranges from 1.5% to 2.0%, surpassing the maturity estimated only based on C1. It demonstrates that the natural gas in the well FD1 not only has the characteristics of “mixed sources” but also exhibits higher maturity indicated by the carbon isotopes of C2 and C3. Therefore, utilizing a single component or one method to characterize the maturity of such mixed-genesis natural gas is insufficient and often leads to conflicting results.
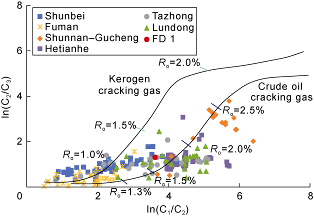
Fig. 9. Relationship between ln(C1/C2) and ln(C2/C3). |
According to the results of previous studies, the current formation temperature in the Ordovician fault-controlled oil and gas reservoirs in the west of the FI10 fault zone is 160-180 °C, and the crude oil has not cracked [29,54,57-58]. In the south of the FI10-FI20 strike-slip faults, the fault-controlled oil and gas reservoirs in the major Ordovician faults aroumd the Manjiaer area encounter increasing trends of gas injection and GOR [49], which is caused by gas injection from crude oil cracking in ultra-deep formations, rather than the high reservoir temperature.
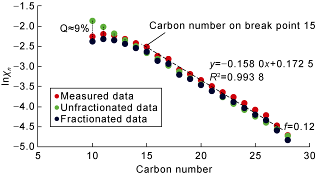
The relationship between lnχn and carbon number n of n-alkanes shows 9% loss of n-alkanes (Q) (Fig. 10 ). We consider that considerable crude oil cracking gas from deeper reservoirs migrated upwardly and accumulated in the overlying Ordovician reservoirs. At high temperature, a little early crude oil cracked and resulted in gas injection (similar to the Shunbei FI10 strike-slip fault) [59]. This phenomenon ultimately contributes to distinct gas condensate accumulation known as “secondary condensate gas reservoir” [18-19].
Fig. 10. Relationship between the carbon number (n) and lnχn of n-alkanes of crude oil from well FD1 (f is the theoretical difference of the molar mass logarithm between measured mass of n-alkane and fractionated mass; χn is the molar content of n-alkanes with carbon number n; Q is the loss of n-alkanes). |
4. Conclusions
The fault-controlled intraplatform shoal facies of the Yingshan Formation in the major strike-slip fault zone in the Fuman Oilfield has good conditions for hydrocarbon accumulation under deeply buried karstification. The mudstone of the Sangtamu Formation is an indirect caprock, and the tight limestone of the Yijianfang Formation and the first section of the upper member of the Yingshan Formation is a direct caprock. Hydrocarbon generated from the Lower Cambrian Yuertusi Formation source rock vertically migrated through the neighboring major strike-slip faults into the second section of the upper member of the Yingshan Formation and accumulated laterally. This is a new reservoir model called “intraplatform shoal and lower-order faults-controlled reservoir” like that in well FD1.
The genetic analysis of oil and gas in well FD1, which is located at the low-order faults between major strike-slip faults FI19 and FI20, indicates a small amount of oil comes from the mature Lower Cambrian Yuertusi Formation source rock, and a large amount of gas is ultra-deep oil cracking gas. They contribute to the condensate gas in well FD1, characterized by dry gas and hybrid secondary condensate gas with high GOR.
This new reservoir model provides a possibility to expand the exploration scope and build a continuous oil and gas development field in the major strike-slip fault zones in the Fuman Oilfield.
Acknowledgments
Thanks to Han Jianfa, Zhang Yintao, Zhang Yanqiu from Tarim Oilfield Company, and Prof. Chen Honghan and Prof. Ping Hongwei of China University of Geosciences (Wuhan) for their supports.