

Introduction
Organic matter (OM) plays an important role in the sedimentation, diagenesis, and reservoir-forming process of shales. As a kind of secondary OM, solid bitumen (SB) was imprinted by various geologic processes from OM sedimentation to hydrocarbon generation. Its optical properties, textures, and states of occurrence contain a lot of geologic information related to OM texture variation, evolution path, and OM-hosted pores, which is crucial for the study of the genetic and evolutionary mechanisms of primary and secondary pores in shale reservoirs [1⇓-3]. In addition, extensive low-permeability shales in the sedimentary basins are supposed to be the potential sites for long-term storage of CO2, green hydrogen, and nuclear wastes [4-5]. Thus, it is also significant to assess SB influence on shale reservoir space and the sealing performance and leakage risks of low-permeability reservoirs.
SB definition varies with the purpose and focus of different field. In the field of organic geochemistry, SB is defined as a secondary organic product, which is further classified as soluble OM in organic solvents (bitumen) and non-extractable OM (pyrobitumen)[6]. In the field of organic petrography, which focuses more on SB distribution in rocks and its organic-hosted pores [7-8], SB is defined as a type of secondary maceral which differs from primary macerals and can be observed under the optical microscope. The OM composition in oil-prone kerogen mainly includes alginite and bituminite, and is usually lack of vitrinite originated from higher plants; hence, the equivalent vitrinite reflectance (Roeq) converted from SB reflectance (Rob) can be used for maturity characterization. However, the optical properties of SB vary with thermal maturity owing to the evolution of primary OM and thus the equivalent formula of reflectance varies in different areas [9⇓⇓-12]. In spite of increasing interests on SB in the study of shale reservoirs, there is some confusion in SB definition, classification, and utilization of the term. More efforts should focus on the differentiation between SB and primary macerals using optical microscope and scanning electron microscope (SEM), influencing factors of Rob as a thermal maturity index, and differences in SB evolution path and their effects on the development of reservoir space.
Based on the review of SB definition and classification criteria, and with the shales in the first member of the Cretaceous Qingshankou Formation (Qing 1 Member) in the Songliao Basin as an example, the SB features are observed using optical microscope and SEM. Then, SB and primary macerals are compared for optical properties and occurrence states to clarify the causes for the differences in SB evolution paths. After sorting out the conversion relation between SB reflectance (Rob) and vitrinite reflectance (Ro) in different basins, the applications and problems of different equivalent formulas are summarized, and the impact of SB evolution on the reservoir space is identified. Finally, the future research focuses are proposed.
1. Samples and methods
The Qing 1 Member in the Songliao Basin is dominated by thick black shale, with grey argillaceous siltstone and silty mudstone (Fig. 1 ), as a result of extensive water transgression during its deposition. This typical set of oil-prone, organic-rich lacustrine shales exhibit a wide range of maturity (Ro of 0.5%-1.7%) [13⇓-15], with kerogen of mainly types I and II. The thermal evolution of the Qing 1 Member shales is divided into: low-maturity stage (0.5%< Ro≤0.7%), early oil generation stage (0.7%<Ro<1.0%), peak oil generation stage (Ro=1.0%), late oil generation stage (1.0%<Ro≤1.4%), and high-maturity stage (1.4%<Ro≤2.0%). The early oil generation stage, peak oil generation stage, and late oil generation stage are collectively referred to as the oil window. After the peak oil generation stage, primary hydrogen-rich OM (sapropelinite) was completely converted into SB, and some terrestrial OM (vitrinite and inertinite) existed in each stage [16]. According to the criteria for lithofacies classification by OM abundance, mineral composition and sedimentary structure for the Qing 1 Member shales [17-18], organic-rich shale samples with TOC>2%, high content of clay minerals, and developed lamellation at different thermal maturity levels were selected for the study of organic petrology, SEM analysis and the measurement of Ro and Rob.
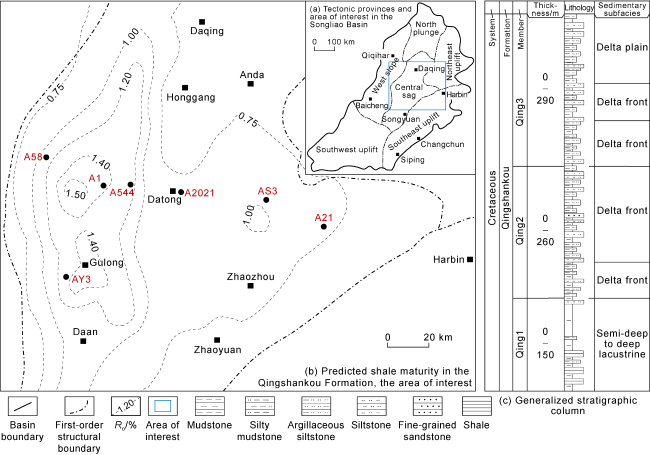
Fig. 1. (a) Location of the study area; (b) predicted maturity distribution of Qingshankou shales; and (c) stratigraphic column of Qingshankou Formation. |
A Leica DM-RXP+Q550IW optical microscope, with 20× and 50× objective, was used for observing the reflected light color, intensity and texture of the primary maceral and SB under reflected white light and fluorescence. Primary maceral classification and nomenclature conformed to the stipulations issued by International Committee of Coal Petrology (ICCP) [19⇓-21]. For the same sample, Ro and Rob were measured by no less than 20 times, and the average reflectance was calculated, subject to the Determination of Vitrinite Reflectance in Sedimentary Rocks (SY/T 5124-2012) [22]. The point method was employed for the quantitative analysis of macerals, with no less than 800 effective points counted for each sample, subject to the Maceral Identification and Statistical Methods on Polished Surfaces of Whole Rocks (SY/T 6414-2014) [23]. A Zeiss Evo Ma 15 SEM (equipped with secondary and backscattered electron detectors and EDAX atomic X-ray energy spectrometer), with accelerating voltage of 10-20 keV, current of 20 nA, and operating distance of 8-11 mm, was used for secondary electronic imaging of shale samples after argon ion polishing.
2. Classification and features of solid bitumen
2.1. Classification of solid bitumen
The SB classification has been performed from different perspectives such as physical properties, genesis, occurrence state, and migration distance (Table 1 ). In terms of solubility, fusibility, and C/H atomic ratio, Abraham classified SB as ozocerite, asphalt, gilsonite/grahamite, ingramite albertite, and impsonite [24⇓-26]. This provides the first detailed classification of SB by physical properties, but neglects the SB genesis. Based on Abraham's work, Jacob considered the influence of OM maturity and classified bitumen into two categories with Ro=0.7% as boundary: solid bitumen, which refers to the bitumen with Ro˂0.7% and soluble in organic solvents, and pyrobitumen, which refers to the bitumen with Ro˃0.7% and insoluble in organic solvents [10,27]. However, in the high-maturity stage, liquid hydrocarbons and their secondary products would further crack to form pyrobitumen and gas [30]. Therefore, the boundary of Ro=0.7% is obviously too low. Misch et al. classified SB into in-situ SB and migrated SB based on whether migration occurs [2]. Curiale classified SB into two categories: pre-oil bitumen and post-oil bitumen, by bitumen elements and biomarkers. The pre-oil bitumen refers to the intermediate product of kerogen transforming into liquid hydrocarbons, which formed in situ or travelled a very short distance without large-scale migration owing to its large viscosity, and it usually exists before the peak oil generation stage. The post-oil bitumen is the product of liquid oil alteration and generally occurs in the peak oil generation and late oil generation stages; it has significant migration characteristics, thereby replacing the original OM network [28]. Cardott et al. called the network formed by residual solid carbon compounds in shale pores after primary oil migration as post-oil bitumen network [3]. In Sanei's opinion, Curiale's definition of pre-oil bitumen is unclear, under which SB generated by primary kerogen cracking from immature to early oil generation is collectively called pre-oil bitumen, and SB occurring after oil generation is called post-oil bitumen, cannot represent the occurrence states and forming time of SB in different stages of thermal evolution [29]. Hence, Sanei presents a schematic model for the evolution of OM and its secondary products (bitumen, solid bitumen) in different stages of OM maturation. He subdivided the pre-oil bitumen into diagenetic SB at the immaturity stage and initial-oil SB at the low-maturity stage, and the post-oil SB into primary-oil SB at the early oil generation stage, late-oil SB at the late oil generation stage, and pyrobitumen at the high-maturity stage. The diagenetic SB mainly originated from bituminite biodegradation and low-temperature alteration. The initial-oil SB is the heavy and highly viscous bitumen exuded from the initial cracking of oil-prone macerals. The primary-oil SB is the product of continued cracking of oil-prone macerals and solidification of low-maturity oil, during which the precipitation of heavy asphalt compounds usually occurs. The late-oil SB involves solidified wax and ozocerites separated from mature hydrogen-rich ozocerite-rich heavy oil. Pyrobitumen is the product of secondary cracking of residual hydrocarbon and SB. These SB types show different features under the optical microscope (Table 1 ).
Table 1. Classification of solid bitumen |
| Source | SB type | SB property | Classification criterion |
|---|---|---|---|
| Abraham [24⇓-26] | Ozocerite | Soluble in CS2 | Decreased fusibility: ozocerite, asphalt, gilsonite, and grahamite |
| Asphalt | |||
| Gilsonite | |||
| Grahamite | |||
| Ingramite albertite | Insoluble in CS2 | H/C atomic ratio greater than 1 | |
| Impsonite | H/C atomic ratio less than 1 | ||
| Jacob [10,27] | Solid bitumen | Soluble in CS2 | Ro≤0.7% |
| Pyrobitumen | Insoluble in CS2 | Ro>0.7% | |
| Curiale [28] | Pre-oil bitumen | In situ or short-distance migration | Ro<1.0% |
| Post-oil bitumen | Long-distance migration | Ro>1.0% | |
| Sanei [29] | Diagenetic SB | Dark gray under reflected light; weak or no fluorescence | Ro<0.5% |
| Initial-oil SB | Brown under reflected light; yellow fluorescence | 0.5%<Ro<0.7% | |
| Primary-oil SB | Gray under reflected light (filled fractures); no fluorescence | 0.7%<Ro<1.0% | |
| Late-oil SB | Gray under reflected light (in tighter pore network); no fluorescence | 1.0%<Ro<1.4% | |
| Pyrobitumen | Enhanced reflection under reflected light; no fluorescence | Ro>1.4% | |
| Misch et al. [2] | In-situ SB | No migration | |
| Migrated SB | Migration | ||
In summary, SB is mainly classified by: (1) the properties of SB in the thermal evolution stage, and (2) whether SB migrates. In fact, there is a corresponding relationship between these two principles. The diagenetic SB and initial-oil SB, subdivisions of pre-oil bitumen, correspond to the in-situ SB, while the primary-oil SB and late-oil SB, subdivisions of post-oil bitumen, and pyrobitumen mainly correspond to the migrated SB. A combination of optical microscopy and SEM was used to observe SB (as defined in organic petrology) in organic-rich shale samples at different maturity stages of the Qing 1 Member in the Songliao Basin. Then, coupling with the geochemical properties in the thermal evolution stages, SB are divided by peak oil generation into three types: (1) pre-oil bitumen, i.e. the solid bitumen in the low-maturity to early oil generation stage, which mostly corresponds to the in-situ SB and rarely to migrated SB; (2) post-oil bitumen, i.e. the solid bitumen in the peak oil generation to late oil generation stage; and (3) pyrobitumen, i.e. the solid bitumen in the high-maturity stage. The latter two types are mostly migrated SB.
2.2. Optical properties of solid bitumen
Optical features of SB vary with OM maturity in shales. SB can be identified and distinguished from other macerals based on optical properties and occurrence state (Table 2 ).
Table 2. Petrologic features of SB and primary macerals of the Qing 1 Member shales in Songliao Basin |
| Evolution stage | SB | Bituminite | Alginite | Inertinite | Vitrinite | ||
|---|---|---|---|---|---|---|---|
| Pre-oil bitumen | Post-oil bitumen | Pyrobitumen | |||||
| Low-maturity to early oil generation stage | Reddish brown or black fluorescence, black to dark gray under reflected light, homogeneous, filling pores/ fractures occasionally | Light green to yellow fluorescence, dark gray and brown to black under reflected light, parallel to bedding planes, and mixing with mineral matrix | Yellow to dark yellow to yellowish orange fluorescence, brown under reflected light, lamellar aggregation or strip-like geometry, and parallel to bedding planes | No fluorescence, bright white under reflected light, angular or subangular, and cell structures | No fluorescence, gray under reflected light, the reflectance is between bituminite and inertinite, in the form of scattered particles | ||
| Early oil generation to peak oil generation stage | No fluorescence, dark gray to gray under reflected light, filling pores/ fractures, wrapping authigenic minerals | ||||||
| Peak oil generation to late oil generation stage | |||||||
| High-maturity stage | No fluorescence, light gray to bright white under reflected light, filling pores/ fractures, wrapping authigenic minerals | ||||||
Oil-prone macerals began to transform into SB at the low-maturity stage in the Qing 1 Member, the Songliao Basin, and SB turned up in the form of pre-oil bitumen until the early oil generation stage. Pre-oil bitumen mostly has the precursor morphology of primitive kerogen. Due to high viscosity and limited migration ability [31], pre-oil bitumen migrated rarely or only by a short distance into adjacent pores or plant cell pores. Such bitumen is commonly marked with filling pores/fractures or wrapping authigenic minerals [32]. Pre-oil bitumen formed by the evolution of lamalginite is observed under reflected light, and it is black under fluorescence (Fig. 2a , 2b ). As a product of liquid oil alteration, post-oil bitumen exhibits gray to dark gray colors under reflected light, and no fluorescent shows. It was formed mainly in the peak oil generation to late oil generation stage, and migrated obviously. Moreover, it fills the pores and mineral matrix, forming a connected, speckle OM network (Fig. 2c ). The SB mainly appeared in the form of pyrobitumen at the high-maturity stage and shows light gray to bright white colors under reflected light (Fig. 2d ).
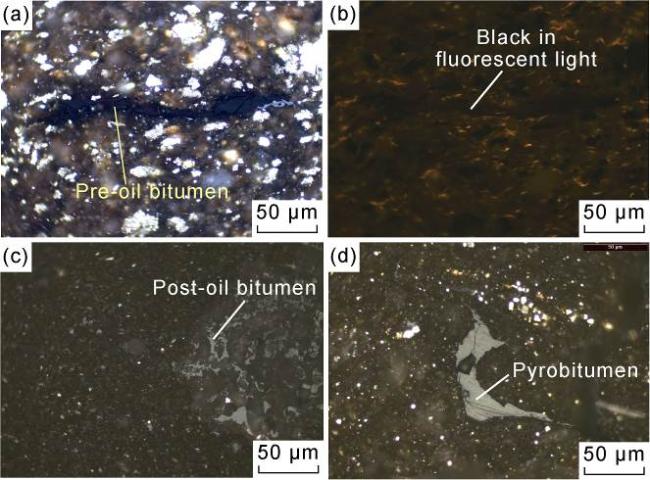
Fig. 2. Microscopic characteristics of pre-oil bitumen, post-oil bitumen and pyrobitumen in the Qing 1 Member shales in Songliao Basin. (a) Well A21, 1625.90 m, Ro of 0.72%, in reflected light after oil immersion, pre-oil bitumen transforming from alginate, with the morphology of alginite; (b) Well A21, 1625.90 m, Ro of 0.72%, in fluorescent after oil immersion, pre-oil bitumen in black; (c) Well A544, 2278.50 m, Ro of 1.26%, in reflected light after oil immersion, post- oil bitumen network in the late oil generation stage; (d) Well A1, 2512.91 m, Ro of 1.56%, in reflected light after oil immersion, pyrobitumen in the high-maturity stage. |
Some primary macerals (e.g. bituminite and alginite) at the low maturity to early oil generation stage may also show similar microscopic features to pre-oil bitumen, i.e. wrapping authigenic minerals. These phenomena may occur in the same field of view and therefore need to be distinguished by other organic petrologic features (Table 2 ). Specifically, bituminite usually has granular and irregular strip structures, and shows high-intensity fluorescence, and low contrast with the mineral matrix under reflected light, generally appearing in dark brown or black. pre-oil bitumen shows dark brown or no color under fluorescence, and a strong contrast with inorganic minerals under reflected light, generally appearing in gray to dark gray, with pyrite occasionally (Fig. 3a , 3b ). The optical features of bituminite and pre-oil bitumen are tied to the degree of oxidation. Bituminite, with low degree of oxidation and high carbon content, displays low reflectance and high fluorescence intensity. In contrast, pre-oil bitumen, with high degree of oxidation and moderate hydrogen content, shows high reflectance and low fluorescence intensity [19,32]. The surface of pre-oil bitumen is more homogeneous than that of bituminite. Therefore, it is also possible to distinguish pre-oil bitumen from bituminite effectively by reflectance. Hackley et al. measured Rob of pre-oil bitumen samples acquired from 14 regions, indicating that 65% of the samples had Rob˃0.30%, with an average of 0.31% [32]. Hence, 0.30% was taken as the threshold to differentiate bituminite and SB at the immaturity to early oil generation stage. Wei et al. measured the Rob value of the pre-oil bitumen filling the pores and fractures to be 0.44%-0.52% [33]. The measurements on the Qing 1 Member shales also show an average Rob of pre-oil bitumen much higher than 0.3%, which further demonstrates that it is credible to use Rob of 0.3% as the threshold of differentiation. Alginite before the peak oil generation stage shows brown or dark brown under reflected light and yellow to yellowish orange under fluorescence, allowing it to be distinguished accurately from SB (Fig. 3c , 3d ). Vitrinite and inertinite existed throughout the evolutionary process. They are different greatly from SB under the optical microscope. Vitrinite exists in the mineral matrix as dispersed particles and is dark gray to bright white under reflected light (Fig. 3e ), with a reflectance ranging between those of inertinite and liptinite. Inertinite exists as angular or subangular isolated particles, and appears in bright white under reflected light, often with a plant cell structure and well-defined boundaries with the surrounding mineral matrix (Fig. 3f ). In addition, the inertinite reflectance is usually higher than Rob.
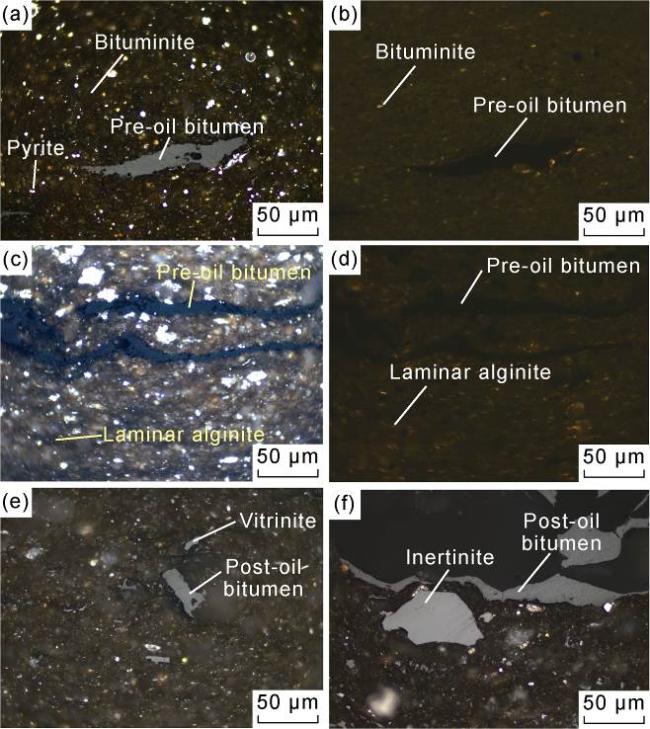
Fig. 3. Primary maceral and solid bitumen in the Qing 1 Member shales in Songliao Basin (micrographs). (a) Well A2021, 1524.20 m, Ro of 0.63%, in reflected light after oil immersion, dark brown bituminite in contrast with gray pre-oil bitumen with surrounding associated pyrites; (b) Well A2021, 1524.20 m, Ro of 0.63%, in fluorescence after oil immersion, bituminite in light green, pre-oil bitumen with no fluorescence; (c) Well AS3, 1996.90 m, Ro of 0.80%, in reflected light after oil immersion, brown alginite in contrast with dark gray pre-oil bitumen; (d) Well AS3, 1996.90 m, Ro of 0.80%, in fluorescence after oil immersion, alginite in orange, pre-oil bitumen with no fluorescence; (e) Well A58, 2112.90 m, Ro of 1.16%, in reflected light after oil immersion, dark gray to bright white vitrinite in contrast with gray post-oil bitumen; (f) Well A544, 2234.50 m, Ro of 1.21%, in reflected light after oil immersion, bright white inertinite in contrast with gray post-oil bitumen. |
2.3. SEM features of solid bitumen
Owing to low relative atomic mass of carbon and OM universally in black under SEM, SB and primary maceral cannot be distinguished easily under SEM, especially in-suit pre-oil bitumen with the precursor morphology of primary kerogen, which can hardly be discriminated from other types of OM through SEM. In this regard, optical and electron microscopies should be combined for in situ analysis to find OM under the optical microscope in the same field of view of the SEM to identify maceral type [34]. Limited by the resolution of the optical microscope, it is still a ticklish problem to identify OM smaller than 10 μm. For the migrated SB, it can be effectively distinguished from the original OM under SEM, after analyzing the thermal maturity, primary OM composition, and organic petrologic features of SB of shales in the study area. Liu et al. quantified the maceral components at different evolutionary stages in the Devonian-Mississippian New Albany shales in the United States [35], indicating that the content of pre-oil bitumen is merely 3.35% and the content of oil-prone macerals (bituminite and alginite) is 83.83% at the early oil generation stage, the content of post-oil bitumen and pyrobitumen (migrated OM) reaches 97.17% after the peak oil generation stage, while the content of terrestrial OM (vitrinite and inertinite) is only 2.83%. The oil-prone macerals were completely converted into SB at the peak oil generation stage, which means that the differences between migrated SB and terrestrial OM should be specifically considered after the peak oil generation stage. Camp classified OM under SEM into three categories: structured OM, amorphous OM, and void-filling OM (OM cement) [36]. The OM cement corresponds to the migrated SB, and refers to the OM filled in the primary pores, plant cell pores, microcracks, intercrystalline pores, etc. The shape of the filled OM is determined by the morphology of the pores. Loucks et al. summarized seven characteristics that distinguish sedimentary OM from migrated OM [37], which could also be used to identify primary macerals and SB under SEM. Seven signatures of migrated OM involve: (1) OM occurrence in mineral pores after cementation, (2) OM occurrence in primary fossil body- cavity voids, (3) dense OM-hosted spongy pores, (4) OM filled in continuous pore network with overlying spongy pore network, (5) no linear distribution of OM-hosted pores, (6) OM-hosted cracks related to devolatilization, and (7) abnormally large bubble pores between inorganic minerals due to the development of oil and gas two-phase inclusions. In addition, Misch et al. observed flow textures on migrated SB [2].
According to the SEM observations of macerals of the Qing 1 Member shale samples, primary macerals at the low maturity to early oil generation stage are classified: OM-mineral admixture, layered OM, and particulate OM, corresponding to bituminite, lamalginite, and terrestrial OM (vitrinite and inertinite), respectively. Bituminite generally mixes with mineral matrix, and has no distinct boundaries with surrounding minerals. Lamalginite is elongated and mostly parallel to the bedding. Terrestrial OM is generally bounded obviously with surrounding minerals, and its development is relatively dispersed, without specific shape and size [38]. In-situ SB at these stages exhibits the morphology of primary macerals and has pores related to hydrocarbon generation (Fig. 4a , 4b ). Migrated SB in the Qing 1 Member shales is observed with 6 petrologic features: flow textures generated by clay minerals and OM flowing in a same direction (Fig. 4c ); microcracks induced by OM devolatilization (Fig. 4d ); OM filling in pores and cracks in harbor-like contact with authigenic quartz (Fig. 4e ); OM migrating into mineral pores, and remaining at the pore margins to form a continuous OM network (Fig. 4f ); OM filling in intergranular pores after the cementation of authigenic chlorite and quartz (Fig. 4g ); and OM-hosted spongy pores (Fig. 4h ).
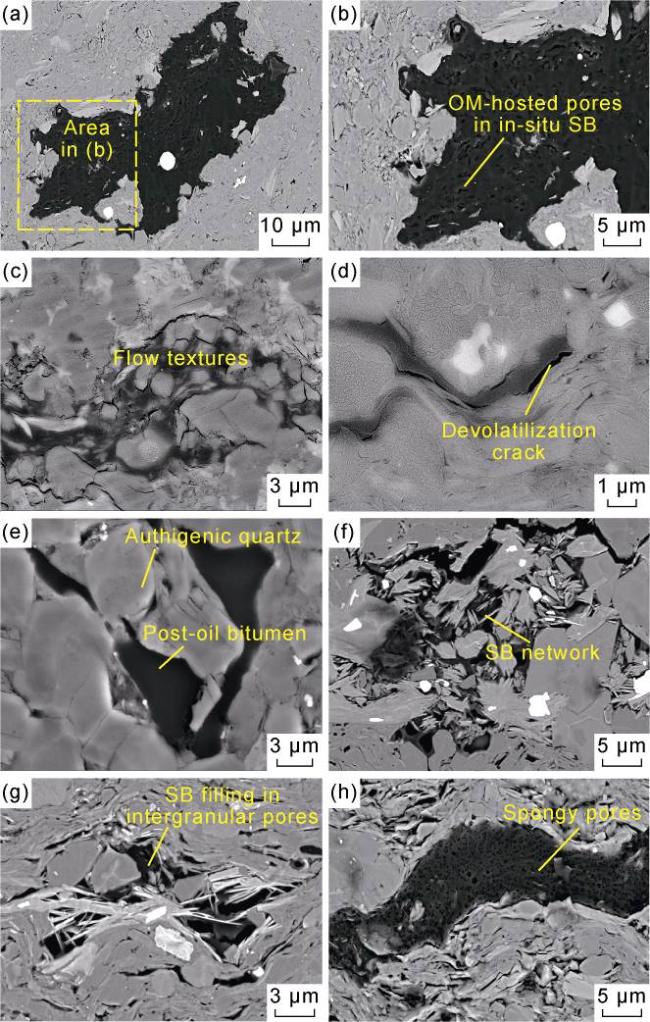
Fig. 4. SEM images of in-situ SB and migrated SB in the Qing 1 Member shales in Songliao Basin. (a) Well As3, 2049.50 m, Ro of 0.98%, OM-hosted pores in in-situ SB caused by devolatilization after hydrocarbon generation; (b) Enlarged view of the area in (a); (c) Well A58, 2052.40 m, Ro of 1.12%, flow textures; (d) Well A58, 2112.97 m, Ro of 1.16%, devolatilization crack; (e) Well A544, 2278.50 m, Ro of 1.26%, post-oil bitumen in harbor-like contact with authigenic quartz; (f) Well AY3, 2459.10 m, Ro of 1.4%, SB migrating into mineral pores and remaining at pore margins to form continuous OM network; (g) Well AY3, 2490.50 m, Ro of 1.43%, SB filling in mineral pores; (h) Well A1, 2547.70 m, Ro of 1.62%, spongy pores in pyrobitumen. |
3. Evolution of solid bitumen during thermal maturation
3.1. Solid bitumen evolution path
Oil-prone macerals were bituminized to form pre-oil bitumen, which generated oil and gas as the maturity increased and then transformed into post-oil bitumen. Pyrobitumen was transformed from post-oil bitumen at the high-maturity stage. SB became the predominant macerals in the peak oil generation stage, and it might form OM network and pores for hydrocarbon migration and accumulation [39-40]. Gas-prone macerals mainly consist of vitrinite and inertinite. The former with low potential of hydrocarbon generation might merely generate some light hydrocarbons at the high-maturity to over-maturity stage. The latter has little potential of hydrocarbon generation. This means that gas-prone macerals, with little change in the whole process of thermal evolution, were hardly transformed into SB [41]. However, shales from various basins are different in the Ro values at the peak oil generation stage corresponding to the period when the oil-prone macerals are extensively converted into solid bitumen.
Quantitative characterization of maceral components of organic-rich shales at different thermal evolution stages in the Qing 1 Member of the Songliao Basin shows that the average content of oil-prone macerals was 70.66% before the peak oil generation stage, and 12% at the peak oil generation stage, but vanished after the peak oil generation stage, corresponding to the average SB content of 15%, 77%, and 88.33%, respectively. The content of terrestrial OM did not vary greatly and hovered around 10% in the whole process of evolution (Fig. 5 ). This indicates that SB in the continental shales of the Qing 1 Member began to be produced in large quantities at the peak oil generation stage, corresponding to the Ro value of about 1.0%. In contrast, SB in the marine New Albany shale began to be produced in large quantities at Ro of 0.8% [8]. As indicated by thermal simulation experiments of the marine Barnett and Woodford shales, primary macerals in the Barnett shale began to transform into SB at the temperature of 300 °C (the stage of bitumen generation) and form bubble pores internally until 400 °C (the stage of late oil generation), with spongy pores observed at 367 °C (the stage of peak oil generation). In contrast, primary macerals in the Woodford shale began to transform into SB at 367 °C, accompanied with the formation of bubble pores, with spongy pores uncommon at the stages of late oil generation and oil to gas cracking [42].
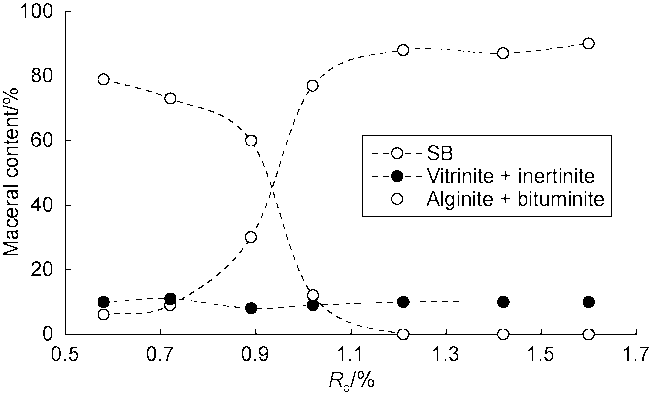
Fig. 5. Evolution of macerals with increasing thermal maturity of the Qing 1 Member shales in Songliao Basin. |
The differences above are attributed to the different types of primary maceral that are transformed into SB in the basins. The primary maceral of the New Albany and Barnett marine shales are mainly bituminite, followed by Tasmanites, which are typical marine Type-II kerogen. The Woodford marine shales are also rich in Tasmanites[8,35,42], which are algae-rich Type-II kerogen. The primary macerals of the Qing 1 Member continental shales are mainly lamalginite and liptodetrinite, followed by bituminite, which are typical continental Type-I kerogen. Both alginite and bituminite are oil-prone macerals, but the former shows higher hydrogen content and aliphatic structure, and consequently larger potential of hydrocarbon generation, than the latter. According to hydrocarbon generation kinetics, Type-I kerogen have narrower activation energy distribution and higher average activation energy than Type-II kerogen. Algae-rich Type-II kerogen are similar to Type-I kerogens [43]. Hence, Type-I and algae-rich Type-II kerogen have the characteristics of high threshold and short duration of hydrocarbon generation, and thus exhibit larger Ro corresponding to the transformation to SB.
The Ro value is also different when SB transforms to pyrobitumen and gas. Mastalerz et al. recommended that the maturity threshold of SB and pyrobitumen be set at 1.5%, in view of optical properties, chemical constitution, solubility, and genesis [1]. As per the comprehensive analysis of optical and scanning electron microscopies and Rob measurements, massive SB conversion into pyrobitumen and gas occurred at Rob of 1.5% in the Qingshankou shales. For sulfur-rich OM, the threshold is 1.3% [1].
3.2. Solid bitumen indication of maturity
Thermal maturity is an important parameter for the evaluation of source rocks and shale evolution, and Ro is usually used to characterize maturity. However, in the absence of higher plant input, such as Paleozoic marine source beds, Rob should be used instead of Ro to reflect the degree of thermal evolution [42]. Owing to the differences in OM origin, thermal history of the basin, and diagenetic evolution, Rob-Roeq equivalent equation may vary in different regions [44⇓-46].
For the Qing 1 Member continental shales in the Songliao Basin, it is found that Rob is smaller than Ro when Ro is less than 1.15%, (Table 3 and Fig. 6 ). This is very similar to the relation described by Jacob using the empirical equation of Rob and Ro for carbonate samples acquired from different regions [10]. According to the empirical equation, Rob is linearly related to Ro when the Rob value ranges from 0.1% to 3.0%, and Rob is smaller than Ro when the Ro value is less than 1.05%. The New Albany marine shale also exhibits a linear positive correlation between Rob and Ro [35]: Rob is smaller than Ro when the Ro value is less than 0.99%, and Rob is larger than Ro when the Ro value is above 0.99% (Fig. 8 ). It can be seen that the relationship between Ro and Rob usually reverses after the peak oil generation. It is because with the increase of maturity, the aliphatic structure of SB begins to decompose in large quantities, aromatization is enhanced, and its relative reflectance gradually increases [33]. The results of Micro-FTIR experiments on SB at different evolution stages also show [35] that the intensity descended in the aliphatic area and ascended in the aromatic area as thermal evolution went on. The aliphatic/(aliphatic + aromatic) ratio used to characterize the hydrocarbon generation potential gradually decreased, indicating that the decomposition of SB would produce liquid hydrocarbons to reduce its hydrocarbon generation potential[47]. In addition, the point at which the Ro-Rob relation is reversed varies from basin to basin, depending on the hydrocarbon generation kinetic parameter which corresponds to kerogen type mentioned above. For example, the point of Rob reversal corresponds to Ro of 0.99% for Type-II kerogen in the New Albany marine shale [35] and 1.15% for Type-I kerogen in the Qing 1 Member continental shale.
Table 3. Ro and Rob measurements of Qing 1 Member shale samples from the Songliao Basin |
| Sample No. | Depth/ m | Ro | Rob | ||||
|---|---|---|---|---|---|---|---|
| Average/ % | Standard deviation/% | Number of measurement points | Average/ % | Standard deviation/% | Number of measurement points | ||
| 1 | 1146.6 | 0.61 | 0.09 | 22 | 0.35 | 0.07 | 20 |
| 2 | 1983.7 | 0.90 | 0.08 | 23 | 0.68 | 0.05 | 22 |
| 3 | 2011.2 | 1.10 | 0.02 | 20 | 0.97 | 0.09 | 24 |
| 4 | 2073.6 | 1.11 | 0.08 | 22 | 1.26 | 0.08 | 24 |
| 5 | 2235.8 | 1.41 | 0.09 | 24 | 1.56 | 0.06 | 22 |
| 6 | 2526.9 | 1.58 | 0.06 | 26 | 1.73 | 0.07 | 20 |
| 7 | 2587.1 | 1.77 | 0.08 | 21 | 2.09 | 0.07 | 20 |
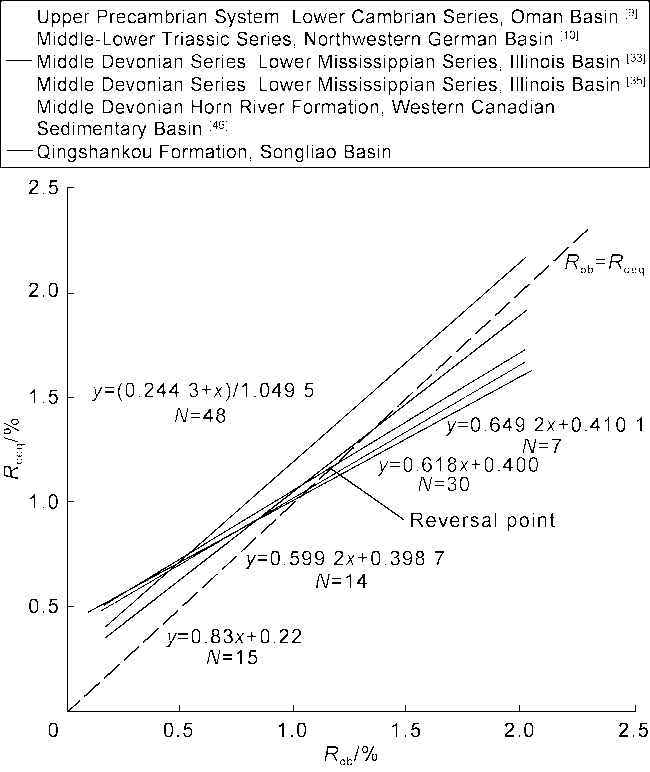
Fig. 6. Rob vs. Roeq of shales in different regions. |
Oil generation by OM is a continuous process, in which pre-oil bitumen and post-oil bitumen may turn up simultaneously. For a same sample, the average reflectance of post-oil bitumen is 0.34 percentage points more than that of pre-oil bitumen, and the reflectance of pre-oil bitumen may be as low as 0.15% [35]. Thus, the impact of pre-oil bitumen should be eliminated when measuring the reflectance of SB within the oil window. Considering this impact due to the optical specificity of SB, laser Raman spectra peak and peak difference can also be selected to evaluate the maturity of shale [48].
4. Effects of solid bitumen on shale reservoir space
The abundance and morphology of OM-hosted pores in SB vary with thermal maturity. The pore structure evolution with maturity was systematically investigated using natural and thermal simulation samples [51]. It was found that the OM porosity has evolved differently from region to region (Fig. 7 ). For the Silurian Longmaxi shales in the Sichuan Basin, SW China, the OM porosity increases due to hydrocarbon generation by korogen, when Ro is 0.7%-1.3%, decreases due to SB filling in pores within the kerogen when Ro is 1.3%-2.2%, and increases again due to continued gas generation by original kerogen when Ro is 2.2%-2.7% [52] (Fig. 7 ). For the Devonian Duvernay shales in Canada, the OM-hosted pore volume tends to decrease after increasing [53]. For the New Albany organic-rich shale (Ro of 0.35%-1.41%), the total pore volume reaches the minimum at Ro of 1.10% and increases at Ro of 1.41% owing to further SB cracking to generate more pores, especially mesopores (2-50 nm) and macropores (greater than 50 nm) [54]. According to the quantitative characterization, for the Qing 1 Member shale samples with different maturities, the OM porosity tends to decrease at Ro of 0.7%-1.0% and increase at Ro of 1.0%-1.6% [16] (Fig. 7 ). Therefore, it is particularly important to understand the pore types of SB at different evolutionary stages.
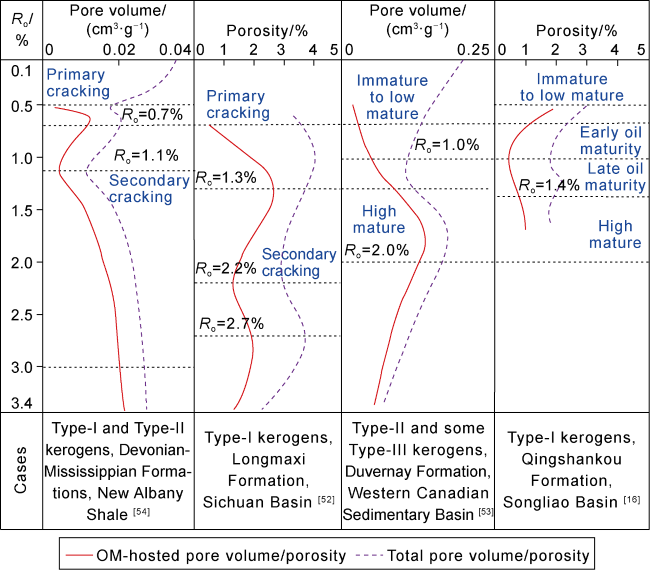
Fig. 7. Total pore volume and OM porosity evolution in different regions (modified from Reference [51]). |
OM-hosted pores in the Qing 1 Member shales are classified into 4 types. The first type is OM-mineral pores formed by short-distance migration of high-viscosity pre-oil bitumen into primary pores in the low-maturity stage and oil window. It is consistent with modified minerals pores observed on the Barnett shale in the early oil generation stage (Fig. 8a ) [42]. The second type is bubble pores generated by mass gas release from in-situ SB or post-oil bitumen within the oil window (Fig. 8b ), when some pores may be filled with liquid hydrocarbons (Fig. 8c ). The third type is cracks induced by SB devolatilization or pressure release after the stage of peak oil generation (Fig. 8d ). Different from natural fractures, devolatilization cracks merely occur in OM instead of extending into inorganic minerals. The fourth type is spongy pores, which are small OM-hosted pores in pyrobitumen at the high-maturity stage (Fig. 8e ). As the maturity increases, small dense spongy pores become further larger and fused to form large irregular pores (Fig. 8f ). In conclusion, the decrease in OM porosity of the Qing 1 Member shales is attributed to two factors: one is cementation and compaction, and the other is a part of OM-hosted pores filled with liquid hydrocarbons produced by hydrocarbon generation. In the later stage, the nano-pores produced by the gas generation of SB increased the OM porosity.
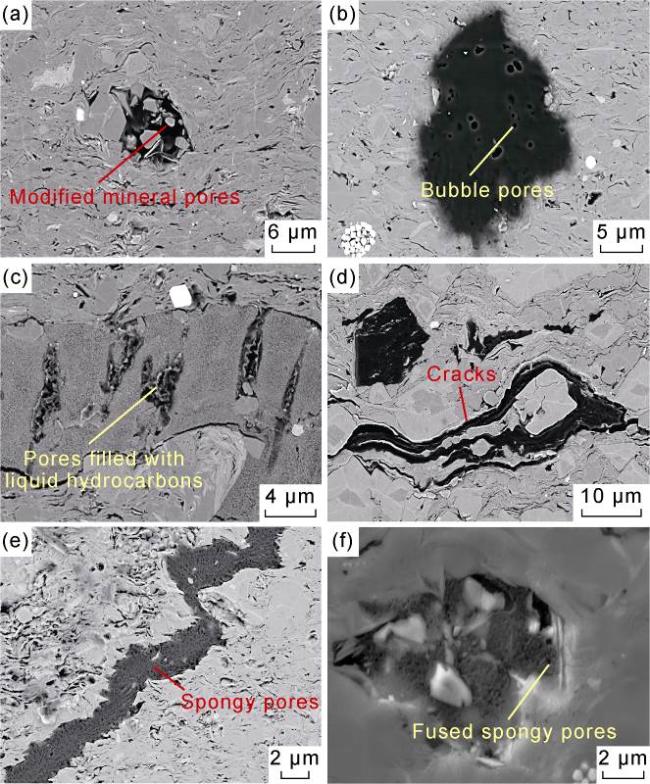
Fig. 8. SB-hosted pores of the Qing 1 Member shales in Songliao Basin. (a) Well AS3, 2049.50 m, Ro of 0.98%, modified mineral pores formed by short-distance OM migration into primary pores; (b) Well AS3, 2060.00 m, Ro of 1.01%, bubble pores generated by gas release; (c) Well AS3, 2060.01 m, Ro of 1.01%, pores filled with liquid hydrocarbons; (d) Well A58, 2112.90 m, Ro of 1.16%, cracks induced by devolatilization; (e) Well A1, 2504.20 m, Ro of 1.51%, spongy pores in pyrobitumen; (f) Well A1, 2558.80 m, Ro of 1.65%, spongy pores fusing together. |
In addition, the interaction between SB and inorganic minerals during diagenetic evolution has an impact on shale porosity in the process of thermal evolution [55]. According to the SEM observation of the contact relationship between inorganic minerals and SB of the Qing 1 Member shales, authigenic quartz played a role in protecting primitive rock skeleton structure and supporting OM-hosted pores to stand against compaction (Fig. 9a ). Pyrite framboids are the product in deep-water reducing environment, and contain intercrystalline pores which may function as the reservoir space for SB migration and accumulation (Fig. 9b ). Harbor-like irregular secondary pores, as the product of dissolution of carbonate minerals by organic acids originating from hydrocarbon generation in the oil window, may be filled with migrated SB at the late stage (Fig. 9c ). Authigenic clay minerals formed at different stages have varying impacts on OM-hosted pores in SB. The authigenic quartz and foliated authigenic chlorite, originating from precipitated potash feldspar bonded with the ions (e.g. Fe2+ and Mg2+) in pore fluids [56] at the stage of early oil generation, may provide preexisting enclosed space for later SB migration (Fig. 9d ). The authigenic clay mineral (e.g. rosette-like authigenic chlorites and authigenic illites), formed at the late oil generation stage, usually inhabite OM-hosted pore space (Fig. 9e ). At the stage of peak oil generation, mass OM-clay complexes appeared in the Qingshankou Formation. OM-clay complexes have higher porosity than single SB (Fig. 9f ), which may be attributed to the clay minerals in OM-clay complexes that catalyzed hydrocarbon generation by OM [57].
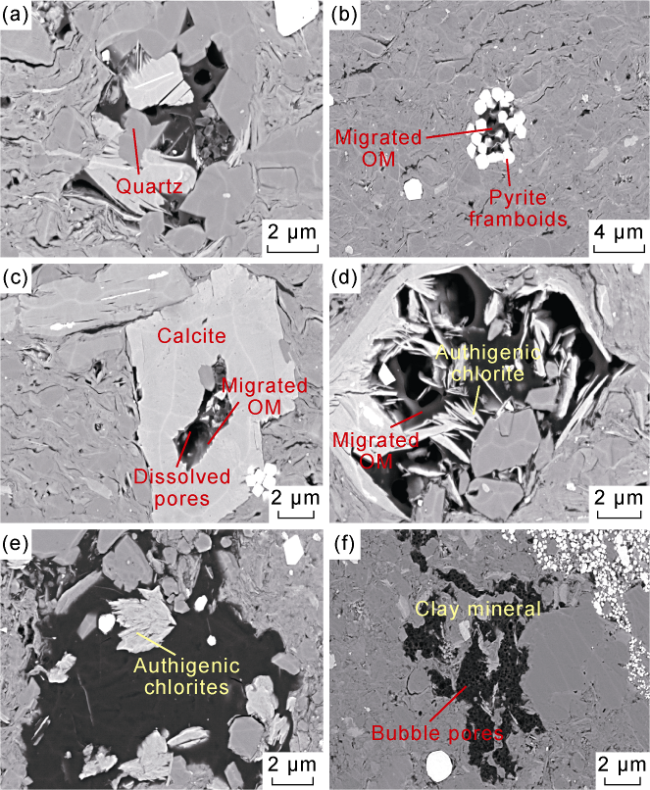
Fig. 9. Relationship between SB and surrounding minerals of the Qing 1 Member shales in Songliao Basin. (a) Well AS3, 2060.00 m, Ro of 1.01%, OM-hosted pores supported by authigenic quartz; (b) Well A58, 2112.90 m, Ro of 1.16%, OM migrating into intercrystalline pores in pyrite; (c) Well A58, 2112.90 m, Ro of 1.16%, OM migrating into dissolved pores; (d) Well A21, 1669.90 m, Ro of 0.83%, SB migrating into intercrystalline pores in authigenic chlorite forming at the stage of early oil generation; (e) Well A544, 2278.50 m, Ro of 1.26%, authigenic chlorite forming at the stage of late oil generation filled in OM-hosted pores; (f) Well AS3, 2049.50 m, Ro of 0.98%, more bubble pores in OM-clay complexes than in single OM. |
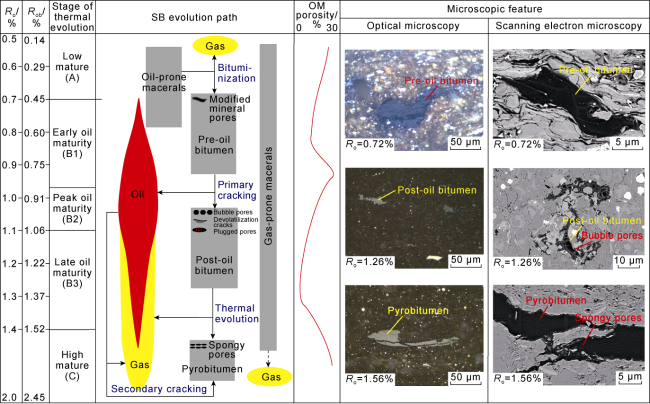
In summary, the OM porosity evolution of the Qing 1 Member in the Songliao Basin is divided into 4 stages (Fig. 10 ). At the low-maturity stage with rapid compaction, oil-prone maceral began to convert into pre-oil bitumen, when Ro was larger than Rob. The OM porosity decreased. Pores were scarce in primary macerals and pre-oil bitumen. From the stage of early oil generation to peak oil generation, oil and gas were generated due to primary cracking of pre-oil bitumen, when Ro was larger than Rob. The OM porosity increased owing to bubble pores and devolatilization cracks occurring in SB and modified mineral pores formed by migrated SB moving into interparticle pores. At the stage of late oil generation, when Ro was smaller than Rob, OM-hosted pores were filled with liquid hydrocarbons and post-oil bitumen, leading to a decrease in OM porosity. At the high-maturity stage, pyrobitumen and gas were converted from post-oil bitumen as thermal evolution went on and also generated by secondary cracking of oil, when Ro was smaller than Rob. The OM porosity began to increase, which was ascribed to spongy pores forming in the process of gas generation.
Fig. 10. SB evolution path and OM porosity evolution model of the Qing 1 Member in Songliao Basin. |
5. Conclusions
Maceral types at the stage of low maturity and early oil generation can be identified using optical microscope based on the petrographic characteristics of primary maceral and SB. All SB exhibit no fluorescent characteristics, except for some pre-oil bitumen which display reddish brown fluorescence. Compared with in-situ SB, migrated SB has typical morphological characteristics such as filling pores and wrapping authigenic minerals, which enable its identification through SEM. However, electron microscope is incapable of distinguishing in-situ SB from other macerals, for which the combination of optical and electron microscopies for in situ analysis is recommended.
Various primary maceral types are the primary contributor to different SB evolution paths. Rob increases linearly with Ro, and the point at which the Ro-Rob relation is reversed varies from basin to basin. The impact of pre-oil bitumen should be eliminated when measuring Rob within the oil window.
Interparticle pores supported by authigenic quartz, intercrystalline pores in pyrite framboids, dissolved pores, and intergranular pores in authigenic clay mineral forming before the stage of peak oil generation can provide reservoir space for SB migration and accumulation. Authigenic clay minerals forming after the stage of peak oil generation may decrease OM porosity to some extent.
Some aspects should be considered in the study of SB which is an important type of secondary macerals. First, diverse focuses on SB in different fields lead to somewhat confused SB classification criteria and nomenclature. Hence, the connotation of the terms in use should be clarified and the explanation is needed when necessary. Second, the errors of Rob measurement for SB with different maturities have a negative impact on Rob-Roeq conversion, and this problem can be fixed using Raman spectroscopy. Third, SB-hosted pores are significant to reservoir space forming, preservation, and destruction. Thus more efforts should be focused on microscopic effects of SB migration paths and dynamics on hydrocarbon migration and occlusion. Additional scientific problems to be addressed involve the influence of alternating stress field generated in the process of subsurface gas sequestration on SB occurrence state, the reaction of SB to injected gases, and reservoir space alteration by SB.
Nomenclature
Ro—vitrinite reflectance, %;
Rob—SB vitrinite reflectance, %;
Roeq—equivalent vitrinite reflectance, %;
TOC—total organic carbon content, %.