

Introduction
Geochronology of hydrocarbon accumulation is of vital importance to research of petroleum geology, and precise dating of the processes relative to hydrocarbon accumulation is an important part of hydrocarbon accumulation chronology [1-2]. Fluid inclusions record information such as fluid composition [3], pressure [4] and temperature [5] at the time of entrapment, and provide the most direct evidence for the study of diagenetic evolution and hydrocarbon migration and accumulation processes [6]. However, the precision and interpretation of inclusions are usually influenced by various factors such as reequilibration [6], experimental conditions [7], and hydrothermal fluids [8], resulting in controversial results to the overall understanding of the hydrocarbon involved diagenetic evolution process. With the introduction of many new methods and technologies such as reservoir geochemistry [9], fluid inclusion analysis [10], isotope dating [11], and oil-gas-water interface traceability [12], combination of indirect and direct studies, and combination of qualitative and quantitative (or periodical and chronological) studies have become an important trend of the development of modern geochronology of hydrocarbon accumulation[13-14]. Other commonly used methods include geologic analysis [15], authigenic illite K-Ar dating [16], and reservoir asphalt Re-Os dating [17]. However, all these methods have their own limitations. At present, recovering reservoir-forming time sequence is still very challenging. Radioisotope dating, laser ablation system and high-precision mass spectrometry represent the development direction of hydrocarbon accumulation chronology [18-19].
Carbonate minerals are formed in different environments throughout the various stages of diagenesis, reservoir formation and hydrocarbon accumulation [18]. Calcite U-Pb dating result can be used as a timer of geological events [19] to provide chronological constraints for the study of different geological problems[18-19]. They can constrain the time of oil and gas generation, improve the accuracy of reservoir formation dating, and provide a more reliable research method for the restoration of the diagenetic-genetic process in deep and ultra-deep complex oil and gas reservoirs [20]. Carbonate U-Pb dating has also shown a great potential in the study of integrated thermochronology of carbonate sediments, and plays an important role in recovering the hydrocarbon generation, migration and accumulation histories [19-20]. Ancient superimposed basins have experienced complex evolution, so traditional basin modeling and fluid inclusion methods cannot provide very precise timing of hydrocarbon accumulation in these superimposed basins due to the error of eroded thickness recovery or the uncertainty of paleo heat flow value, etc. The combination of isotopic dating and fluid inclusion homogeneous temperature can effectively exclude the multiplicity of solutions, improve the accuracy of basin evolution history, and effectively explain the process of oil and gas accumulation [13].
Oil-gas inclusions contain a small amount of hydrocarbon that was entrapped during diagenesis. The occurrence of hydrocarbon inclusions is influenced by host minerals, therefore petrographic observation of hydrocarbon inclusions provides basic data for describing and analyzing inclusions [4⇓-6]. Both carbonate phases and the development of fluid inclusions are closely related to diagenesis [19⇓-21]. The first step of the analysis of basin fluid evolution and hydrocarbon accumulation chronology is to study mineralogy or petrology, as well as diagenesis by using microscopy to analyze fluid characteristics and evolution in the study area [20]. Oil and gas exploration conditions in the southern margin of the Junggar Basin (Southern Junggar Basin in brief) are complex, and the hydrocarbon accumulation process is unclear, hindering the exploration progress. Taking the Cretaceous Qingshuihe Formation of the Gaoquan Structure as a case, this paper delineates the dynamic matching relationship between reservoir diagenesis and hydrocarbon charging, and analyzes the oil and gas charging process based on petrographic observations, and by combining fluid inclusions dating technology with in-situ calcite U-Pb dating technology using LA ICP-MS (laser ablation inductively-coupled-plasma-mass spectrometry), with the intent to provide a theoretical basis for oil and gas exploration in the Southern Junggar Basin.
1. Geological setting
The Southern Junggar Basin is located at the front of the Northern Tianshan Mountains, from Jimusar Sag in front of the Bogda Mountains in the east to Jinghe in the west, neighboring the Ilin Heibirgen Mountains in the south and the Chepaizi High in the north, 650 km from east to west and 40-90 km from north to south [22-23]. The Sikeshu Sag located at the western section of the Southern Junggar Basin has abundant hydrocarbon resources (Fig. 1a ) [24-25]. In the Sikeshu Sag, there are the Gaoquan South anticline (Well Gaoquan 5), the Gaoquan anticline (Well Gaoquan 1), the Dushanzi anticline, the Xihu anticline, and the Kayindik anticline from south to north [25]. The study area is located at the Gaoquan Structure in the Sikeshu Sag, and covers the Gaoquan South anticline (Well GQ 5) and the Gaoquan anticline (Well GT 1) (Fig. 1b ).
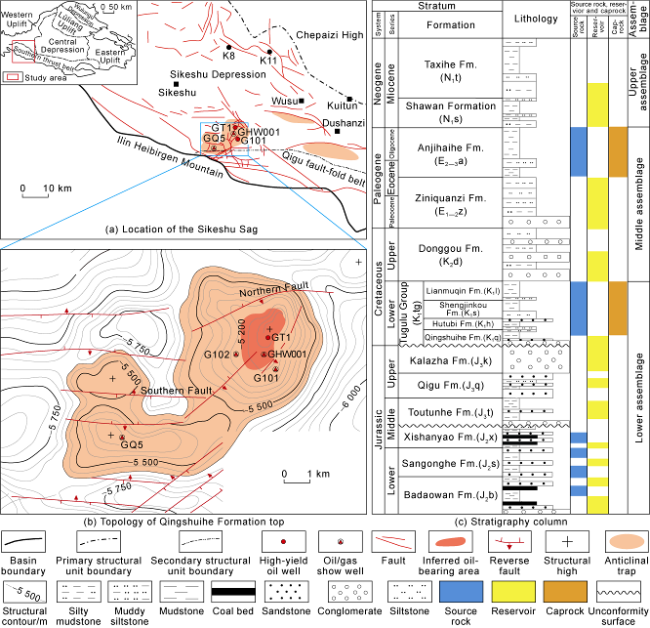
The Southern Junggar Basin was developed on the Precambrian crystalline basement which was folded in the Paleozoic. Sedimentation started from the Late Carboniferous to the Late Permian. Then the strata were folded and uplifted, indicating a cycling feature. The stratigrahy related to oil and gas accumulation in this region can be divided into upper, middle and lower assemblages (Fig. 1c ) [23]. The upper assemblage includes the Neogene Shawan Formation-Taxihe Formation reservoir and the Taxihe Formation caprock. The middle assemblage consists of the Paleogene Anjihaihe Formation-Ziniquanzi Formation and Cretaceous Donggou Formation reservoirs and the Paleogene Anjihaihe Formation mudstone caprock. The lower assemblage is composed of the Cretaceous Qingshuihe Formation bottom and Jurassic Toutunhe Formation reservoirs and the Cretaceous Tugulu group mudstone caprock. The grains of the Cretaceous Qingshuihe Formation (K1q) become gradually coarse from top to bottom. The upper part is dark-gray mudstone with thin layers of gray muddy siltstone, the lower part is gray carbonaceous siltstone and siltstone interbedded with gray silty mudstone, and the bottom is a thin layer of greenish-gray conglomerate-bearing fine sandstone and fine sandstone. The thick mudstone in the upper part is caprock, and oil and gas shows are concentrated at the bottom which is one of the important reservoir sections in the lower assemblage. With the continuous breakthroughs in exploration in recent years, the understanding of hydrocarbon potential, resource evaluation and hydrocarbon generation from the source rocks in the Sikeshu Sag has been continuously improved [22,25]. The Sikeshu Sag mainly develops two sets of hydrocarbon source rocks with large thicknesses and wide distribution [24-25], in the Lower Permian and the Middle-Lower Jurassic, respectively [26]. The Middle-Lower Jurassic hydrocarbon source rocks have a great hydrocarbon potential due to long-time shallow burial history. They have generated low-maturity oil since 30 Ma [27-28].
The tectonic evolution of the Gaoquan area is complex, and can be divided into four stages from the Late Jurassic to the present-day [29]: (1) At the end of the Late Jurassic, under the influence of the Yanshanian Movement, the Sikeshu Sag was uplifted as a whole, resulting in the absence of most of the Middle and Upper Jurassic strata including Toutunhe, Qigu and Kharaza Formations within the sag. (2) During the Cretaceous period, tectonic movement was relatively stable, and an extensive lacustrine environment was formed with the subsidence of the Sikeshu area. (3) In the Late Cretaceous, under the influence of the Yanshanian Movement, regional uplift happened, making the Upper Cretaceous locally missing at the margin of the Junggar Basin. (4) In the Neogene, controlled by the Himalayan Movement, extrusion-thrust structures were substantially developed in the study area and were finalized at the end of the Himalayan period [30].
The Qingshuihe Formation is the most important exploration target in the lower assemblage of the Gaoquan area [31]. Wells GT1 and G101 are located at the Gaoquan structure. The thickness of the Qingshuihe reservoir is 25-31 m. The sedimentary facies of the Qingshuihe Formation are mainly the fluvial sand bodies in the braided delta front. The lithology is dominated by gravels which are easy to form high-quality reservoirs under early long-term shallow burial and late rapid deep burial. Moreover, dissolution pores are developed. The well logging porosity is between 2.07% and 10.15%, and the core porosity ranges from 2.1% to 8.7%. The permeability is (0.034-12.200)×10-3 µm2.
Well test of GT1 obtained oil and gas output over 1000 mcf/d from the Qingshuihe Formation in 2019 [24-25]. The major breakthrough of GT1 has improved the geological understanding of conditions for the formation of large oil and gas field in the lower assemblage, and enhanced the potential of oil and gas resources, which effectively promote the exploration and development in the Southern Junggar Basin. However, after the major breakthrough in Well GT1, G102 was tested an oil-bearing water layer in the Qingshuihe Formation, and G101 found a water layer in the Jurassic Sangonghe Formation, indicating that the oil and gas accumulation conditions are very complicated in the Southern Junggar Basin.
2. Samples and methods
One hundred and sixty-six (166) core samples were collected from the Qingshuihe Formation in wells G101, G102, GHW001 and GQ5 located at the Gaoquan Structure in the Sikeshu sag. First, thin sections and casting thin sections were made from the core samples and observed for petrography by using a Zeiss Axio Imager microscope. Then, 36 typical samples were performed SEM-BSE observation on a JSM6700F equipment and cathodoluminescence (CL) by using Axio Imager and CF-2 cold cathode in order to determine the content of the clastic minerals and characterize the authigenic minerals. After that, 20 samples were selected for fluid inclusion petrology and microthermometry by using a Linkam MDSG600 heating and cooling stage. Fluorescence spectrum of single oil inclusion was recorded by using a USB4000 spectrometer. The composition of aqueous and hydrocarbon inclusions was determined by using a LabRAM HR800 Raman microscopy, equipped with a 632.81 nm YAG laser. All the experiments were carried out in the Key Laboratory of Basin Structure and Hydrocarbon Accumulation (Beijing, China).
On the basis of the experiments described above, 6 typical samples were selected for the analysis of in-situ stable carbon and oxygen isotopes, Rb-Sr isotopes and trace elements to further identify different calcite phases. The equipment for stable carbon and oxygen isotopes is a Delta isotope mass spectrometer with a CETAC laser system in the Experimental Center of CNOOC Energy Development Co., Ltd. Rare earth elements (REE) measurement was performed in Beijing Createch Testing Technology Co., Ltd, using an AnalytikJena PQMS Elite ICP-MS equipped with a RESOlution 193 nm laser ablation system. Calcite in-situ U-Pb dating was done in the Key Laboratory of Basin Structure and Hydrocarbon Accumulation (Beijing, China) using a Thermo Element XR and NWR 193 nm LA ICP-MS system.
3. Results
3.1. Petrography
The conglomerate reservoir at the bottom of the Qingshuihe Formation in the study area was mainly deposited in the fan delta plain and the front edge of the fan delta. The reservoir is brown to brownish gray, and dominated by conglomerate with grains between 2 cm and 5 cm. The conglomerate is dominated by mesic mafic lava and tuff, and mostly sub-prismatic to sub-round. The grains are weakly compact, and almost in point-line contact (Fig. 2a ). The reservoir has good properties with developed across-mineral-grain fractures, intergranular pores and intergranular shrinkage fractures. The overall surface porosity is between 6.36% and 10.38% (Fig. 2b ). More big dissolution pores and intergranular shrinkage fractures were found in Well GHW001.
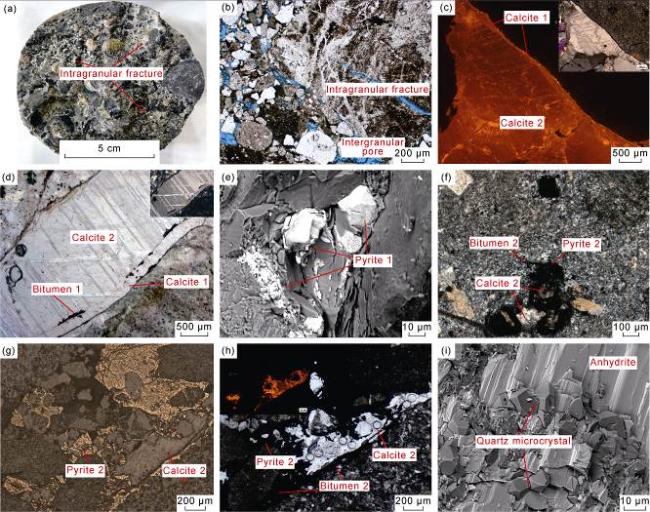
Fig. 2. Petrographic characteristics of the authigenic minerals in the Qingshuihe Formation in the Gaoquan anticline. (a) Conglomerate dominated by moderately acidic mafic rock and tuffs, with pores almost filled with calcite; core photo; Well G101; 6554.00 m; (b) Conglomerate with intergranular pores and microcracks; Well G101; 6022.00 m; plane-polarized microphotograph; (c) Two phases of calcite under CL (large photo) and plane-polarized light (small photo); Well GQ5; 6051.40 m; (d) Bitumen 1 filling between calcite 1 and calcite 2, plane-polarized image; Well G101; 6018.60 m; (e) Subhedral pyrite 1 and microcrystalline pyrite; Well GHW001; 5829.30 m; SEM image; (f) Coexistence of bitumen 2 and pyrite 2; Well GQ5; 6068.00 m; (g) Coexistence of amorphous pyrite 2 and bitumen 2, with calcite coated by pyrite; Well GQ5; 6068.00 m; reflected light; (h) Coexistence of amorphous pyrite 2 and bitumen 2, the same field of view of (g) under plane-polarized light; WellGQ5; 6068.00 m; CL image of calcite on top left; (i) Anhydrite with microcrystalline quartz; Well GQ5; 6051.00 m; SEM image. |
The diagenetic minerals in the Qingshuihe Formation include microcrystalline quartz, K-feldspar, plagioclase, calcite, dolomite, anhydrite and clay minerals, almost no quartz overgrowth was found, and the cement is mainly calcite that’s red and brown under CL (Fig. 2a ). The calcite cements are divided into two phases based on their CL colors (Fig. 2c ). The first phase of calcite (calcite 1) is brighter, and the second phase of calcite (calcite 2) is darker under CL. Calcite 1 is less than calcite 2 in quantity. Calcite 1 is usually precipitated on mineral grains, while calcite 2 precipitated after calcite 1 in the same pores. In summary, it is considered that calcite 2 is later. In Fig. 2d , a small amount of bitumen can be seen between calcite 1 and calcite 2. No twins are found in calcite 1 while twins are obvious in calcite 2. Dolomite is not common, but only microcrystalline dolomite in local fractures. It is usually believed that the dolomite is developed late in the reservoir.
Pyrite crystals are abundant in the reservoir, including microcrystalline pyrite, subhedral pyrite and amorphous pore-filling pyrite, and microcrystalline pyrite and subhedral pyrite are isolated or in fractures (Fig. 2e ). Amorphous pyrite is commonly seen in the samples (Fig. 2f-2h ). Calcite 2 is coated by bitumen 2 and pyrite 2 (Fig. 2f-2h ). Bitumen and pyrite are commonly coexistent around dissolved calcite (Fig. 2g , 2h ). The distribution of microcrystalline pyrite crystals is controlled by the sedimentary laminae (Fig. 2e ), and the pore-filling amorphous pyrite is relatively big in size and coated with calcite 2 (Fig. 2g ). It is believed that the microcrystalline pyrite might precipitate early and belong to a syn-sedimentary product, and the amorphous pyrite is associated with bitumen, possibly related to oil and gas charging.
Quartz overgrowth is rarely seen in the samples, and only microcrystalline quartz and feldspar crystals are found locally, which generally fill in dissolution pores and fractures with dolomite. Considering that the precipitating temperature of quartz is over 80 °C, it is inferred that the quartz was formed later. A minor amount of anhydrite fills in the pores, and coats on microcrystalline quartz, indicating the anhydrite precipitated later than the microcrystalline quartz.
3.2. Fluid inclusions
3.2.1. Fluid inclusion petrology
Petrographic observations show that the abundance of oil-gas inclusions is not high, which may be due to the long-term shallow burial, low formation temperature and weak diagenesis. Many aqueous inclusions are found, mainly in the healed fractures in quartz and calcite cements. The hydrocarbon inclusions found in this study are almost in Well GHW001. In Well G101 there are only methane-bearing aqueous inclusions.
Hydrocarbon fluid inclusions are divided into three types according to their fluorescence colors and components, which are yellow fluorescent oil-gas inclusions, blue fluorescent oil-gas inclusions, and gas inclusions with no fluorescence. Yellow fluorescent oil inclusions are isolated in calcite 1 (Fig. 3a ). They are colorless under plane-polarized light, with gas-to-liquid ratio around 10% and GOI around 1%. Blue fluorescent oil inclusions show a gradient from blue-white to blue (Fig. 3b , 3c ), and most of them are trapped in late calcite (Fig. 3b ) and healed fractures in quartz (Fig. 3c ) in groups or as lines. These oil inclusions are colorless under plane-polarized light, with gas-to-liquid ratio around 15%. The abundance of blue-white fluorescent oil-gas inclusions is apparently higher than that of yellow fluorescent oil inclusions, and their GOI around 5%. Gas inclusions are dark under plane-polarized light, isolated or in clusters (Fig. 3d ). Hydrocarbon-bearing aqueous inclusions are observable in calcite 2 (Fig. 3e ) with GOI around 8%.

Fig. 3. Micro-characteristics of fluid inclusions. (a) Yellow fluorescent oil inclusion in calcite 1; Well GHW001; 829.30 m; polarized light and fluorescence image at bottom left; (b) Blue-white fluorescent oil inclusions in calcite 2; Well GHW001; 5829.30 m; fluorescence image; (c) Blue-white fluorescent oil inclusions in healed fractures in quartz; Well GHW001; 5842.10 m; ultraviolet light; (d) Gas inclusions in quartz; Well GQ5; 6125.56 m; plane-polarized microphotography; (e) Methane-bearing aqueous inclusions in calcite 2; Well GHW001; 5828.20 m; plane-polarized microphotography; (f) Aqueous inclusions in calcite 2; Well G101; 6018.60 m; plane-polarized microphotography. |
Calcite is an important diagenetic mineral in the study area. This study focuses on the aqueous inclusions in calcite. There are a plenty of aqueous inclusions in calcite 2, including those with negative crystal shapes and those distributed as belts and clusters (Fig. 3f ). Their gas-to- liquid ratio is around 10%.
3.2.2. The spectral characteristics of fluid inclusions
The fluorescent spectra peak wavelength of hydrocarbon inclusions (Fig. 4a ) is between 500 nm and 550 nm. The blue fluorescent oil-gas inclusions show wavelengths of the maximum intensity at 520-530 nm, while those of the yellow fluorescent oil-gas inclusions are at around 560 nm, indicating that the blue fluorescence oil-gas inclusions have higher thermal maturities. Raman spectra of gas inclusions (Fig. 3d ) and some vapor phase of aqueous inclusions (Fig. 3e ) show oil-gas methane peaks at around 2916.38 cm-1 (Fig. 4b ).
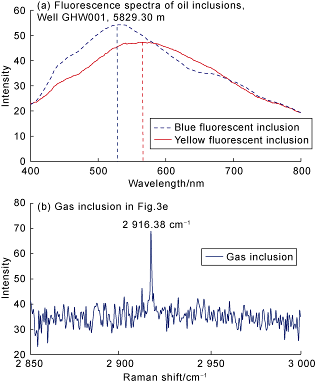
Fig. 4. Spectra show fluid inclusion compositions. |
3.2.3. Homogenization temperature and salinity
Pure oil inclusions are rare in the samples, and the size of the inclusion is less than 10 μm. We are unable to obtain the homogenization temperatures of blue and yellow fluorescent oil-gas inclusions and their coeval aqueous inclusions, but the homogenization temperature of the aqueous inclusions that are coeval with gas inclusions is measured to be between 150.5 °C and 177.2 °C (Fig. 5a ). The aqueous inclusions in quartz-healed fractures are homogenized between 79.6 °C and 117.2 °C, and 134.7 °C and 168.2 °C (Fig. 5a ). The microthermometry results of aqueous inclusions in calcite show that the homogenization temperatures are distributed in two intervals, 91.2-123.3 °C, and 149.6-158.7 °C. The final ice melting temperature is between -13.1 °C and -1.6 °C, corresponding to the salinity between 2.47% and 16.99% NaCl equivalent (Fig. 5b ). The correlation between salinity and homogenization temperature can be divided into two sections at around 130 °C to 140 °C, indicating regional fluid activity at that time.
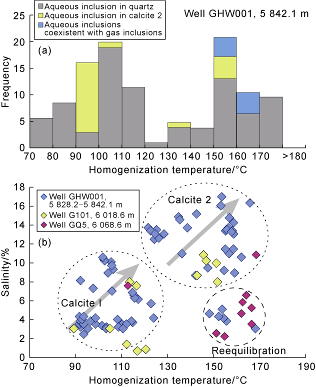
Fig. 5. (a) Homogenization temperature histogram and (b) cross-plot of homogenization temperature and salinity of the Qingshuihe Formation in Gaoquan Structure. |
3.3. Compositions of calcite cements
Rare earth elements (REEs), Rb and Sr isotope ratios and carbon and oxygen isotope compositions are used to determine the mineral formation stage and environmental characteristics. In this study, calcite cements in wells G101, GHW001 and GQ5 were performed in-situ elemental and carbon and oxygen isotopic analyses. The element results were normalized by using the Post-Archean Australian Shale (PAAS).
The REE patterns of calcite 1 (Fig. 6 ) show overall low ∑REE concentration, missing Ce and Pr in LREE and missing Ho but rich Tm in HREE. In early calcite 1, δ13C is relatively heavy (Fig. 7a ), between -5.5‰ and -3.9‰, δ18O between -14.8‰ and -12.7‰, 87Rb/86Sr ratio between 0.000 07 and 0.000 24, 87Sr/86Sr ratio between 0.707 2 and 0.707 9, and the data points are relatively scattered on the cross-plot of 87Sr/86Sr vs. 87Rb/86Sr (Fig. 7b ).
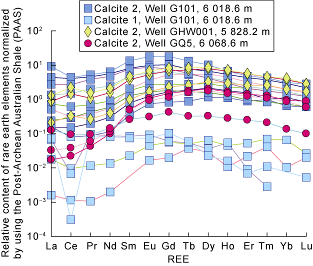
Fig. 6. Rare earth element patterns of the calcite cements in the Qingshuihe Formation in the Gaoquan Structure in Junnan (normalized according to Reference [32], curves with different colors represent different points of samples). |
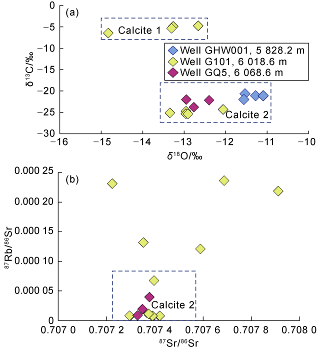
Fig. 7. (a) Carbon and oxygen and (b) Rb-Sr isotopic compositions of the calcite in the Qingshuihe Formation in Gaoquan Structure. |
The REE patterns of calcite 2 are similar, and their ∑REE higher than that of calcite 1. Most of calcite 2 show missing LREEs and flat HREEs (Fig. 6 ). Calcite 2 has relatively lighter δ13C, between -26.5‰ and -21.1‰, δ18O between -15.1‰ and -11.1‰ (Fig. 7a ), 87Rb/86Sr ratio between 0.000 01 and 0.000 07 and 87Sr/86Sr ratio between 0.707 3 and 0.707 4. The data points on the 87Sr/86Sr and 87Rb/86Sr cross-plots are lower and more concentrated than calcite 1 (Fig. 7b ).
In summary, the two calcite phases in the study area shows distinctive elemental and isotopic characteristics. It is inferred that calcite 1 was precipitated during syn-sedimentary stage. Its REE and carbon and oxygen isotopic characteristics are a mixture between sedimentary water and terrestrial debris. The clastic influx enlarged the bulk REE and carbon and oxygen isotopes’ ranges. Calcite 2 is inferred to be the product of quick precipitation of deep hydrothermal fluids with stable distribution of REE and carbon and oxygen isotopes.
3.4. LA-ICP-MS in-situ U-Pb dating
The results of LA-ICP-MS in-situ U-Pb dating on two phases of calcite are shown in Fig. 8 . Due to the limited occurrence of calcite 1 (Fig. 8a , 8b ), points with high U concentration and low common Pb were selected during tunning stage. Elemental mapping of 206Pb (Fig. 8d , 8g ) and 238U (Fig. 8e , 8h ) was done before selecting points with high 238U and low 206Pb concentrations for U-Pb dating on calcite 2.

Fig. 8. LA-ICP-MS mapping and U-Pb dating results of calcite in the Qingshuihe Formation in Gaoquan Structure. (a) Cathodoluminescence image of two generations of calcite; Well G101; 6018.6 m; (b) characteristics of two generations of calcite; Well G101; 6018.6 m; larger image under plane-polarized light, and small one under cathodoluminescence; (c) U-Pb dating of calcite 1; Well G101; 6018.6 m; (d) 206Pb concentration map of calcite 2; Well G101; 6018.6 m; (e) 238U concentration map, the same field of view as d; (f) U-Pb dating of calcite 2; Well G101; 6018.6 m; (g) 206Pb concentration map of calcite 2; Well GQ5; 6018.6 m; (h) 238U concentration map, the same field of view as (g); (i) U-Pb dating of calcite 2; Well GQ5; 6018.6 m. |
The laser spot size for calcite 1 was 120 μm in diameter. 196 points were measured, showing U between 0.004 6 μg/g and 0.472 5 μg/g, with an average of 0.048 8 μg/g; 238U/206Pb ratio between 1.541 and 12.640, and 207Pb/206Pb ratio between 0.627 and 0.908. The lower intercept age is (122.7±6.0) Ma, the initial 207Pb/206Pb ratio is 0.908, and the MSWD (mean standard weight deviation) is 1.8 (Fig. 8c ).
The laser spot diameter for calcite 2 in Well G101 was 160 μm. A total of 306 points were measured. The results show U between 0.000 285 and 0.747 000 μg/g, with an average of 0.155 μg/g, 238U/206Pb ratio between 0.004 5 and 359.710 0, and 207Pb/206Pb ratio between 0.194 and 0.886. The lower interception age is (14.2±0.3) Ma, the initial 207Pb/206Pb ratio is 0.886 and the MSWD is 2.8 (Fig. 8f ). The 160 μm laser spot size was kept for 198 points on calcite 2 in Well GQ5, showing U between 0.009 and 0.838 μg/g, with an average of 0.089 μg/g, 238U/206Pb ratio between 0.71 and 357.81, and 207Pb/206Pb ratio between 0.26 and 0.99. The lower intercept age is (14.4±1.0) Ma, the initial 207Pb/206Pb ratio is 0.99 and the MSWD is 1.3 (Fig. 8i ).
4. Discussion
4.1. Semi-quantitative determination of diagenetic sequence and hydrocarbon charging events
The Qingshuihe Formation has large porosity. Quartz overgrowth is rarely seen in the reservoir. Only late microcrystalline quartz is seen in calcite cements. Locally, there is calcite 1 on clastic grains (Fig. 2c ), with U-Pb age of (122.7±6.0) Ma. Calcite 2 is more than calcite 1 in volume, and it occurs as fillings in pores, with U-Pb age of (14.4±1.0) Ma (Well GQ5) and (14.2±0.3) Ma (Well G101).
Pyrite 1 is subhedral or microcrystalline crystals (Fig. 2e ). Pyrite 2 is amorphous crystals filling in pores and coating calcite 1 and coexisting with bitumen (Fig. 2f , 2g ). The formation of bitumen is associated with calcite 2 cementation and hydrocarbon charging. The study area experienced a long period of shallow burial and intense subsidence at the late stage. The precipitation of quartz requires the formation temperature to be over 80 °C. Moreover, hydrocarbon charging decreases the pH of formation fluids, facilitating quartz precipitation, which indicates that the microcrystalline quartz (Fig. 2i ) post-dates late hydrocarbon charging. Anhydrite occurs as continuous crystals in pores, with its replacement of clastic fragments and coating on the microcrystalline quartz (Fig. 2i ), indicating it post-dates the microcrystalline quartz.
Based on petrographic observations and three types of oil-gas inclusions (yellow and blue fluorescent oil-gas inclusions and gas inclusion), it is inferred that the study area has experienced three episodes of oil charging. Yellow fluorescent oil-gas inclusions (Fig. 3a ) are relatively less, and the fluorescent wavelength of the maximum intensity is at around 560 nm, indicating weak oil charging and low thermal maturity. These yellow fluorescent oil inclusions and the bitumen 1 occurring between calcite 1 and calcite 2 are the products of the first episode of oil charging. The coexistence of pyrite 2, calcite 2 and bitumen 2 (Fig. 2g , 2h ), as well as the occurrence of blue fluorescent oil-gas inclusions in the healed fractures in calcite 2 and quartz, represent the second episode of oil charging. The blue fluorescent oil-gas inclusions (Fig. 3b , 3c ) whose fluorescence wavelengths are mainly at between 520 nm and 530 nm are more abundant in quantity and higher in thermal maturity than the yellow fluorescent oil inclusions. They, together with bitumen 2, are the evidence of late charging of mature oil. The homogenization temperature of coeval aqueous inclusions of gas inclusions is 150.5-177.2 °C (Fig. 5a ), representing late natural gas charging.
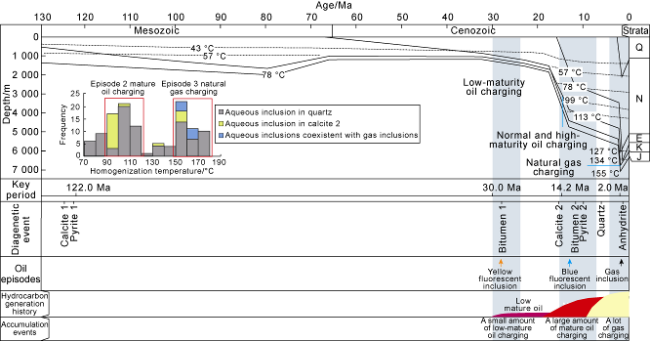
A semi-quantitative diagenetic sequence has been preliminarily established, including (1) calcite 1 and pyrite 1 (long and shallow burial, 122.1 Ma); (2) the first episode of oil charging (bitumen between two calcite phases and yellow fluorescent and low-thermal-maturity oil inclusions); (3) calcite 2 (14.2 Ma) and the second episode of oil charging (blue fluorescent oil-gas inclusions, bitumen 2) with pyrite 2; (4) gas charging (gas inclusions).
4.2. Burial history reconstruction based on U-Pb dating
The combination of homogenization temperature of fluid inclusions and burial history is a traditional and effective means to determine hydrocarbon charging stages. However, the solutions to hydrocarbon charging time are multiple under the influence of the limitation of microthermometry and multiple uplifting of the basin [6⇓-8]. The ancient superimposed basin has experienced a complex history, making traditional basin modeling and fluid inclusion techniques unable to determine the hydrocarbon charging time in some cases [13]. For example, there are errors in restoration of the amount of erosion, and uncertainties in heat flow. This study uses the homogenization temperature of fluid inclusions and absolute isotopic ages to constrain heat flow, and produce a more accurate basin history which is effective for the interpretation of hydrocarbon charging process.
Previous study suggested that quick subsidence occurred at around 10 Ma when the temperature of the Qingshuihe Formation was over 120 °C [28]. The U-Pb age of calcite 2 is (14.4±1.0) Ma or (14.2±0.3) Ma. In addition, the homogenization temperature of numerous primary aqueous inclusions in calcite 2 is 91.2-103.3 °C. It is considered that the formation temperature of calcite 2 is close to the lowest temperature of the aqueous inclusions at around 91.2 °C at around 14 Ma. The thermal history was reconstructed based on the formation thickness, tops and lithology from Well GHW001 by using BasinMod software. Then the thermal model was calibrated by using the precipitating temperature of calcite 2 and its corresponding U-Pb age.
4.3. Significance of quantifying diagenetic and hydrocarbon charging sequences
Based on the above diagenetic and hydrocarbon charging sequences and combining high-precision calcite U-Pb dating and fluid inclusion technologies, the thermal history of Well GHW001 was determined and thus, the hydrocarbon charging history of the Gaoquan Structure was reconstructed with high dating precision and the reduction of uncertainties in hydrocarbon accumulation.
Measurements of abundant aqueous inclusions in calcite 2 in the reservoir yielded the lowest homogenization temperature of 91.2 °C, corresponding to an age of around 14 Ma. However, it is uncertain which hydrocarbon charging episode was associated with these aqueous inclusions. Due to the shallow burial of the Qingshuihe Formation during the early stage, cements were rarely developed in the reservoir. In addition, the formation temperature of quartz is higher than 80 °C. Only a few low-thermal-maturity yellow fluorescence oil inclusions are found in calcite 1, and no valid homogenization temperature is available, so it is impossible to date early hydrocarbon charging by using the homogenization temperature of fluid inclusions.
Homogenization temperatures were only obtained from the aqueous inclusions coeval with gas inclusions in the Qingshuihe Formation in the Gaoquan area. The lowest is 150.5 °C, corresponding to the late gas charging at around 2 Ma according to the burial history (Fig. 9 ). The two-interval distribution of aqueous inclusions on the cross-plot of homogenization vs. salinity, and apparent salinity increase occurring at 123.3-149.6 °C, means the corresponding age is 2 Ma on the burial history, and indicates the salinity variation was impacted by tectonic movement and late gas charging.
Fig. 9. Comprehensive map including burial, diagenesis, pore evolution and hydrocarbon charging of the Qingshuihe Formation in Well GHW001 in Gaoquan Structure. |
As the primary source rock in the Sikeshu Sag, the Lower-Middle Jurassic source rock [27] started oil generation during the late Paleogene (30 Ma) [28], then entered peak hydrocarbon generation and expulsion after the Neogene [25], and finally gas generation at mature to highly mature stage now [24]. The U-Pb ages of two calcite phases are (122.1±6.4) Ma and (14.2±0.3)-(14.4±1.0) Ma, respectively. Considering what was discussed above and the fact that early hydrocarbon charging post-dates calcite 2 and the tectonic movement occurring at 30 Ma, it is inferred that the first episode of hydrocarbon charging occurred from 14.2 Ma to 30.0 Ma. The coexistence of calcite 2 and bitumen 2, and calcite 2 coated by bitumen, represent the second episode of mature oil charging that started at 14.2 Ma. Based on the large quantity of bitumen 2, pyrite and the relative enrichment of methane-bearing inclusions and the source rock evolution, it is inferred that the mature oil charging at 14.2 Ma and the gas charging at 2 Ma are the primary contributors to hydrocarbon accumulation in the study area (Fig. 9 ).
Hydrocarbon inclusions are abundant in the Qingshuihe Formation in Well GHW001 in the structural high, with the development of dissolution pores. But the abundance of hydrocarbon inclusions is low, and the dissolution is weak in Wells G101 and G102 that are located at the structural low. We can invert the hydrocarbon accumulation process by petrography and fluid inclusions, and then the evolution of trap. Present exploration shows that hydrocarbons are produced from the structural high and water is produced at the structural low because the trap in the Gaoquan Structure has been reconstructed by intense tectonic movements since 2 Ma. The effective trap area became smaller during the main hydrocarbon accumulation stage. In Well GHW001 located at the structural high, hydrocarbon charging continued, while in Wells G101 and G102 located at the structural low, hydrocarbon was hardly preserved during the late stage of the Qingshuihe Formation.
5. Conclusions
Two phases of calcite cements and three episodes of hydrocarbon charging took place in the Cretaceous Qingshuihe Formation in the Gaoquan Structure, the Sikeshu Sag. The in-situ U-Pb ages of the two phases of calcite are (122.1±6.4) Ma and (14.2±0.3)-(14.4±1.0) Ma, respectively. The early small amount of low-maturity hydrocarbon was charged from 14.2 Ma to 30.0 Ma; the second stage of high-maturity oil charge began at about 14.2 Ma; and the third stage of natural gas charge began at about 2 Ma. The major contributors to hydrocarbon accumulation are the mature oil charged since 14.2 Ma and the natural gas since 2 Ma.
The intense tectonic movement at 2 Ma adjusted the Gaoquan structural trap, resulting in the decrease of the effective trap area during the main charging stage. Well GHW001 at the structural high was continuously charged at the late stage, but wells G101 and G102 at the structural low did not trap any late hydrocarbon, so that hydrocarbons are produced from the Gaoquan structural high and water from the structural low.
High-precision calcite U-Pb isotopic dating and fluid inclusion dating techniques can effectively eliminate the multiplicity and uncertainty of hydrocarbon accumulation by calibrating the burial history of the basin and depicting the hydrocarbon charging process in the Gaoquan Structure. On the basis of LA-ICP-MS in-situ U-Pb dating of calcite, this study calibrated the thermal history curve by the trapping temperature of aqueous inclusions in calcite 2 (the lowest homogeneous temperature of 91.2°C), and improved the accuracy of the burial history.