

Introduction
In recent years, significant progress has been made in the exploration and development of continental tight gas reservoirs in China. Three large tight sandstone gas reservoirs have emerged, represented by the Upper Paleozoic formations in the Sulige area of the Ordos Basin, the Upper Triassic Xujiahe Formation in the Sichuan Basin, and the Cretaceous formations in the Kuqa Depression of the Tarim Basin in China. In addition, several high-yield tight sandstone gas wells have been drilled at various layers in the Permian to Jurassic of the Junggar Basin, the Jurassic of the Turpan-Hami Basin, and the Lower Cretaceous of the Songliao Basin. These discoveries show the vast resource potential and promising prospects for tight gas development [1].
Many scholars have conducted extensive researches on the formation conditions, gas-water distribution and production patterns, and enrichment control factors of different types of tight gas in different basins, which have provided a solid foundation for the exploration and development of tight gas. The favorable conditions for the large-scale accumulation of tight gas include substantial gas sources, well-developed reservoir, and extensive close contacts between gas source and reservoir [2]. However, tight gas areas display strong heterogeneity in gas-water distribution and production characteristics. Regarding gas-water distribution patterns, the gas-bearing area is continuous or nearly continuous in the horizontal plane, while gas saturation varies significantly in the vertical direction [3-4]. Regarding gas-water production characteristics, there are significant differences in production capacity and fluid type in different tight gas areas. High-yield gas wells may or may not produce water, and the same holds for low-yield gas wells [5⇓-7]. Even within the same block, tight gas reservoirs/zones may exhibit different characteristics in different vertical layers and horizontal locations, including gas-dominant production, co-production of gas and water, and water-dominant production [8]. Considering the gas-water distribution and production heterogeneity of tight gas in various basins, many researchers have studied the mechanism of tight gas charging and accumulation from the perspective of geological observation. These studies reveal that the charging and accumulation process of tight gas is affected by factors such as tectonic settings, source rock conditions, reservoir characteristics, source-reservoir spatial relationships, and rock-fluid interaction forces [9⇓-11]. Jiang et al. [12-13] conducted physical simulation experiments and discussed the process/model of tight gas charging and accumulation. They divided the process into three stages: energy accumulation, episodic charging and accumulation and preservation. They also suggested the existence of three thresholds during the charging and accumulation process: gas charging, gas saturation and gas termination, corresponding to three critical states of free water-bound water coexistence, free water-bound water-natural gas coexistence, and natural gas-bound water coexistence, respectively. On the whole, the researches on tight gas charging and accumulation have qualitatively summarized the corresponding patterns from both experimental simulation and geological observation perspectives, but there is a lack of quantitative mathematical models to elucidate the charging and accumulation mechanism of tight gas.
Tight gas charging and accumulation depends primarily on the relationship between the overpressure caused by hydrocarbon generation of the source rock and the capillary resistance of the tight reservoir (neglecting buoyancy effects) [14]. The enrichment degree and distribution pattern of tight gas depend on the hydrocarbon expulsion of the source rock and the gas storage capacity of the tight reservoir [15⇓-17]. Therefore, it is of great significance to couple source rock condition, reservoir condition, and source-reservoir matching relationship and to establish a mathematical model to quantitatively determine charging pressure difference, charging gas volume, gas saturation and gas-bearing thickness. This will aid in revealing the mechanism of tight gas charging and accumulation, clarifying the main controlling factors of tight gas enrichment, and understanding gas-water distribution and production patterns. It is also crucial for the objective evaluation of tight gas resource potential, recoverable reserves and production rates, and the selection and assessment of sweet spots and intervals.
Based on the nuclear magnetic resonance coupling displacement (displacement-NMR) physical simulation experiments of tight gas, this study constructed a mathematical model of tight gas charging and accumulation according to material balansandy conglomeratece and mechanical equilibrium. By analyzing the heterogeneous patterns of gas-water distribution and production in the tight gas areas of the typical basins in China, this study combined physical simulation, numerical simulation, and geological observation to comprehensively demonstrate the mechanism of tight gas charging and accumulation.
1. Geological overview and exploration and development status of the study area
The Xujiaweizi fault depression is situated in the northern part of the Songliao Basin, and on the eastern flank of the ancient central uplift belt (Fig. 1a ), which is the region with the richest deep natural gas reserves in the Songliao Basin. The stratigraphy in this fault depression comprises, from bottom to top, the Upper Jurassic Huoshiling Formation, and the Lower Cretaceous Shahezi Formation, Yingcheng Formation and Denglouku Formation (Fig. 1b ). During the deposition of Shahezi Formation, extensive fan deltas, braided river deltas, and lacustrine deposits were prevalent and lithologically dominated by sandy conglomerate interbedded with mudstone. The Yingcheng Formation was deposited during a period of frequent volcanic activities, featuring volcanic rocks interbedded with sand and mud. The Shahezi Formation serves as the primary gas source for deep reservoirs, including the Yingcheng Formation volcanic rocks. It also acts as the primary development interval of tight glutenite gas reservoirs.
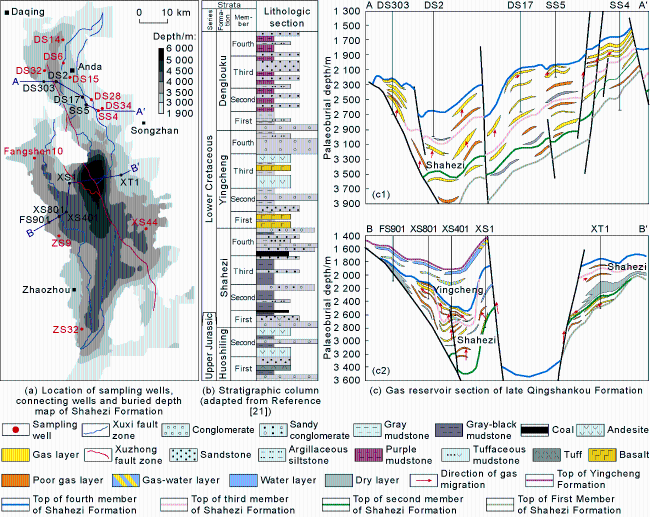
Fig. 1. Basic geological information of the Xujiaweizi fault depression. |
The Shahezi Formation can be divided into four members from bottom to top, with the second and third members of Shahezi Formation serving as the main source rock intervals and the first and fourth members predominantly consisting of sandy conglomerate and locally containing volcanic rocks. The source rock evaluation results indicate that in the Xujiaweizi fault depression, the Shahezi Formation source rocks are abundant in organic matter, primarily of Type III, with high maturity and substantial thickness [18]. The gas generation intensity generally exceeds 50×108 m3/km2, and in some local areas, it reaches 200×108 m3/km2. This signifies the potential for forming large-scale gas accumulations [19]. Reservoir evaluation results reveal poor physical properties of the Shahezi Formation reservoirs in the Xujiaweizi fault depression, which are characterized as typical tight reservoirs. The porosity ranges from 2.0% to 8.0%, and the permeability typically stays below 1×10⁻³ μm2. Plane comparisons indicate that the Anda-Songzhan area has the highest average porosity in reservoirs, followed by the eastern and western regions of the Xujiaweizi fault depression, while the Zhaozhou area has the lowest average porosity. Vertical interval comparisons show that the fourth member of the Shahezi Formation reservoirs has the highest average porosity, followed by the second member, while the first and third members have the lowest average porosity. The volcanic rock reservoirs of the Yingcheng Formation are characterized by high porosity and low permeability [10].
The well test results in the Xujiaweizi fault depression reveal minimal water production in the Shahezi Formation, except only a few wells yielding several cubic meters of water. Conversely, the Yingcheng Formation exhibits a co-production of gas and water (Fig. 1c ). Gas reservoir profile along the Anda-Songzhan area in the north (Fig. 1c1 ) displays widespread presence of gas. The fourth member of the Shahezi Formation is a relatively concentrated gas-bearing interval, while the second and third members are mostly poor and dry intervals with local gas occurrences. The EW gas reservoir profile in the central region of the Xujiaweizi fault depression (Fig. 1c2 ) shows that the distribution of the Shahezi Formation gas layers is limited and occurs only in local intervals, while poor gas layers and dry layers are dominant. The profile of the Yingcheng Formation reveals the coexistence of gas layers, water layers, and gas-water layers. The distribution plane of well test and the distribution of reservoir profile collectively indicate that tight gas in the Xujiaweizi fault depression has the following characteristics: (1) Gas is widely present in the Shahezi Formation but distributed unevenly in plane. The Anda-Songzhan area in the northern part of the Xujiaweizi fault depression has relatively high gas production capacity during the testing. The wells in the central part and Zhaozhou area of southern part have high production potential, but not widely distributed. (2) Gas layers are predominantly concentrated in the fourth member of the Shahezi Formation, and locally developed in the other members. They are mainly distributed in the central part and Zhaozhou. (3) The tight sandy conglomerate reservoirs of the Shahezi Formation do not produce water, whereas the tight volcanic rock reservoirs of the Yingcheng Formation yield water.
In contrast to the Xujiaweizi fault depression, the Linxing-Huangfu tight gas area of the Ordos Basin features low hydrocarbon generation intensity and favorable reservoir conditions. The gas-water distribution and production of tight gas, across different regions and stratigraphic intervals, are also heterogeneous. In plane, the central Linxing area characterized by relatively high hydrocarbon generation intensity predominantly features gas and gas-water layers in the sandstone reservoirs. Towards the north, it gradually transits to the low hydrocarbon generation intensity in the Huangfu region, where sandstone reservoirs are primarily composed of gas-water layers and water layers. Vertically, in the central part of the Linxing area, tight sandstone reservoirs in the intra-source and near-source zones mainly consist of gas layers, while tight sandstone gas layers and gas-water transition zones coexist in the far-source zone [20].
In light of the heterogeneous distribution and production of gas and water in the two tight gas areas mentioned above, the following geological issues arise in the study area: (1) The reasons behind the difference in gas content within the Shahezi Formation reservoirs in the Xujiaweizi fault depression, (2) The mechanism behind the absence of water in tight gas reservoirs of the Shahezi Formation in the Xujiaweizi fault depression, as opposed to the presence of water in tight gas reservoirs of the Yingcheng Formation, (3) The processes and causes underlying the transition of the gas-water distribution pattern in Linxing-Huangfu tight gas area, which transits from gas layers to gas/water layers and water layers. To address these questions, it is imperative to conduct a comprehensive analysis of the charging and accumulation processes, mechanisms, and controlling factors of tight gas.
2. Physical simulation of tight gas charging and accumulation
2.1. Samples and methods
The experimental samples were collected from the Shahezi Formation in the Xujiaweizi fault depression of the Songliao Basin. The positions of sampling wells are indicated in Fig. 1a . The samples include seven conglomerates, seven sandstones, and one volcanic rock. Their specifications are detailed in Table 1 . Before conducting the displacement-NMR physical simulation experiment, regular gas testing was performed on the samples to measure gas porosity and permeability. Besides, the samples were observed under a microscope (cast thin sections and scanning electron microscopy). The regular gas testing results of gas porosity and permeability are presented in Table 1 .
Table 1. Basic information of samples for physical simulation experiments of gas flooding |
| Sample No. | Well No. | Depth/m | Lithology | Length/mm | Diameter/mm | Porosity/% | Permeability (Regular)/ 10−6 μm2 | |
|---|---|---|---|---|---|---|---|---|
| NMR | Regular | |||||||
| 1 | DS28 | 3064.77 | Sandstone | 28.85 | 25.20 | 9.655 | 9.741 | 13.790 |
| 2 | SS4 | 2774.91 | Sandstone | 33.05 | 24.89 | 7.550 | 8.868 | 13.300 |
| 3 | DS14 | 3676.31 | Sandstone | 32.19 | 25.13 | 6.070 | 6.759 | 6.120 |
| 4 | DS6 | 3450.58 | Sandstone | 29.43 | 24.99 | 4.335 | 3.983 | 5.860 |
| 5 | DS34 | 2865.29 | Sandstone | 29.93 | 25.15 | 6.081 | 5.845 | 1.960 |
| 6 | ZS32 | 4232.49 | Sandstone | 33.40 | 25.35 | 3.908 | 4.523 | 3.700 |
| 7 | FS10 | 3494.29 | Sandstone | 37.67 | 25.09 | 1.181 | 2.932 | 0.042 |
| 8 | XT1 | 3936.31 | Conglomerate | 27.03 | 25.13 | 6.387 | 8.807 | 53.910 |
| 9 | XT1 | 3937.87 | Conglomerate | 30.56 | 25.14 | 6.445 | 8.911 | 108.240 |
| 10 | XS44 | 4135.87 | Conglomerate | 31.83 | 25.07 | 3.959 | 4.211 | 84.100 |
| 11 | XS44 | 4137.87 | Conglomerate | 32.08 | 25.01 | 4.731 | 4.921 | 270.970 |
| 12 | DS32 | 4168.70 | Conglomerate | 24.81 | 25.15 | 4.194 | 5.069 | 28.020 |
| 13 | DS6 | 3540.24 | Conglomerate | 28.10 | 24.99 | 5.411 | 6.147 | 4.810 |
| 14 | XS1 | 3927.03 | Conglomerate | 29.15 | 25.19 | 2.723 | 2.812 | 3.590 |
| 15 | DS34 | 3054.44 | Andesite | 27.27 | 25.15 | 8.825 | 9.365 | 1.830 |
2.2. Physical simulation of tight gas charging and accumulation
The results of displacement-NMR physical simulation demonstrate a close relationship between the process of tight gas charging and accumulation and the charging pressure, as well as the pore structure of the rocks. In conglomerate samples characterized by predominantly micro-fractures and good pore-fracture connectivity (Fig. 2a1 ), the NMR T2 relaxation time of saturated water was generally high, with a primary peak at approximately 100 ms, indicating the prevalence of large-sized pore throats in the reservoir. During the displacement process, the NMR T2 spectrum rapidly decreased with increasing charging pressure (Fig. 2a2 ). When the charging pressure reached 1 MPa, gas saturation reached approximately 65%. When the charging pressure exceeded 2 MPa, gas saturation surpassed 99%, indicating the nearly-complete displacement of water by nitrogen gas in pores and fractures (Fig. 2a3 ). In the conglomerate samples characterized by dissolution pores and relatively good pore-throat connectivity (Fig. 2b1 ), the NMR T2 spectrum of saturated water exhibited a tri-modal distribution. The main peak was on the left, with a peak value of approximately 0.3 ms and a width of 0.03-3.00 ms. The middle peak had a peak value of approximately 20 ms and a width of 3-100 ms. The right peak had a peak value of approximately 300 ms and a width greater than 100 ms. This suggests a wide distribution of pore throat sizes within the reservoir, with each size range taking up a certain proportion. During the displacement process, as the charging pressure increased, the right peak decreased first, followed by a decrease in the middle and left peaks (Fig. 2b2 ). When the charging pressure exceeded 10 MPa, gas saturation reached approximately 60% (Fig. 2b3 ). For the conglomerate samples with intergranular pores mostly cemented by calcium, clay mineral intercrystalline pores as the primary storage space, and poor pore connectivity (Fig. 2c1 ), the MNR T2 value of saturated water ranged between 0.03 ms and 50.00 ms, with a dominant peak occurring at approximately 0.3 ms. This suggests that the reservoir predominantly comprises micropores. During the displacement process, as charging pressure increased, fluids within the pores with T2 values greater than 3 ms were preferentially displaced (Fig. 2c2 ). When the charging pressure reached 12 MPa, the gas saturation was approximately 37% (Fig. 2c3 ). In the conglomerate samples with no visible pores under microscopic scale, the NMR T2 values of saturated water were generally less than 2 ms, with a primary peak near 0.3 ms, indicating the presence of only a small number of micropores. During the displacement process, it was challenging for natural gas to charge into the reservoir, and gas saturation fluctuated owing to data inversion effects (Fig. 2d ).

Fig. 2. Physical simulation results of charging and accumulation of gas displacing water in tight conglomerate. |
3. Numerical simulation of tight gas charging and accumulation
3.1. Numerical model of tight gas charging and accumulation
3.1.1. Initial distribution of free and absorbed water in tight rocks
Rocks are typical porous media, with pore sizes ranging from angstroms to hundreds of micrometers. Prior to the charging of natural gas, the pore space in tight rocks was filled with water. According to its existence state, water can be divided into non-mobile absorbed water on the pore surface and free water as free fluid [22-23]. Assuming that the distributions of adsorbed and free water in tight rocks are as shown in Fig. 3a , the saturation of absorbed water and free water can be expressed as:
$\left\{\begin{array}{c} S_{\mathrm{bw}}=\frac{\phi_{\mathrm{bw}}}{\phi}=\frac{\int_{r_{\mathrm{bw}, \text { min }}}^{r_{\mathrm{bw}, \max }} \phi_{\mathrm{bw}, r} \mathrm{~d} r}{\phi} \times 100 \% \\ S_{\mathrm{fw}}=\frac{\phi_{\mathrm{fw}}}{\phi}=\frac{\int_{r_{\mathrm{fv}, \text { min }}}^{r_{\mathrm{fw}, \max }} \phi_{\mathrm{fw}, r} \mathrm{~d} r}{\phi} \times 100 \% \end{array}\right.$
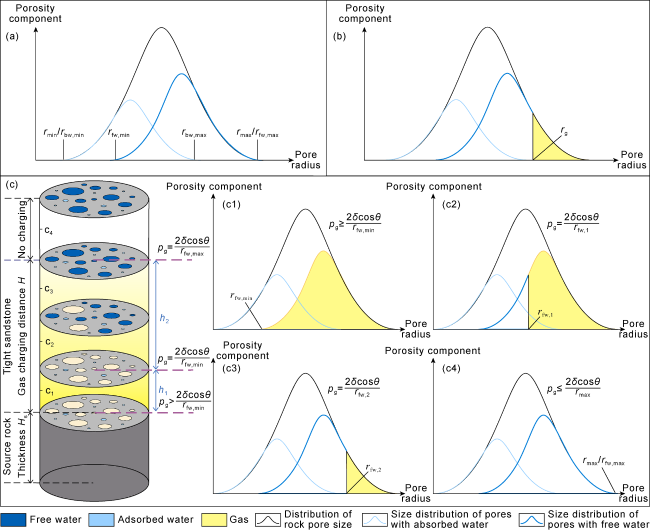
Fig. 3. Gas-water distribution in tight reservoirs during gas charging and accumulation processes. (a) Distribution of absorbed water and free water in tight reservoirs before gas charging. (b) Possible distribution of absorbed water, free water, and natural gas in tight reservoirs after gas charging. (c) Gas charging and accumulation modes and gas-water distribution characteristics at different locations; c1-c4 depict the gas-water distribution features at different locations during gas charging. |
3.1.2. Tight gas saturation
According to the Washburn equation [24], the capillary resistance pr generated by a pore throat with a radius r is given by:
During tight gas charging and accumulation, the mobile fluid is displaced by natural gas, which overcomes capillary resistance in the pores. Since only free water is mobile within the rock, under the charging pressure difference of pg, natural gas can only displace free water in the pores with pore throat radius greater than rg, i.e., the capillary resistance is less than pg, resulting in the gas-water distribution pattern shown in Fig. 3b . Therefore, the relationship between charging pressure difference pg and gas saturation Sg can be expressed as:
3.1.3. Tight gas charging and accumulation process
Eq. (3) shows the relationship between charging pressure difference pg and gas saturation Sg when gas is abundantly supplied. Under geological conditions, however, as natural gas charges and accumulates in tight rocks, the charging pressure difference continuously decreases, leading to variations in gas saturation. Fig. 3c illustrates the process of tight gas charging and accumulation and the gas-water distribution at different stages of charging and accumulation. Based on the capillary resistance corresponding to the charging pressure difference and the pores containing free water, the tight gas charging and accumulation process can be divided into three zones.
(1) Gas saturation stabilization zone (absorbed water-natural gas zone): This zone forms when the charging pressure difference pg is initially greater than pfw,max and continuously decreases until it reaches pfw,max.
It is assumed that the charging pressure difference is pfw,max when the natural gas, whose initial charging pressure difference is pg, reaches a distance of h1 from the source-reservoir interface (Fig. 3c ). Within this distance, the free water in the tight reservoir is displaced by natural gas, and only absorbed water is left, which corresponds to the gas-absorbed water distribution in Fig. 3c 1. At this point, gas saturation reaches its theoretical maximum value, equal to Sfw.
Based on the principle of material balance, h1 can be calculated as:
It is important to note that the gas saturation stabilization zone primarily develops in locations where the source is adjacent to the reservoir. At these locations, the charging pressure difference is typically equal to the overpressure caused by gas expulsion of the source rock. Under this pressure, free water is often completely displaced from the tight reservoir at locations where the source is adjacent to the reservoir, resulting in a gas saturation stabilization zone containing only absorbed water. However, if gas availability is limited and the initial charging pressure difference is less than pfw,max, the gas saturation stabilization zone cannot exist.
(2) Gas saturation reduction zone (free water-absorbed water-natural gas coexistence zone): This zone forms when the charging pressure difference pg is initially greater than pfw,min but less than pfw,max and continuously decreases until reaching pfw,min.
Assuming that the thickness of the gas layer charged during this process is h2 (Fig. 3c ), the gas-water distribution within the tight reservoir gradually changes, as shown in Fig. 3c1-3c4 . During the natural gas charging process, charging pressure difference and gas saturation continuously decrease.
Dividing the gas layer thickness h2 into m equal intervals of Δh, the charging pressure difference decreases to p1 when charging to the first interval of Δh. According to the principle of material balance:
When charging to the mth interval of Δh, the corresponding charging force is pm, which equals to pfw,min, indicating the end of the charging process:
At this point, the charging thickness H can be calculated as:
(3) Uncharged zone: In this stage, the charging pressure difference pg is less than or equal to pfw,min. The natural gas cannot charge into the reservoir due to the small charging pressure difference, and the reservoir retains its original state of absorbed water and free water. Consequently, the gas saturation in the reservoir is zero (Fig. 3c4 ).
3.2. Parameters of the mathematical model for tight gas charging and accumulation
As observed in the preceding section, two key parameters must be determined to elucidate the process of tight gas charging and accumulation: the free water and absorbed water proportions, the relationship between gas saturation Sg and charging pressure difference pg. The former is determined through centrifuge-NMR experiments, while the latter is established by converting the data from high-pressure mercury injection curves.
3.2.1. Free water or absorbed water saturation
Based on the occurrence state, pore water can be divided into adsorbed and free water. The free water can be further divided into capillary-bound water and mobile water [22-23]. Owing to the limitations of centrifuge speed, it is uncertain whether the pressure difference Δp generated by centrifugation is sufficient to remove all the free water in the core. In this study, four different centrifuge pressure differences, 0.184, 0.368, 1.840, 3.680 MPa, were employed (Fig. 4a ). By fitting the centrifuge pressure difference (Δp) to the mobile water proportion (Sm) using the Langmuir-like equation (Fig. 4b ), the saturation of free water was determined [22-23]:
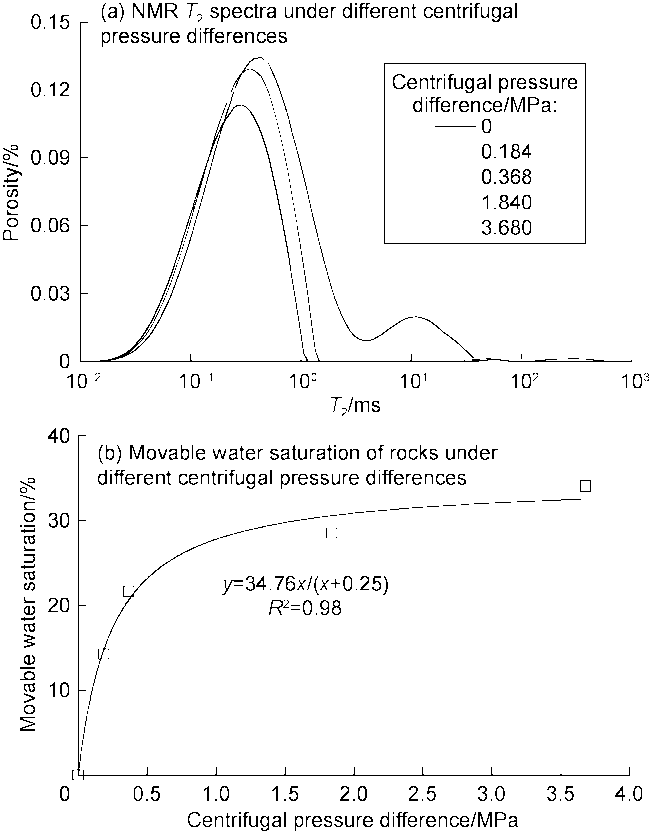
Fig. 4. Illustration of free water and absorbed water proportion. |
Centrifuge-NMR experiments were conducted on 24 samples from the study area, and the results revealed that the free water saturation in the tight reservoir samples ranges from 12.76% to 84.09%, with an average of 44.31%.
3.2.2. Charging pressure difference and gas saturation
High-pressure mercury injection experiment characterizes the relationship between mercury injection pressure and mercury saturation. Utilizing Eq. (2), this relationship is converted to a relationship between charging pressure difference and gas saturation. The contact angle between rock and mercury is approximately 140°, and the interfacial tension is 480 mN/m2. Under laboratory conditions (20 °C, 0.1 MPa), the nitrogen-water interfacial tension is 71.43 mN/m2 [25], with an average wettability angle of 50.4°. In geological conditions, during the formation of tight gas in the Shahezi Formation, temperature ranged from 130 °C to 140 °C, and the formation's hydrostatic pressure was 20-25 MPa [26]. The corresponding methane-water interfacial tension is 44 mN/m2 [25]. Before gas charging, the rock is completely water-wet, with a wettability angle of 0. Thus, the ratio between the pressure required for nitrogen charging under laboratory conditions (pg1), the pressure required for methane charging under geological conditions (pg2), and the pressure required for mercury injection (pHg) for the same pore size is 1.00:0.96:8.00.
Owing to the adoption of regular gas porosity to calculate mercury saturation, the gas saturation (Sg) was converted using the following formula to correspond with the displacement-NMR experiments:
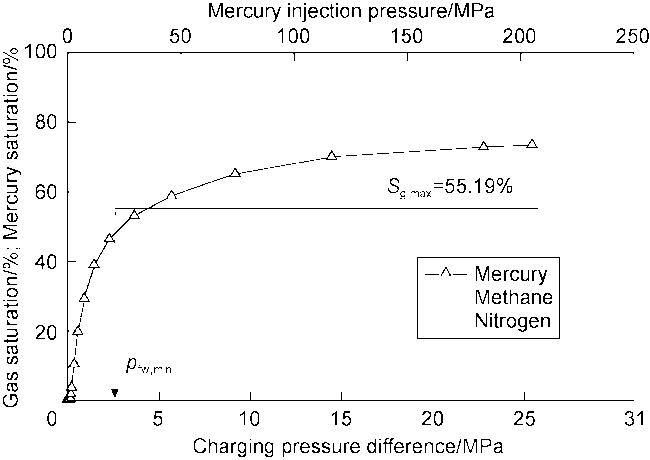
Fig. 5. Relationship between charging pressure and saturation for different fluids charging into rock (using sample 2 as an example). |
3.3. Numerical simulation of tight gas charging and accumulation
3.3.1. Tight gas charging and accumulation process under laboratory conditions
In the laboratory conditions of displacement-NMR physical simulation, nitrogen gas is continuously charged into tight rock, with the inlet pressure increasing while the outlet pressure remaining at atmospheric pressure (0.1 MPa) with an ample supply of gas during charging. Consequently, the change in charging pressure difference can be considered as uniform attenuation, satisfying the following equation:
Based on the different magnitudes of charging pressure difference at various positions along the core, the charging gas saturation at different locations was determined (using Eq. 3), subsequently obtaining the overall gas saturation of the whole rock. Fig. 6a shows a simulation of the distribution of gas saturation at different positions within a cylindrical core (sample ⑨) with length of 30.56 mm, under varying displacement pressures, without considering absorbed water. The results reveal that as the charging pressure difference increases, the gas saturation at the inlet end steadily rises. When the charging pressure difference slightly exceeds 8 MPa, the gas saturation at inlet end reaches 100%. When the charging pressure difference reaches 10 MPa, a charging zone with gas saturation of 100% forms over a short distance at the inlet end, and the length of this zone increases with the increase of charging pressure difference. Considering the influence of absorbed water, the gas saturation at the inlet end of the cylindrical core (sample ⑨) reaches a maximum of 70.72% at a charging pressure difference of 3.0 MPa. Subsequently, the increase of charging pressure difference extends the length of the gas saturation stabilization zone, without affecting the gas saturation at the inlet end (Fig. 6b ).
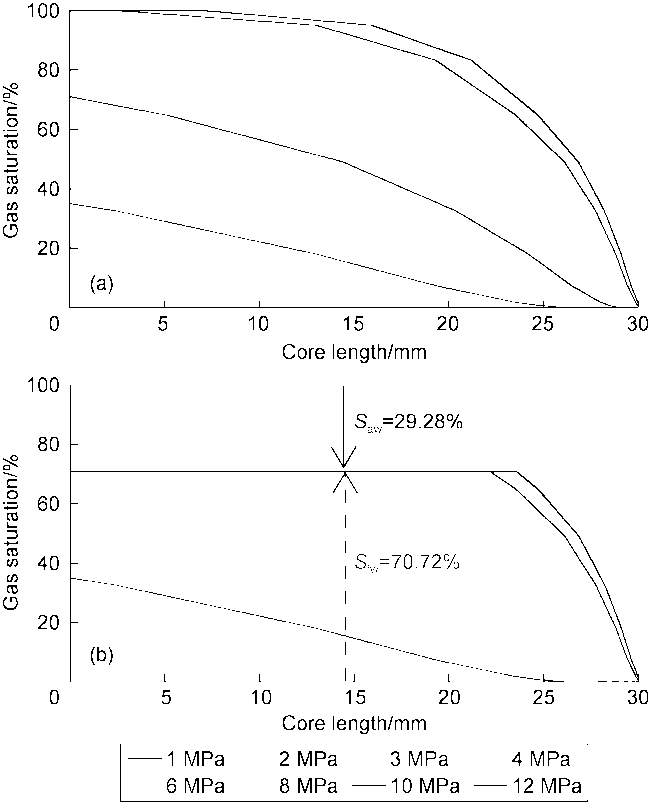
Fig. 6. Numerical simulation of tight gas charging and accumulation in the core with nitrogen displacing saturated water under the laboratory conditions (using sample ⑨ as an example, focusing on gas saturation distribution at different positions within the core without considering (a) and considering (b) absorbed water conditions). |
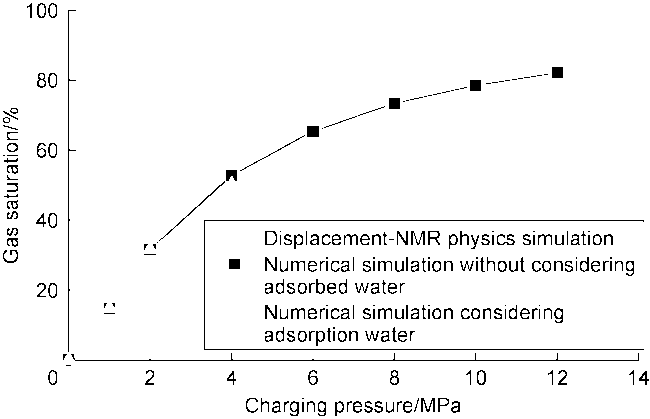
Fig. 7. Comparison of displacement-NMR physical simulation and numerical simulation results for tight gas charging and accumulation under laboratory conditions. |
3.3.2. Tight gas charging and accumulation process under geological conditions
In contrast to laboratory conditions, the charging pressure difference for tight gas under geological conditions does not uniformly attenuate. Set Hs denote the thickness of the source rock supplying gas to the tight reservoir, and V0 denote the expelled gas volume per unit mass of source rock. Then, the amount of gas substance n charging into the tight sandstone reservoir can be calculated as:
The corresponding gas volume Vg under geological conditions is:
Combining Eqs. (4)-(7), the charging and accumulation process of tight gas under different source rock and reservoir conditions were numerically simulated. The numerical simulation result under different source rock conditions shows that the more gas expelled from the source rock, the longer the gas saturation stabilization zone formed in the tight rock, the easier to form a sweet spot of tight gas, and the longer the gas saturation reduction zone. Under the conditions of an initial charging pressure difference of 5 MPa, a source rock thickness of 1 m, and a gas expulsion per unit mass of 0.5 cm3/g, the discharged gas eventually forms a gas saturation stabilization zone of 0.14 m and a gas saturation reduction zone of 0.13 m in the tight rock (sample ⑨). When the gas expulsion per unit mass of source rock is 4.5 cm³/g, the gas saturation stabilization zone is 1.25 m long, and the gas saturation reduction zone is 1.19 m (Fig. 8a ). During the charging process, the decay of the charging pressure difference can also be divided into two stages. When the charging pressure difference is sufficient to completely displace the free water in the rock, the charging pressure difference linearly decreases with the increasing charging distance. This distance corresponds to the gas saturation stabilization zone. When the charging pressure difference is insufficient to displace all the free water in the rock, the charging pressure difference decreases as a "concave function" with the charging distance, which corresponding to the gas saturation reduction zone (Fig. 8b ).
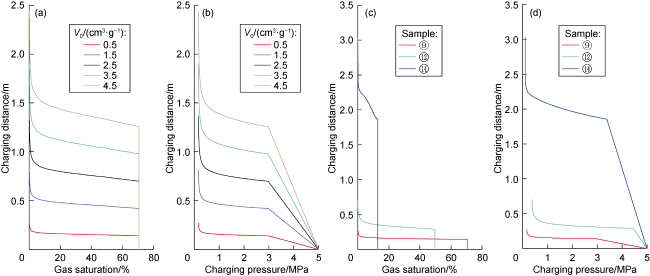
Fig. 8. Numerical simulation results of natural gas charging and accumulation under geological conditions. |
Under the same source rock conditions, the better the reservoir conditions, the shorter the gas saturation stabilization zone and the gas saturation reduction zone, but the higher the gas saturation. We considered three samples, ⑧, ⑫and ⑭ as examples. The porosity and permeability decrease from sample ⑧ to sample ⑫ and to sample ⑭. Under the same gas source conditions, i.e., V0=0.5 cm3/g, H=1 m, pg=5 MPa, the charging distances of natural gas in the three tight reservoirs are 0.27, 0.69, 3.02 m, with thicknesses of the gas saturation stabilization zone being 0.14, 0.29, 1.85 m and corresponding gas saturations being 70.72%, 49.68% and 12.83% (Fig. 8c ). During the charging process, the charging pressure difference decreases with the charging distance. The decreasing process can be divided into a linear decrease stage and a "concave function" decrease stage. The reservoir distances of samples ⑨, ⑫ and ⑭ decrease successively (Fig. 8d ). In the actual natural gas exploration process, however, the rocks with poor physical properties like sample ⑭ will not be selected as the favorable target interval, even if a long gas saturation stabilization zone is formed.
4. Factors influencing tight gas charging and accumulation
4.1. Impact of charging dynamics on tight gas accumulation
Physical simulations indicate a positive correlation between charging pressure difference and gas saturation [8] (Fig. 7 ). Assuming that natural gas expelled from source rocks only accumulates within the tight rocks, the theoretically achievable thickness of the gas saturation stabilization zone in the Shahezi Formation of the Xujiaweizi fault depression and the Upper Paleozoic tight gas area of central Linxing and Huangfu are numerically simulated (Table 2 ). The results demonstrate that in the Shahezi Formation of the Xujiaweizi fault depression, the thickness of the gas saturation stabilization zone can reach 2278.14 m, significantly exceeding the thickness of the sandy conglomerate reservoirs in the Shahezi Formation. The proximity of the Shahezi Formation tight sandy conglomerate to the source rock provides good accumulation conditions during gas charging, along with ample gas sources and a substantial charging pressure difference, which allows for the complete displacement of free water from the sandy conglomerate reservoir, thereby resulting in a gas saturation stabilization zone with only absorbed water. In contrast, the tight volcanic rocks of the Yingcheng Formation is situated farther away from the Shahezi Formation source rock, so the charging pressure difference decreases dramatically due to volumetric expansion after the gas passes through the Xuzhong fault zone. Owing to this reduction, the charging pressure difference cannot displace all the free water in the tight sandstone. Thus, a gas saturation reduction zone, where absorbed water, free water and natural gas coexist, is formed, along with an uncharged zone containing only water. As a result, during the later stages of development, the Shahezi Formation tight gas reservoir produces gas without water, while the Yingcheng Formation yields water along with tight gas.
Table 2. Numerical simulation results of tight gas charging under the geological conditions |
| Formation | Hydrocarbon expulsion intensity/108 (m3·km−2) | ϕ/% | Sfw/% | ph/ MPa | T/°C | pfw,max/ MPa | pfw,min/ MPa | h1/m |
|---|---|---|---|---|---|---|---|---|
| Shahezi Formation, Xujiaweizi fault depression | 100.0 | 5 | 44.31 | 25 | 135 | 5.0 | 0.5 | 2278.14 |
| Upper Paleozoic, Central Linxing | 10.0 | 10 | 70.00 | 18 | 100 | 2.5 | 0.5 | 96.47 |
| Upper Paleozoic, Huangfu Region | 2.5 | 10 | 70.00 | 18 | 100 | 2.5 | 0.5 | 24.12 |
The similar idea is suitable for the gas-water distribution and production characteristics in the Linxing- Huangfu tight gas area of the Ordos Basin, China [20]. Numerical simulations reveal that in the central part of the Linxing region, a gas saturation stabilization zone with a thickness of up to 96.47 m can be formed. In contrast, the Huangfu region has a gas saturation stabilization zone with a thickness of only 24.12 m. Therefore, in the central part of the Linxing region, which has relatively high gas generation intensity in plane, the charging pressure difference is high during the accumulation of tight gas in the intra-source and near-source zones, forming a gas saturation stabilization zone. Thus, gas layers are dominant in these two zones. In contrast, in the far-source zone, the charging pressure difference during tight gas charging is small, and free water is not completely displaced. As a result, a gas saturation reduction zone is formed, where both gas and water coexist within the same layer. In the northern Huangfu region with relatively low gas generation intensity, gas source conditions are poor during the tight gas charging and accumulation in the intra-source and near-source zones, and displacement of free water is incomplete. Thus, a gas saturation reduction zone is formed, and the area is dominated by gas-water layers. In the case of the far-source zone, the charging pressure difference becomes even lower, and tight sandstone reservoirs have not been charged, creating only water-bearing layers.
4.2. Impact of tight reservoir resistance on tight gas charging and accumulation
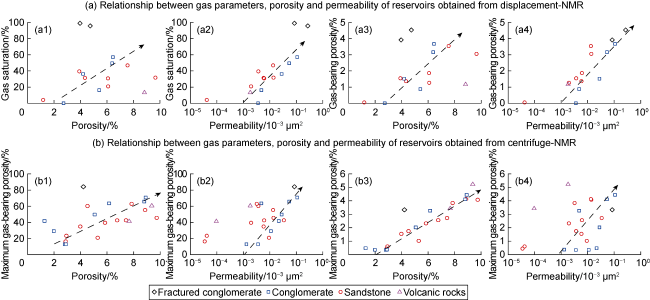
The quality of a reservoir is a key factor affecting the resistance to tight gas charging and accumulation [27]. Displacement-NMR physical simulation results demonstrate that, compared with porosity, permeability has a greater influence on the charging gas saturation in tight reservoirs (Fig. 9a ). For the sandy conglomerate reservoirs with porosity less than 3%, it is challenging for natural gas to charge into rock pores, resulting in a final gas saturation less than 10%. For the sandy conglomerate samples with porosity greater than 3%, there is a weak positive correlation between porosity and charging gas saturation. Volcanic rock samples with relatively large porosity do not achieve high charging gas saturations, but fractured sandy conglomerate reservoirs have high charging gas saturations (Fig. 9a1 ). The relationship between permeability and charging gas saturation shows that when permeability is lower than 0.001×10⁻³ μm2, it is difficult for natural gas to charge into rock pores; when it exceeds 0.001×10⁻³ μm2, gas saturation gradually increases with increasing permeability (Fig. 9a2 ). Gas saturation reflects the relative gas content within the rock but does not represent the absolute gas content. The product of porosity and gas saturation is gas-bearing porosity, which is used to represent the volume of natural gas charging into the rock. The results show a clear positive correlation between gas-bearing porosity and porosity during charging into tight sandy conglomerate reservoirs, with exceptions for fractured conglomerate reservoirs and volcanic rock reservoirs (Fig. 9a3 ). Furthermore, gas-bearing porosity has a more pronounced positive correlation with permeability, whether in sandstones, conglomerates or volcanic rocks (Fig. 9a4 ).
Fig. 9. Influence of physical properties of reservoirs on gas-bearing property. |
Numerical modeling under geological conditions shows that favorable tight gas sections are developed in the tight reservoirs with good physical properties close to the source rocks. In these sections, the formation water in tight reservoirs is completely displaced by natural gas, corresponding to a gas saturation stabilization zone. In this study, the ratio of the maximum gas saturation to the gas content after the charging and accumulation of tight gas under geological conditions was represented by the ratio of free water proportion to porosity as determined by centrifuge-NMR experiments. The results indicate that better reservoir quality leads to higher ratio of free water proportion to porosity, and this relationship is more pronounced than the relationship between permeability and free water (Fig. 9b1 , 9b2 ). Moreover, the correlation between porosity and free water porosity is more apparent than the correlation between permeability and free water porosity (Fig. 9b3 , 9b4 ), highlighting that porosity plays a crucial role in determining the gas enrichment within the rock.
During the accumulation of tight gas in the Shahezi Formation of the Xujiaweizi fault depression, there is a significant charging pressure difference, allowing free water to be completely displaced. This results in a gas saturation stabilization zone containing only absorbed water in the tight reservoir. For tight reservoirs with relatively low porosity, the free water porosity is low, leading to low gas content. Consequently, while these tight reservoirs contain gas, their production capacity and economic value are limited. In contrast, for tight sandy conglomerate reservoirs with relatively high porosity, the free water porosity is high, resulting in large gas content, making them productive and economically viable. In the horizontal direction, the Anda-Songzhan area within the Xujiaweizi fault depression has noticeably higher porosity compared with other areas. In the vertical direction, the porosity of the fourth member of the Shahezi Formation is significantly higher than that of other members. Thus, the Anda-Songzhan area and the fourth member of the Shahezi Formation have the best development potential. This explains the significant difference in gas production capabilities across the Shahezi Formation tight reservoirs in the Xujiaweizi fault depression even though gas is widely distributed there.
In the case of fractured reservoirs with low porosity and high permeability, simulation results indicate high gas saturation during charging, making them favorable for the distribution of tight gas. However, whether fractures are favorable for tight gas accumulation depends on whether the fractures penetrate the reservoir. If the fractures penetrate the reservoir, natural gas migrates upward along these fractures, making it difficult to accumulate within the tight reservoir. The current exploration results indicate that the Shahezi Formation in the Xujiaweizi fault depression has great hydrocarbon generation intensity, but the scale of gas reservoirs is relatively small. In contrast, huge tight gas fields have formed in the Ordos Basin, which lies on a stable craton. Fracture-induced gas loss may be a significant cause. When fractures do not penetrate the reservoir, their presence widens the charging area, allowing more gas charging per unit time. In this case, a gas saturation stabilization zone forms rapidly. This phenomenon is also observed in the Xujiahe Formation of the Sichuan Basin, where numerous small fractures have created a tight gas field [28]. In addition, the tight oil physical simulation results of the sedimentary tuff samples with through and non-through fractures taken from the Santanghu Basin show that the samples with non-through fractures have higher oil saturation than those with through fractures [29]. These physical simulation results are corroborated by Lattice Boltzmann numerical simulations [30].
4.3. Impact of charging time on tight gas charging and accumulation
Physical simulation results show that permeability is the primary controlling factor of the gas content during tight gas charging and accumulation (Fig. 9a2 , 9a4 ). However, numerical simulation results indicate that porosity is the primary factor governing the gas content during this process (Fig. 9b1 , 9b3 ). This disparity may be attributed to the differences in the underground charging and accumulation time of tight gas and the charging and accumulation time during physical simulations. Under laboratory conditions, constrained by sample size and time limitations, natural gas flows through dominant pathways in the rock. After connected dominant channels are formed, the gas flow is not significantly affected, even if there are mobile fluids remaining in the rock. As a result, the final gas charging volume is mainly controlled by rock permeability. Under underground conditions, however, tight gas charging time is long, so natural gas has ample time to displace the formation fluid. Thus, the free water in the rocks can be completely displaced out as long as there is good gas source condition, sufficient gas supply and large charging pressure difference. As a result, the final gas content after charging and accumulation is primarily governed by rock porosity.
According to actual exploration results, volcanic reservoirs in the Yingcheng Formation are the important for deep-seated natural gas accumulation in the Xujiaweizi fault depression [10]. The test results of the volcanic rock samples show high porosity and low permeability, while the physically simulated final gas saturation is not high. From the perspective of physical simulation, the gas accumulation scale in this type of reservoirs is limited. However, practical development outcomes demonstrate that the volcanic rock gas reservoirs of the Yingcheng Formation are the most productive ones in the region. Centrifuge-NMR experiments indicate high free water porosity of these reservoirs. This suggests that, for the volcanic reservoirs with high porosity, natural gas migrates slowly within the rock due to lower permeability. This leads to a longer charging time, enabling the efficient displacement of free water from the reservoir. The gas saturation is not high, but the gas-bearing porosity is relatively high (Fig. 9b3 ), which results in a substantial volume of accumulated natural gas.
5. Conclusions
In this study, a mathematical model was established for the charging and accumulation of tight gas, shedding light on the underlying mechanism of this process. During natural gas charging into tight rocks, a gas saturation stabilization zone is formed near the source-reservoir interface. In cases of insufficient gas supply, a gas saturation reduction zone and an uncharged zone form successively, starting from the source-reservoir interface. The "sweet spot" for tight gas accumulation typically develops in high-quality reservoirs located near source rocks, corresponding to the gas saturation stabilization zone.
Laboratory physical simulation can unveil the mechanism of tight gas charging and accumulation. However, this mechanism should not be considered as the criterion for judging the outcomes of underground tight gas charging and accumulation. Under laboratory conditions, the small sample size and short charging time allow natural gas to easily flow through dominant pathways within rocks. As a result, the gas saturation/gas content is primarily controlled by rock permeability. Under geological conditions, natural gas has ample time to displace free water from the rock. Thus, the gas content after charging and accumulation is primarily governed by rock porosity.
The findings explain the gas and water distribution and production patterns in the deep reservoirs of the Xujiaweizi fault depression and in the Linxing-Huangfu tight gas region of the Ordos Basin, guiding future exploration directions. The Shahezi Formation sandy conglomerates in the Xujiaweizi fault depression are located close to the source rock, where ample gas supply and large charging pressure difference during gas charging and accumulation lead to the formation of gas saturation stabilization zone. The heterogeneous distribution of the gas layer is primarily controlled by reservoir quality. On the other hand, the volcanic rocks of the Yingcheng Formation are far from the source rocks of the Shahezi Formation. When natural gas enters fractures through fault zone, the charging pressure difference drops sharply, creating a gas saturation reduction zone where absorbed water, free water, and natural gas coexist, as well as an uncharged zone consisting solely of water. Therefore, in the later stages of development, the Shahezi Formation tight gas reservoirs do not produce water, whereas the Yingcheng Formation tight gas reservoirs do. In the Linxing-Huangfu tight gas reservoirs of the Ordos Basin, the distribution of gas and water is mainly determined by source rock conditions. In the central area of Linxing, there are relatively good gas sources and significant charging pressure difference, so a gas saturation stabilization zone develops near the source rocks, and a gas saturation reduction zone forms far from the source rocks through tight gas charging and accumulation. In the Huangfu region, where gas source conditions are less favorable and the charging pressure difference is small, a gas saturation reduction zone forms near the source rocks, and no gas charging and accumulation occurs in the tight sandstone reservoirs located away from the source rocks.
Acknowledgement
Thanks for the financial support of the "Academicians Jia Chengzao and Yang Shufeng Workstation in Hainan Province".
Nomenclature
A—gas charging area, m2;
h1—thickness of gas saturation stabilization zone, m;
h2—thickness of gas saturation reduction zone, m;
Δh—unit thickness of the gas saturation stabilization zone divided into m parts, m;
H—thickness of tight gas charging and accumulation, m;
Hs—thickness of source rock, m;
Lx—the length of the position x on the rock core from the inlet end, mm;
L—core length, mm;
m—the quantity of equal parts of h2;
n—mass of substance, mol;
p1—pressure at the inlet end of the core, MPa;
p2—pressure at the outlet end of the core, MPa;
pfw, max—capillary resistance corresponding to the minimum pore size rfw,min with free water, MPa;
pfw, min—capillary resistance corresponding to the maximum pore size rfw,max with free water, MPa;
pg1—nitrogen charging pressure difference under laboratory conditions, MPa;
pg2—methane injection pressure difference under geological conditions, MPa;
pi—the charging pressure difference when gas enters into the i-th Δh of a tight reservoir, i=1, 2,..., m, MPa;
pg—charging pressure difference, MPa;
pHg—mercury injected pressure, MPa;
ph—formation’s hydrostatic pressure, MPa;
pL—median pressure difference, which is the pressure difference when the movable water saturation reaches half of Sfw, MPa;
pr—capillary resistance, MPa;
Δp—centrifugal pressure difference, MPa;
px—charging pressure difference at position x on the rock core, MPa;
r1, r2—the minimum pore sizes at which the charging pressure difference can displace the free water at a certain time during the tight gas charging process, μm;
rbw,max—the maximum pore size with absorbed water in rocks, μm;
rbw,min—the minimum pore size with absorbed water in rocks, which usually equals to the minimum pore radius, μm;
rfw,max—maximum pore size with free water in rocks, which usually equals to the maximum pore radius, μm;
rfw,min—the minimum pore size with free water in rocks, μm;
rg—pore radius of free water that can be displaced under the condition of charging pressure difference pg, μm;
rfw,j—the minimum pore size with free water when tight gas charging to j position that charging pressure difference can displace the free water in tight reservoir, μm;
rmax—maximum pore radius in rock, μm;
rmin—minimum pore radius in rock, μm;
r—pore radius, μm;
R—gas constant, 8.314 J/(K∙mol);
Sbw—absorbed water saturation, %;
Sfw—free water saturation, %;
Sg—gas saturation, %;
Sg,i—gas saturation when gas is charged into the i-th △h of the tight reservoir, i=1, 2,…, m, %;
Sm—movable water proportion, %;
T—formation temperature, K;
T2—transverse relaxation time, ms;
V0—gas expulsion rate per unit mass of source rock, cm3/g;
Vg—gas expulsion volume of source rock under geological conditions, cm3;
Vm—molar volume, 22.4 L/mol;
Z—compressibility factor;
θ—wetting angle, (°);
ρs—source rock density, taken as 2.6 g/cm3;
σ—interface tension, N/m2;
ϕ—porosity, %;
ϕa—porosity measured by conventional gas test, %;
ϕbw, r—porosity component occupied by absorbed water with pore radius r, %;
ϕbw—porosity occupied by absorbed water in rocks, %;
ϕb—porosity measured though saturated water sample by nuclear magnetic resonance experiment, %;
ϕfw, r—porosity component occupied by free water with pore radius r, %;
ϕfw—porosity occupied by free water, %.