

Introduction
Since the beginning of the 21st century, the successful development of marine shale oil and gas reserves in the United States has greatly contributed to the attainment of energy independence of the country. The evolution of shale oil development techniques has witnessed the progression from fracturing in vertical wells to intensively-staged fracturing in long horizontal wells, and eventually the factory-like volume fracturing in cluster wells, resulting in a continuous enhancement of single well productivity[1-2]. China possesses abundant continental shale oil resources, and in recent years, has made significant breakthroughs in the exploration and development of shale oil in various regions, such as the Paleogene Kongdian Formation [3-4] and Shahejie Formation [5-6] in the Bohai Bay Basin, the Lower Permian Lucaogou Formation [7] in the Jimsar Sag and the Lower Permian Fengcheng Formation [8] in the Mahu Sag of the Junggar Basin, the Cretaceous Qingshankou Formation [9] in the Songliao Basin, and the Triassic Yanchang Formation [10] in the Ordos Basin.
In comparison with the marine shale oil in North America, the shale oil reserves in China are predominantly continental with the characteristics of rapid facies transitions, high heterogeneity, low thermal maturity, and small sweet-spot areas [10-11]. The sweet spots within the continental shale oil reservoirs of China can generally be classified into interlayer, mixed, and shale types [11]. Currently, there is a relatively unified approach to develop small sweet-spot areas of shale oil, an integrated approach combining geological and engineering techniques is employed to enhance research on manual intervention. This involves the creation of complex fracture networks within the sweet spots, establishing artificial high-permeability zones, and implementing a "volume-based development" strategy [11]. However, varying geological conditions result in significant differences in single well productivity, necessitating further research on the development of differentiated techniques suitable for different geological conditions.
The primary focus of shale oil exploration and development in the 7th Member of the Triassic Yanchang Formation (Chang 7 Member) in the Ordos Basin is currently the interlayer shale oil. Influenced by the complex climatic and tectonic conditions of continental lake basins, the overall distribution of the reservoirs is highly heterogeneous and crude oil properties vary significantly, posing significant challenges to large-scale cost-effective development. Since 2018, a series of technological breakthroughs have been achieved in the selection and stimulation of “sweet spot” of shale oil by continuously deepening the basic geologic study on the shale oil in continental lake basins and strengthening technological research. This has resulted in the establishment of an integrated geological and engineering development technology system for the Chang 7 Member shale oil, leading to the discovery of the Qingcheng Oilfield. From 2019 to 2022, the Qingcheng Oilfield submitted cumulative proven reserves of 11.54×10⁸ t, achieving large-scale cost-effective development of the Chang 7 Member shale oil. In 2022, the annual production of the Qingcheng Oilfield reached 164×104 t. This paper systematically summarizes the technological system for the shale oil development of the Qingcheng Oilfield and its practical application achievements, focusing on comprehensive selection of shale oil sweet spots, well pattern of large- cluster wells, optimized fast drilling and completion, intensively-staged volume fracturing, and rational production system. It aims to provide insights and references for the large-scale cost-effective development of continental shale oil both domestically and internationally.
1. Geological characteristics
The Qingcheng Oilfield is located in the southwestern part of the Yishan Slope in the Ordos Basin. Driven by the tectonic subsidence of the basin and the sedimentary environmental evolution, a set of sedimentary assemblage composed of semi-deep and deep lacustrine facies mud shale and gravity flow sand body, with a total thickness of approximately 110 m, is formed in the Chang 7 Member [12]. Based on sedimentary cycles and lithological variations, the Chang 7 Member is further divided into three sub-members, namely Chang 73, Chang 72, and Chang 71 from bottom to top. The Chang 73 sub-member is primarily composed of mud shale, with interbedded thin silt-fine sandstone. The Chang 72 and Chang 71 sub-members are characterized by mud shale interbedded with fine sandstone and siltstone. The individual sandstone layers are relatively thin, ranging from 0.5 m to 3.0 m. Vertically, sand bodies vary rapidly with a certain magnitude of vertical stacking thickness. On a planar scale, multiple layers of siltstone and fine sandstone originated from sandy debris flow and turbidity currents are superimposed and connected, which are the main development targets of the current operations [13].
The reservoirs in the Chang 71 and Chang 72 sub-members are highly heterogeneous, with tight lithology and low formation pressure coefficients, yet they have advantages such as high brittleness index, high oil saturation, and favorable crude oil properties [13]. The average gas porosity is 8.8%, and the average air permeability is 0.10×10⁻³ μm2. The pores and throats have small radius, with the pore radius mainly in the range of 2 μm to 8 μm, and the throat radius in the range of 20 nm to 100 nm, constituting a micro- and nano-scale pore-throat system. However, the abundance of small-scale pores enhances the reservoir capacity. The reservoir is at the depth ranging from 1750 m to 2030 m, with formation pressures ranging from 14.7 MPa to 15.8 MPa, and pressure coefficients ranging from 0.77 to 0.82, indicating a low-pressure reservoir. Compared with low-permeability to ultra-low-permeability reservoirs, the brittleness indices are relatively high, averaging at 46.7%, which is favorable for the formation of complex fracture networks through volume fracturing in horizontal wells. The near source charging of oil and gas in the Chang 7 Member has resulted in high original oil saturation, averaging around 70%, indicating good oil-bearing properties. The initial dissolved gas/oil ratio is high, averaging at 101 m3/t, and the crude oil in the formation exhibits low viscosity, averaging at 1.35 mPa·s, which enables facile fluid flow.
2. Development history
The development of the Chang 7 Member shale oil in the Ordos Basin has gone through four stages: exploration and discovery, evaluation and exploration, pilot development, and large-scale development. Over time, the main technologies and management models have gradually matured.
(1) Before 2011, the stage of exploration and discovery. Prior to 2004, the Chang 7 Member in the Ordos Basin was primarily studied as the hydrocarbon source rock. Wells such as Zhuang 9 and Gu 3 encountered oil shows, and locally developed sand bodies were discovered in the center of the lake basin. From 2004 to 2010, the research focused on the theory of sand-rich deposits of deepwater gravity flow. Through large-scale exploration with wide well spacing, it was realized that there were large-scale reservoirs formed in the central lake basin. Due to technological limitations, however, these reservoir zones could not be effectively utilized.
(2) From 2011 to 2013, the stage of evaluation and exploration. Experiments on volume fracturing in horizontal wells were conducted in X233, Z183, and N89 areas. A total of 25 horizontal wells were tested, with the length of the horizontal section averaging 1560 m and well spacing ranging from 600 m to 1000 m. The average cumulative oil production in the first year reached 3970 t per well, surpassing single well productivity expectations. It was determined that staged multi-cluster volume fracturing in horizontal wells is the main approach for shale oil development.
(3) From 2014 to 2017, the stage of pilot development. The pilot development was sequentially carried out in X233 and Z183 areas, involving the water injection development by short horizontal wells in five-spot or seven-spot pattern (the length of horizontal sections ranged from 600 m to 1000 m and the well spacing was between 500 m and 600 m) and the natural energy development by long horizontal wells with long well spacing (the length of horizontal sections ranged from 1500 m to 2700 m and the well spacing was between 600 m and 1000 m). Due to tight reservoirs, however, the water injection development in horizontal wells faced challenges in establishing an effective pressure displacement system, resulting in difficult response to water injection. Furthermore, communicated fractures led to a higher risk of water breakthrough with a probability exceeding 45%. The natural energy development by long horizontal wells with long well spacing resulted in low oil recovery rates and low reserve utilization degree, preventing large-scale cost-effective development.
(4) Since 2018, the stage of large-scale development. Crucial techniques such as long horizontal well, short well spacing, 3D well deployment of large-cluster well, and intensively-staged volume fracturing in horizontal wells, and the associated production organization and management modes are employed, and consequently large-scale cost-effective development of the Chang 7 Member shale oil reservoirs has been realized in the Changqing Oilfield.
3. Principal development technology
3.1. Sweet-spot evaluation and selection technology
The "sweet spot" of shale oil refers to the favorable reservoirs that are rich in oil, possess superior physical properties, are more amenable to stimulation, and demonstrate commercial development value under existing economic and technological conditions [11]. Given the extremely tight nature of shale oil reservoirs, the mobility of reservoir energy and fluids also becomes a crucial factor to be considered while selecting the "sweet spots" of shale oil. It is imperative to comprehensively take into account both the geological characteristics (such as sand body structure, reservoir properties, and fluid properties) and the engineering characteristics (e.g. fracability).
The shale oil strata of the Chang 7 Member in the Ordos Basin consists of sandstone interbedded with mudstone, with multiple oil-bearing sand bodies developed vertically. These sand bodies exhibit rapid variations both longitudinally and horizontally. Furthermore, there are notable differences in the properties of reservoir fluids, with a dissolved gas/oil ratio ranging from 60 m3/t to 120 m3/t and a crude oil viscosity between 1 mPa·s and 3 mPa·s. To establish a geological foundation for the large-scale cost-effective development of shale oil in the basin, comprehensive analyses of geological, seismic, and well logging data are required to conduct multidimensional evaluation and selection of the reservoirs in terms of their planar, vertical and horizontal sections. This process can optimize the planar well patterns, well trajectory designs for vertical drilling of horizontal wells, and the selection of perforated intervals within the horizontal sections. Focuses may vary slightly in different dimensions: the evaluation of planar sections emphasizes the average quality of the blocks, such as fluid properties, distribution patterns of sand bodies, and reservoir properties and fracability; the evaluation of vertical sections emphasizes the physical and oil-bearing properties of the target reservoir; and the evaluation of horizontal section emphasizes the spatial positioning of the trajectories within the geological body, with an aim to select high- quality reservoir members in a three-dimensional space.
3.1.1. Selection of "sweet spots" in the planar section
The selection of "sweet spots" in the planar section involves a combination of qualitative screening at the regional level and quantitative evaluation within the target areas.
Firstly, based on well-seismic data, the stratigraphic structural pattern in the Longdong area of the Ordos Basin was identified as "progradation and non-uniform thickness" In the meanwhile, through the restoration of the bottom paleo-structure of the Chang 7 Member using 3D seismic data, we found that the basin floor in the Longdong area has a distribution pattern of "three-level steep slope zones + three-level slope foot zones." In the steep slope zones, the average thickness of the sand bodies is 4.6 m, with a composition of thin sandstone-mudstone interbeds. The thickness of the barriers between the major oil-bearing layers is mostly over 20.0 m. In the slope foot zones, the average thickness of the sand bodies is 18.3 m, characterized by multiple-period sand superposition and a thick-layered structure. These areas are considered as favorable "sweet spots" where multiple sand bodies are frequently stacked in the vertical direction, with stable argillaceous barriers ranging from 6-15 m in thickness between the major oil-bearing intervals.
Furthermore, a quantitative evaluation of the target areas for "sweet spots" was conducted, taking into account hydrocarbon generation characteristics, sand body structure, reservoir properties, and fluid properties. Through data analysis methods such as Pearson correlation coefficient and grey relational analysis, we found that the quality of shale oil "sweet spots" is influenced by their oil-bearing capacity and fluid properties jointly. The production controlling factors were quantitatively ranked as porosity, oil saturation, crude oil viscosity (gas/oil ratio), and oil layer thickness. By analyzing the frequency distribution of different oil-bearing rock samples, the relationship between fluid properties and production, and other factors, we delineated the classification boundaries for parameters such as porosity, oil saturation, and fluid properties. In addition to the conventional factors of sand body structure, oil saturation, and thickness, key parameters such as viscosity, gas/oil ratio, and brittleness index were also used to develop and refine the classification and evaluation criteria for shale oil reservoirs (refer to Table 1 ). Based on these criteria, the well pattern was optimized for the proved, controlled and predicted reserves in the Qingcheng Oilfield (Fig. 1 ).
Table 1. Comprehensive evaluation criteria for Chang 7 Member shale oil reservoirs in Qingcheng Oilfield |
| Category | Hydrocarbon generation intensity | Sedimentary characteristics | Oil-bearing capacity | Fluid properties | Fracability | |||||
|---|---|---|---|---|---|---|---|---|---|---|
| Shale thickness/ m | Bottom shape of lake basin | Sedimentary mechanism | Sand body structure | Target layer thickness/ m | Poro- sity/% | Oil saturation/ % | Gas/oil ratio/ (m3·t-1) | Crude oil viscosity/ (mPa•s) | Shale brittleness index/% | |
| I | ≥15 | Slope foot zone | Sandy debris flow | Thick-layer multi- bed stacking | ≥10 | ≥10 | ≥55 | ≥100 | ≤1.5 | ≥45 |
| II1 | 10-15 | Slope foot zone+ Steep-slope zone | Sandy debris flow or turbidity currents | Thick sandstone and thin sand-mud interbedded type | 6-10 | 7-10 | 45-55 | 70-100 | 1.5-2.5 | 40-45 |
| II2 | 10-15 | Slope foot zone+ Steep-slope zone | Sandy debris flow or turbidity currents | Thin sand-mud interbedded type | 4-6 | <7 | 40-50 | 60-80 | 1.5-2.5 | <40 |
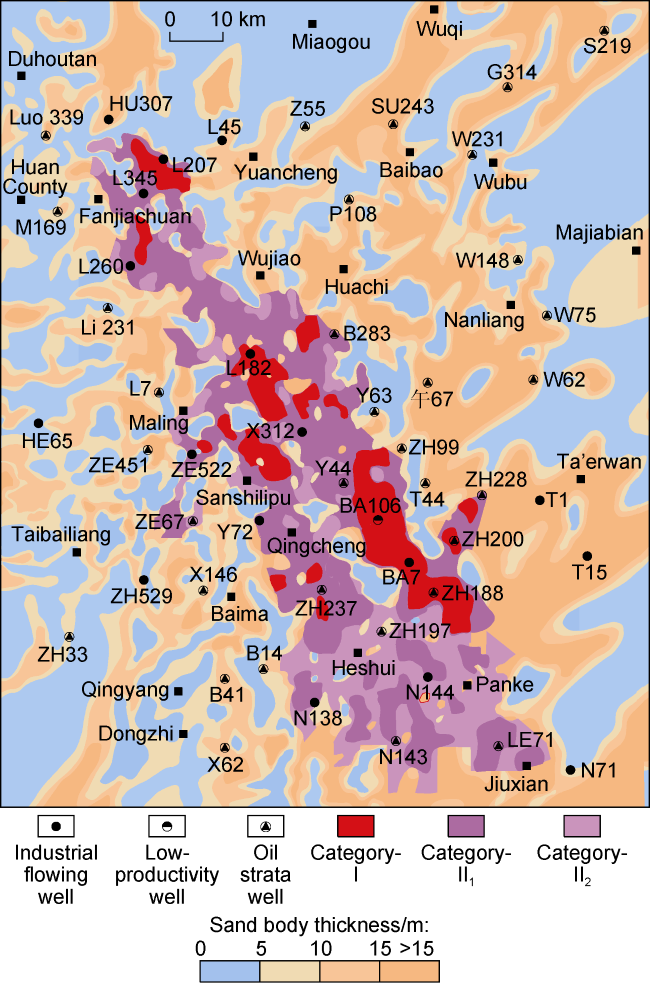
Fig. 1. Classification of Chang 71 shale oil reservoirs in Qincheng Oilfield. |
3.1.2. Selection of "sweet spots" in the vertical section
Based on the selection of "sweet spots" in the planar section, the vertical selection focuses on optimizing the design of horizontal well trajectories through detailed stratigraphic correlation and the selection of major contributing layers.
The first step is to conduct a detailed stratigraphic correlation. Based on the understanding of the "progradation and non-uniform thickness" depositional model of the Chang 7 Member in the Qingcheng Oilfield, as well as the seismic data advantage in determining structures laterally and the high accuracy advantage of logging data vertically, the upper and lower boundaries of the Chang 7 Member were defined according to the trend of 3D seismic event at the top and bottom of Chang 7 Member; small layers were subdivided based on the sedimentary cycles reflected in the well logging curves. That is, the 3D seismic data is used to define major layers and the well logging information based sedimentary cycle is used to identify smaller layers. Thus, a fine depositional stratigraphic framework was established.
Subsequently, an in-depth evaluation of the main contributing layers in the vertical direction was carried out. Based on an understanding of production controlling factors and the core observations and test analyses of skeletal well, a quantitative evaluation equation for the "sweet spots" was established using parameters such as porosity, oil saturation, and shale content (Eq. (1)), and the accuracy of this equation was verified and calibrated based on nuclear magnetic resonance logging and imaging logging results. With Well H6-1 as an example, its longitudinal interpretation and assessment results are illustrated in Fig. 2 . The lower section of Chang 712-2 has a higher evaluation grading index and is identified as the main contributing layer in the vertical direction.
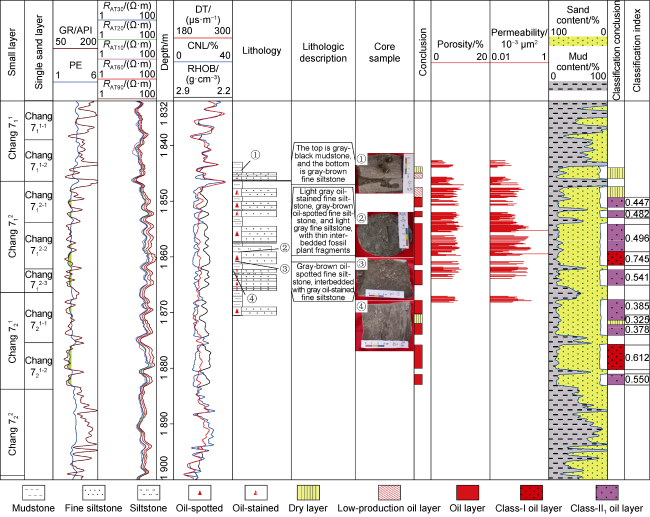
Fig. 2. Detailed interpretation for Well H6-1 in Chang 7 Member. |
Based on the selection of vertical "sweet spots," and considering the rapid lateral and vertical variations as well as the presence of numerous barriers and interbeds in shale oil reservoirs, 3D seismic spectral decomposition and high-precision 3D geological modeling techniques were employed to precisely characterize the inter-well microstructures and the distribution of thin reservoirs in 3D space, so as to optimize the design of horizontal well trajectories. During the drilling process, real-time data was utilized to update the 3D seismic and geological models, thus optimizing the horizontal well trajectories. Furthermore, for the platforms with less well control and faster changes in reservoir/structures, different types of steering tools such as rotary steering and azimuthal gamma were selected to assist in adjustments. This approach ensures a success rate of over 80% in drillng oil-bearing layers, with a success rate of over 60% in drilling high-quality oil layers.
3.1.3. Selection of "sweet spots" in the horizontal section
The test of horizontal wells production indicates that high-quality oil-bearing layers (classified as Type A) play a predominant role in determining the single well productivity (Fig. 3 ), contributing to over 77% of the total output. Based on this understanding, and considering the great lateral heterogeneity of the oil layers encountered in the horizontal section, we analyzed the production-controlling factors and incorporated the parameter distribution characteristics of high-production, medium-production, and low-production wells. Consequently, we established a zoning and classification interpretation framework for the oil layers in the horizontal section based on seven key parameters (Table 2 ).
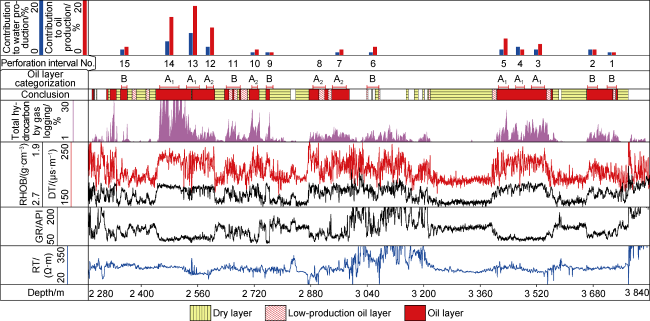
Fig. 3. Tracer test results for Well HH21-4. |
Table 2. Classification evaluation criteria for oil layers in the horizontal section |
| Region | Classification | GR/ API | Interval transit time/(μs·m-1) | Density/ (g·m-3) | True formation resistivity/(Ω·m) | Total hydrocarbon by gas logging/% | Minimum horizontal principal stress/MPa | Brittleness index/% |
|---|---|---|---|---|---|---|---|---|
| A1 | <90 | >215 | <2.51 | >50 | >10 | <30 | >50 | |
| X233 | A2 | <95 | 210-220 | 2.51-2.56 | 40-90 | 6-10 | 30-34 | 40-50 |
| B | <105 | 200-210 | 2.56-2.60 | 40-90 | 2-6 | >34 | <40 | |
| A1 | <95 | >215 | <2.51 | >90 | >10 | <30 | >50 | |
| Z183 | A2 | <100 | 205-215 | 2.51-2.55 | 50-200 | 6-10 | 30-34 | 40-50 |
| B | <105 | 200-205 | 2.55-2.60 | 50-200 | 2-6 | >34 | <40 |
Based on the evaluation of oil layers in the horizontal section, precise identification of the "sweet spots" in this section was achieved using 3D seismic and geological modeling techniques. This information guides the selection of perforating intervals and the differentiated design of hydraulic fracturing programs. (1) Identification of fault and fracture distribution is crucial. Avoiding areas near faults or fracture zones reduces the risk of uncontrollable vertical fracture height or interference between adjacent wells. (2) Selecting high-quality "sweet spot" intervals in the horizontal section and adjacent hidden "sweet spots" in favorable reservoir layers as the targets for perforation and subsequent hydraulic fracturing. Types A1 and A2 oil-bearing layers undergo thorough fracturing, with uniform and dense fracture distribution, while Type B oil-bearing layers undergo moderate fracturing, with precise fracturing operations to control cost. (3) The precise spatial positioning of the horizontal wellbore within the target reservoir zone provides a precise guidance for directional perforating, and the overall distribution of the "sweet spots" in the horizontal section serves as the basis for differentiating and optimizing parameters such as the fluid injection volume and sand injection in the hydraulic fracturing design.
3.2. Differentiated 3D well patterns
Considering the geological characteristics of the Chang 7 Member shale oil reservoirs in the Qingcheng Oilfield, such as the relatively small and rapidly changing planar extent and the development of multiple sets of oil-bearing layers in the vertical direction, combined with the constraints of well site area imposed by the hilly terrain and gullies of the Loess Plateau in the Ordos Basin, a differentiated well pattern strategy was proposed. This strategy follows the principles of technological compatibility, long-term development benefits, efficient utilization of multiple oil-bearing layers within a primary well pattern, reasonable reservoir control through single well productivity, and differentiated reservoir stimulation. Based on technical and economic considerations, well pattern parameters such as the orientation and length of the horizontal sections, well spacing, and the number of wells in each platform were optimized. Four different well patterns were proposed, tailored to different geological and surface conditions.
3.2.1. Optimization of well pattern parameters
3.2.1.1. Orientation of the horizontal section
Numerical simulations and field practices have shown that when the orientation of the horizontal section is perpendicular to the direction of maximum principal stress, the volume of the fracturing network is maximized, resulting in the highest well productivity. A comparative analysis of downhole micro seismic monitoring data reveals that the stimulated reservoir volume is smaller in a well with a small included angle (less than 90°) between the orientation of the horizontal section and the maximum principal stress direction than that in a conventional well where the horizontal section is perpendicular to the maximum principal stress direction. However, the density of micro seismic signals near the wellbore is higher, and the complexity of the generated fractures is increased. In general, therefore, the orientation of the horizontal section should be perpendicular to the maximum principal stress direction. In the areas near sand bodies or with limited reserves due to geological features or terrain constraints, it is favorable to initially deploy the horizontal sections following the sand body distribution direction to improve the success rate of drilling oil layers. Subsequently, the included angle between the orientation of horizontal section and the maximum principal stress direction should be considered.
3.2.1.2. Length of the horizontal section
The length of the horizontal section needs to be optimized, taking into factors such as oil layer drilling rate, single well controlled reserve, technological adaptability, and cost effectiveness. In the case of the Chang 7 Member shale oil reservoirs in the Qingcheng Oilfield, which have a small and rapidly changing planar extent, the design of the horizontal section length should primarily focus on penetrating a single sand body, so as to improve the success rate of drilling oil layers, especially high-quality oil layers. Based on the vertical development stages and sedimentary microfacies of the sand bodies, as well as the analysis of actual drilling characteristics of horizontal wells, the morphology and quantitative characteristics of individual sand bodies were examined. It is found that the distribution range of individual sand bodies varies significantly, with thicknesses ranging from 2 m to 10 m and widths spanning from 500 m to 3380 m. Numerical simulations and field statistics have shown that longer horizontal sections result in higher single well productivity. However, beyond the length of 1500 m, there is a noticeable increase in the average drilling cycle, average drilling trips, and ineffective drilling footage encountered in the horizontal wells. Additionally, the increase in single well productivity does not match the corresponding increase in wellbore investment (Fig. 4 ), and there is a substantial rise in maintenance and cleanout frequency in the later stages. A differentiated design approach is adopted for the length of the horizontal sections based on factors such as the length of the individual sand body, the relationship between investment and production increments, and the difficulty of later-stage maintenance measures. In the areas with stable oil reservoir distribution, the optimal length of the horizontal section is around 1500 m. In the areas where the extension length of the sand body is short (less than 800 m), the length of the horizontal section ranges from 600 m to 800 m. In the areas with stable oil layer distribution but difficult to produce due to topography or terrain, the length of the horizontal section exceeds 2000 m to maximize the utilization of the reserves.
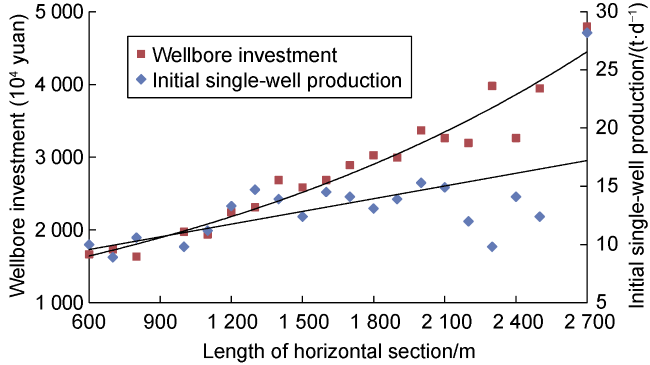
Fig. 4. Correlation between drilling investment of different horizontal section lengths and single well production. |
3.2.1.3. Well spacing
Well spacing is a key optimization target for shale oil reservoirs when it comes to the development based on natural energy after volume fracturing. Its main objective is to match the length of the fracture. A shorter well spacing is advantageous for increasing oil recovery rate, but a single well can control only a small amount of reserve and it will cause more channeling well intervals, a limited stimulation potential of volume fracturing, and a significant production decline in the later stages. On the other hand, although a longer well spacing allows for higher single well controlled reserve, it will result in a lower oil recovery rate, inefficient recovery of reserves in the inter-well matrix, restrictions on platform well combinations, and higher development costs. Therefore, well spacing optimization should aim to maximize recoverable reserves, recovery factor, and economic benefits. This optimization should consider fracture length and matrix range to strike a balance between technology and economy of geology-engineering integration.
Firstly, the minimum well spacing was determined using the economic limit method. The economic limit well spacing per well corresponding to the cumulative oil production per well at economic limit can be obtained using the OOIP calculation formula of volume method and based on the calculations of cumulative oil production per well at the economic limit under different investments and oil prices, combined with the production and investment situation of the developed blocks, as well as the relationships between cumulative oil production, recovery rate, and controlled reserves per well, and the relationships between controlled reserves per well and well spacing and horizontal section length. Using this method, a graph illustrating the relationship between recovery rate and economic limit well spacing per well for different oil layer thicknesses was calculated (Fig. 5 ). Based on shale oil development practices in the Qingcheng Oilfield, with a predicted recovery rate of 10% and the current oil layer utilization thicknesses ranging from 8 m to 10 m, the economic limit well spacing per well at tiered oil price can be determined to fall within the range of 280 m to 350 m, as shown by Fig. 5 .

Fig. 5. Relationship between recovery rate and economic limit well spacing per well. |
Next, the maximum well spacing was determined based on reservoir engineering principles. To identify the maximum well spacing for horizontal wells, it is necessary to determine the effective half length of hydraulic fracture and the maximum flow distance in matrix. Based on downhole micro seismic monitoring, calibration was carried out by using a zonal flow model and fitting production data of horizontal well [14], and a graph illustrating the relationship between downhole fluid volume and effective fracture half-length in horizontal wells was generated (Fig. 6 ). Currently, for the primary single segment of the Chang 7 Member shale oil, the downhole fluid volume ranges from 1200 m3 to 1400 m3. According to Fig. 6 , the effective fracture half-length is determined to be within the range of 220 m to 230 m. In accordance with the indoors experimental analysis of start-up pressure gradient in the Ordos Basin, the relationship between start-up pressure gradient and core permeability was established. Taking into account the permeability (0.1× 10⁻³ μm2) and formation pressure difference of currently utilized reservoirs, the maximum flow distance in matrix was estimated to be around 75 m. Consequently, based on reservoir engineering methods, the maximum well spacing was determined to be approximately 600 m.
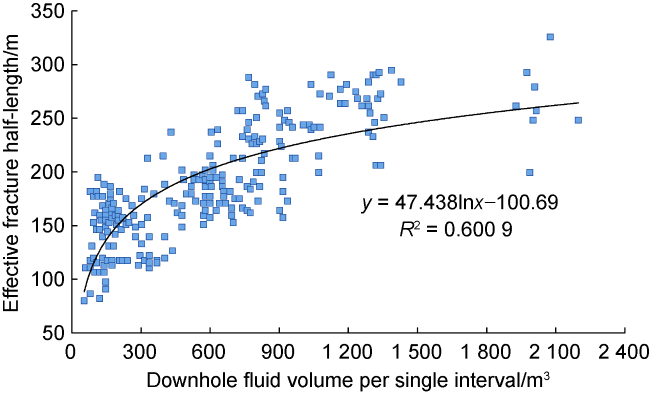
Fig. 6. Relationship between downhole fluid volume per single interval and effective fracture half-length. |
Finally, the reasonable well spacing was determined based on field practices and economic benefits. By conducting field statistics, we studied the single well controlled reserves, single-well production, and their decline patterns of horizontal wells at different well spacings. Based on actual investments, an economic evaluation was performed. The results indicate that at a well spacing of approximately 500 m, the daily oil production per single well is higher, and the decline is slower, leading to a higher internal rate of return.
A comprehensive analysis using multiple methods identified the reasonable well spacing of around 500 m. There may be some variations in well spacing depending on different oil layer thicknesses. The controlled reserves per well are estimated to be in the range of (25-30)×104 t.
3.2.1.4. Intercalation thickness in 3D development well pattern
Physical simulation experiments and simulations using Kinetix software were conducted to study the propagation of artificial fractures. The results indicate that hydraulic fractures face challenges when propagating from sandstone layers to mudstone and shale layers. As the intercalation thickness increases, the vertical extent of artificial fractures crossing the reservoir-intercalation interface decreases. When the intercalation thickness exceeds 10 m, the occurrence of vertical interlayer communication of artificial fractures becomes less likely. Pressure monitoring in adjacent directional wells during the fracturing process and post-fracturing array sonic logging in the mining field reveal that layers with mudstone intercalations thicker than 10 m exhibit weak pressure responses. The vertical extension of the artificial fractures terminates within the mudstone layer, approximately 0.5 m to 5.0 m above or below the target reservoir. The field statistical relationship of intercalation thickness in the horizontal well of 3D development platform with the initial daily oil production of the average 100-m oil layer shows that when the intercalation thickness exceeds 10 m, horizontal well is less interfered by vertically communicated fractures, leading to higher initial daily oil production in the 100-m oil layer. Considering the vertical extension of artificial fractures, a rational intercalation thickness in a 3D development well pattern should be greater than 10 m.
3.2.1.5. Number of wells deployed on the platform
Theoretically, a higher number of wells on a platform is advantageous for reducing overall land occupation, facilitating unified planning of water and electricity infrastructure, enabling drilling, fracturing, and production operations in a more standardized and efficient manner, promoting shared equipment and materials, and enhancing later production management, thereby helping reduce costs and improving efficiency. Since the commencement of large-scale development in 2018, the average number of wells on a platform has ranged from 4 to 6, with a maximum number of 31. Production practices have shown that a larger number of wells on a platform leads to a longer platform construction period, extended passive well shut-in time, and lower contribution rates from newly drilled wells in the initial year, in addition to early directional drilling orientation, longer horizontal shifts, complex wellbore trajectories, and difficulties in the oil recovery and downhole operations support. Taking into account economic and technological adaptability as well as production organization, the optimal and reasonable number of wells on a platform is typically 4 to 6 for single-layer reservoirs or multi-layer reservoirs with mudstone intercalations less than 10 m thick. For multi-layer reservoirs with mudstone intercalations thicker than 10 m, a 3D placement approach is recommended with a platform consisting of 8 to 10 wells.
3.2.2. Well patterns
For different geological and surface conditions, including a single set of oil layers, multi-set of oil layers stacked, water injection overlapping zones of Chang 6 and Chang 8 members, and difficult-to-produce areas, four well patterns have been defined (Fig. 7 ).

Fig. 7. Well pattern for the Chang 7 Member shale oil reservoirs in the Ordos Basin. |
For reservoirs characterized by the development of a single oil-bearing layer or the overlapping development of multiple oil-bearing layers with mudstone interlayers less than 10 m thick, a single-layer well system is employed. The primary length of the horizontal section is 1500 m, with a predominant well spacing of 500 m. The platform consists of a combination of 4 to 6 wells.
For reservoirs characterized by the overlapping development of multiple oil-bearing layers with mudstone interlayers greater than 10 m thick, a multi-layered spatial well system is employed. The primary length of the horizontal section is 1500 m, with a predominant well spacing of 500 m. The platform consists of a combination of 8 to 10 wells.
In areas where reservoir production is constrained due to topographical and geomorphological influences, a fan-shaped well pattern is employed to maximize reservoir recovery. The horizontal section is typically 2000 m to 4000 m in length, and its orientation is not strictly perpendicular to the maximum horizontal principal stress direction. The fan-shaped well pattern is aligned with the direction of sand body distribution, or in multiple directional angles. The predominant well spacing along the direction of sand body distribution is 500 m. In the fan-shaped well pattern, the well spacing is 150 m to 200 m near the bottom of the horizontal section, but greater than 300 m in the middle section. The platform consists of a combination of 6 to 20 wells.
In the water injection overlapping area of the Chang 6 Member and Chang 8 Member, a differentiated well pattern is employed. To avoid the impact on single-well production from vertical channeling of upper and lower layers, on the basis of optimizing the parameters of the single-layer well pattern, we adjusted the locations, patterns and fractures of Chang 7 Member shale oil wells based on the injection-production pattern in the overlapping zone to avoid upper and lower layer oil-water wells. The horizontal well segments were positioned to stay more than 100 m away from the development wells in the overlapping zone, and the distance between the hydraulic fractures and injection wells was kept at more than 50 m. Furthermore, we reduced the scale of hydraulic fracturing for precise fracturing.
By optimizing well pattern parameters and well patterns, we have achieved efficient utilization of multiple oil-bearing layers within a single well pattern. This has resulted in an increase in the reserves producing degree from 60% to 85%.
3.3. Rapid drilling and completion technology for large-cluster horizontal wells
The Loess Plateau region features complex landforms with interlaced ridges and gullies, as well as abundant water resources, farmlands, and forest conservation areas. These factors pose significant challenges to conventional horizontal well development methods. In order to effectively address the challenging issues of ground well placement and maximize reservoir utilization, we conducted research based on drilling mechanics analysis. This research focused on optimizing the trajectories of long offset three-dimensional horizontal wells and on the optimized rapid drilling of extended horizontal wells. In addition, we developed a high-strength, high-toughness cement slurry system, developing key technologies for fast drilling and completion of large-cluster of horizontal wells. With the application of these technologies, the number of platform wells, drilling speed and offsets have consistently increased, leading to significant improvements in overall performance.
3.3.1. Design of large-platform cluster wells
To address the unique topography of eastern Gansu Province, a trajectory design method based on minimizing friction torque was proposed, known as the "spatial arc + segmented design" approach. This method has led to the optimization of the wellbore profile for long-offset 3D horizontal wells. A relationship template was established between the direction of the wellfield, wellhead position, offset distance, and target point. Real-time analysis of dynamic trajectory data was conducted, and pre-distribution and obstacle avoidance techniques were used to prevent collisions [15]. The application of these techniques has greatly enhanced the design capabilities and related technical indicators of the cluster horizontal wells. The maximum number of wells on a single platform reached 31 (Fig. 8 ), and the offset distance increased from the initial design value of 302 m to 1266 m. The controlled reserves of the platform increased from 180×104 t to 1000×104 t, achieving maximized control over the geological reserves through horizontal wells.

Fig. 8. Plane deployment diagram of the HH100 platform. |
3.3.2. Efficient drilling of long horizontal wells
In order to address the challenge of strong abrasiveness and shorter footage per drill bit in shale formations, a drilling speed prediction model based on rate of penetration (ROP) was established using neural network algorithms to select drill bits (Fig. 9 ). The establishment of this model consisted of three steps. Step 1, the preparation of fundamental data, which primarily involved engineering parameters, log interpretation data, and well logging data of adjacent wells. Step 2, the processing of the fundamental data, which started with noise reduction and outlier handling by eliminating abnormal and duplicate values caused by abrupt variations in construction conditions. Missing data was then filled using the interpolation method, followed by normalization (0, 1) to achieve standardized measurement scales for different types of data. Additionally, the Spearman correlation coefficient was further used to perform principal component analysis on the data, selecting parameter categories relevant to drilling time. This marks the completion of the data processing stage. Step 3, the high-quality data obtained earlier categorized into three types: reservoir parameters, construction parameters, and drill bit parameters, for simulation training, ultimately establishing the drilling speed prediction model. By inputting the trajectory design and reservoir parameters of the target well into this model, optimal drill bit recommendations can be obtained. For the optimization of bottom hole assembly (BHA), statistical analysis of the cycles of completed wells on site was conducted to establish a well drilling learning curve (Fig. 10 ). As for the wells with better drilling indicators, we analyzed the characteristics of the BHAs for multiple drilling cycles in the same region, and established a recommended BHA template applicable to shale oil. The recommended BHA for the horizontal section is as follows: 215.9 mm CZS1653B drill bit + 1.25° single bend PDM + 210 mm spiral stabilizer + NC46 check valve + downhole measurement while drilling tool + transition joint + inclined weighting drill pipe (120 m) + hydraulic oscillator + drill pipe to the wellhead.
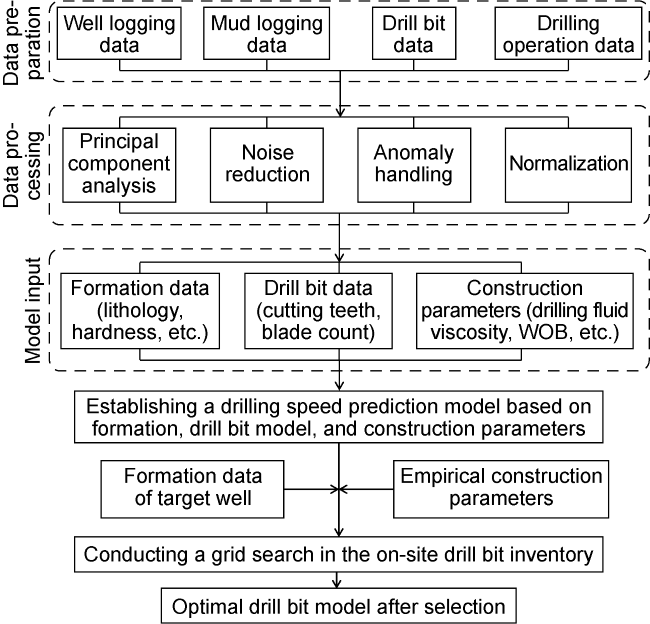
Fig. 9. Technology roadmap for intelligent drill bit selection model. |
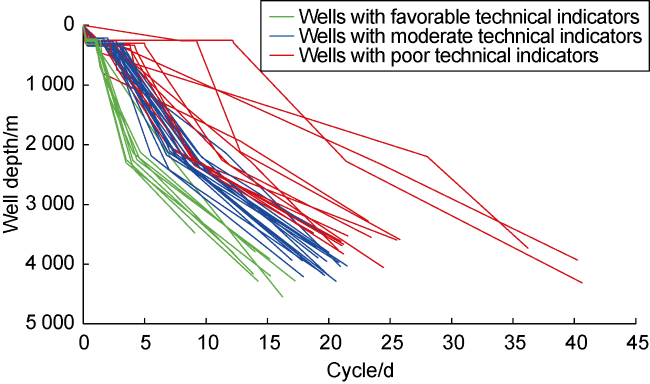
Fig. 10. Learning curve of horizontal well drilling with a 1500 m horizontal section in shale oil. |
By using the aforementioned technologies on a larger scale, the average ROP of drill bits in the horizontal sections increased by 10%. The drilling cycle for the 1500 m horizontal section was reduced from initial 29.1 d to 17.8 d. The one-trip drilling ratio of the horizontal section increased from 35.1% to 54.9%. Notably, the drilling cycle for the 1500 m horizontal section of Well HH44-3 is merely 8.5 d.
3.3.3. High-strength and high-toughness cement slurry system
The quality of cementing in horizontal wells plays a crucial role in enhancing the effectiveness of staged volume fracturing. By selecting cement additives for enhancing toughness and strength, and optimizing the formulation of the cement slurry system, we developed a high-strength and high-toughness cement slurry system. Compared with conventional low fluid loss cement slurries and tough cement slurries, this system has several improvements. The API fluid loss of the system is less than 30 mL, which has increased by 40%. The compressive strength of the set cement exceeds 45 MPa at 55 °C, which has increased by a 40%. The elastic modulus is less than 7 MPa, marking a 30% decrease. At 80 °C and 30 MPa, the thickening time range extended from 120-130 min to 90-300 min. The qualification rate of cementing quality in the horizontal section increased from the initial 75% to 81.1%.
3.4. Intensively-staged volume fracturing technology
Due to the poor fluid mobility of unconventional reservoirs, the staged volume fracturing in horizontal well serves as the primary technology for efficient development of low-permeability to tight reservoirs, both domestically and internationally. The core concept is to "break" the reservoir through volume fracturing, achieving 3D "transformation" in the directions of length, width, and height. This maximizes the contact area between fracture surfaces and reservoir matrix, thus minimizing the flow distance of oil and gas from the matrix to the fractures at any direction, and thereby greatly enhancing the overall permeability of the reservoir [16]. Years of research and field practice have shown that the Chang 7 Member shale oil reservoirs in the Ordos Basin is highly heterogeneous with a relatively low development degree of natural micro fractures, which makes it more difficult to create complex fracture networks using a stimulation model with a long spacing and higher fracturing fluid rate. Therefore, improving artificial fracture control through high-density intensively-staged to reduce the fracture spacing is a realistic approach towards increasing single well productivity and cumulative production of shale oil.
3.4.1. Characteristics of hydraulic fractures
Understanding the characteristics of hydraulic fractures is essential for volume fracturing designs. The hydraulic fracture characteristics of the Chang 7 Member oil shale in the Ordos Basin were studied through large-scale physical modeling experiments, observation of core samples from horizontal observation wells, and analysis of micro seismic frequency and magnitudes. Four natural outcrop shale samples measuring 1 m×1 m×1 m (with varying development degrees of micro fractures and of structural weak planes) were collected. Large-scale physical modeling experiments were conducted using slick water with a viscosity of 3-5 mPa·s, with equal horizontal principal stresses applied to the rock samples. After the experiments, complex fractures were observed in the rock cores with developed micro fractures, while single main fractures were observed in the cores without developed micro fractures. A vertical well with high-rate fracturing was selected (rate: 6.0 m3/min, total fluid injection: 630 m3). Within the micro seismic monitoring zone (fracture zone length: 310 m, width: 80 m) located 50 m to the east of the fracturing well in the direction perpendicular to the maximum horizontal principal stress (i.e., perpendicular to the vertical hydraulic fracture), a horizontal well was deployed for coring, with an 80 m long coring section, matching the width of the micro seismic zone. Three artificial fractures were observed in the core samples, which are concentrated within a 10 m range in the direction perpendicular to the maximum horizontal principal stress, with significantly smaller overall influence extent compared with the zone width observed by the micro seismic monitoring. Due to the considerable difference between the zone width observed by micro seismic monitoring and the actual core observation, the Gutenberg-Richter empirical equation (Eq. (2)) was used to calculate the relationship between micro seismic frequency and magnitudes based on the micro seismic monitoring results [17⇓-19]. When the b-value is between 1.5 and 2.0, it primarily indicates a response to hydraulic fracturing, while a b-value less than 1.5 and closer to 1.0 indicates a greater activation of natural fractures and a higher overall complexity. Statistical analysis of micro seismic events from shale oil volume fracturing indicated that 60% to 70% of the well sections had b-value above 1.5, indicating a fracture system dominated by the main artificial fractures with secondary branch fractures and micro fractures. Further increasing the density of artificial fractures is necessary to enhance fracture control.
3.4.2. Intensively-staged fracture design
The spacing between artificial fracture segments and between clusters in shale oil horizontal wells are crucial factors impacting the effectiveness and operational costs of hydraulic fracturing. Decreasing the perforation density and increasing the fracture spacing result in less interference between fractures, leading to prominent main fractures and superior single-fracture creation. However, this approach fails to meet the requirements of maximizing control over the reservoir through fractures. On the other hand, increasing the perforation density and shortening the fracture spacing increases the complexity of multi-cluster fractures and enhances the contact area with the reservoir. Nevertheless, this approach significantly escalates operational costs. To strike a balance between maximizing the transformation of good-quality "sweet spots" and controlling fracturing costs, a differentiated fracturing strategy is established based on the evaluation of the contributions of different "sweet spots" using previous tracer tests (lasting up to 1.5 years), combined with the classification and grading of the reservoir. For A1 and A2 reservoirs, sufficient transformation is pursued with a well-distributed dense fracture network. As for B-class reservoirs, a moderate transformation is conducted with precisely placed fractures to control fracturing costs. To simulate the process of fracture propagation, a complex fracture network model is established for the Chang 7 shale oil reservoir. This model comprehensively considers reservoir heterogeneity, stress anisotropy, the interaction between hydraulic fractures and natural fractures, as well as the interaction between hydraulic fractures (stress shadow effect). By simulating the multi-cluster fracture propagation under different fracture spacing in the horizontal section of 50 m long (Fig. 11 ), the results indicate that the stress shadow effect is minimal when the spacing is 20 m or 15 m, with hydraulic fractures propagating independently. However, at 10-m and 5-m spacing, the stress shadow effect has some impact on fracture propagation, resulting in curvature or limited propagation of certain fractures and an increase in overall fracture complexity and extension length. At 2.5-m spacing, intense competition among hydraulic fractures hampers the propagation of many fractures, leading to a smaller range of fracture transformation. Based on the simulation of multi-cluster fracture propagation with different fracture spacing, the production of each scheme is calculated using reservoir numerical simulation software. The results indicate that optimal oil recovery rate and estimated ultimate reserve (EUR) per well are achieved when the fracture spacing ranges from 5 m to 10 m. Therefore, the fracture cluster spacing for the Chang 7 shale oil is designed to be between 5 m and 10 m, while the segment spacing is designed with consideration of the safe operational distance for casing isolation, with a lower limit generally around 18 m. The upper limit is determined by taking into account the encountered "sweet spots" and cementing quality.

Fig. 11. Simulation results of multi-cluster fracture propagation with different spacings. |
3.4.3. Efficient volume fracturing process
To realize a balance between fracturing efficiency and operational costs, an efficient volume fracturing process is developed based on the design of intensively-staged artificial fractures in long horizontal sections. This process primarily involves "multi-cluster perforating for closely spaced fractures + soluble ball seat for hard isolation + temporarily plugging and diversion for soft clustering". Taking into account the in-situ stress of horizontal sections (with a stress difference between clusters ranging from 1 MPa to 3 MPa), variations in rock fracture toughness (2 MPa to 4 MPa), and stress interference between fractures in the Chang 7 Member shale oil, each section is designed with 3 to 5 fracture clusters. Simulation results indicate that high-rate injection (with an individual cluster injection rate exceeding 2.5 m3/min and a total rate of 8-12 m3/min for each section) can achieve balanced initiation and expansion of multiple clusters. By integrating the differentiated cluster perforating technique and the dynamic temporary plugging and diversion based multi- cluster fracture control technique, the effectiveness of multi-cluster initiation and the complexity of fractures are further enhanced. Based on the principles of limited entry fracturing, a differentiated perforation design is implemented for different clusters within each section. For low-stress clusters, the number of perforation holes is moderately reduced (minimum of 3 holes), while for high-stress clusters, the number of perforation holes is moderately increased (maximum of 12 holes). Analysis of stepped-rate tests shows that the effectiveness rate of differentiated cluster perforation can reach over 80%, significantly higher than conventional multi-cluster perforation (50%-60%). A high-viscosity fluid is employed to carry soluble diversion materials, such as rope knotted temporary plugging agents or multi-particle size plugging agents, to the perforation holes, fracture openings, or ends that have been opened. This creates a sealing effect, leading to the diversion of the fractures towards high- stress areas that have not yet been fractured. The effectiveness of temporary plugging is determined based on the pressure response characteristics. When the pressure increases instantly after temporary plugging or the working pressure before and after plugging exceeds the stress difference between clusters (3 MPa), there is a higher probability of fracturing diversion towards the high-stress region to induce new fractures. Fiber optic monitoring and post-fracturing cluster flow back testing in the wellbore confirm that the effectiveness rate of multi-cluster fractures within each section exceeds 80%.
In the area with locally developed natural fractures and faults, or the Chang 6 and Chang 8 members water injection overlapping regions, there is a significant difference in the distribution of plane and longitudinal stresses. In such cases, high-rate fracturing with multi-cluster perforation often leads to the formation of ultra-large fractures with uncontrolled length and height, severely impacting the effectiveness of transformation and development. To address this, a coiled tubing and jet staged fracturing process (single stage, single cluster) is employed to precisely control fracture initiation and propagation.
3.4.4. Cost reduction of tools and materials and economical optimization of parameters
In order to achieve quality enhancement and efficiency improvement in volume fracturing, new fracturing tools and materials were developed, including high-performance all-metal soluble ball seats and multi-functional slick water fracturing fluids. These new tools and materials are priced more than 50% lower than the similar foreign products, resulting in a 15% reduction in fracturing costs per well. The all-metal soluble ball seats have a pressure resistance of 70 MPa and an internal diameter of 55 mm, and dissolve completely within 7 d. They dissolve within 20 h, leading to a 70% cost reduction compared with imported soluble fracturing isolation tools. The multi-functional slick water fluid possesses properties such as variable viscosity, reduced friction, and oil displacement capabilities. Its viscosity can be adjusted within the range of 5 mPa·s to 200 mPa·s, satisfying the requirements of low viscosity and friction reduction for high-rate pumping (with a friction reduction rate exceeding 70%) as well as high-viscosity for proppant-carrying capabilities (with a maximum sand ratio of over 30%). Additionally, it demonstrates good oil displacement efficiency (37%) and promotes the imbibition and replacement of oil and water in micro-pore throats.
The shale oil reservoirs exhibit poor physical properties, thus necessitating a certain level of diversion capability for fluid flow. Through comprehensive analysis of hydraulic fracture propagation characteristics, it has been determined that the fracture system resulting from volume fracturing in shale oil reservoirs consists primarily of artificial primary fractures supported by branch fractures and micro fractures. These complex fractures vary greatly in scale at different levels, primarily in terms of length and width. Fracturing simulation and outcrop observations indicate that the half-length of the primary fractures generally spans half the well spacing (200-250 m), with a width of 5-10 mm. The length of branch fractures, on the other hand, does not exceed cluster spacing (5-10 m) and the width is 1-2 mm. Micro fractures, being even smaller, typically have a length less than 1 meter and a width less than 1 millimeter. The flow conductivity in the matrices with different permeabilities and in the fractures of different scales can be calculated using the dimensionless conductivity formula, as depicted in Fig. 12 .

Fig. 12. Flow conductivity requirements of fractures at different levels. |
Experimental results have shown that conventional quartz sand with multiple particle sizes can meet the flow conductivity requirements of fractures of different scales in the fracture network. In the initial stage, a combination of 380/212 μm (40/70 mesh) and 830/380 μm (20/40 mesh) particle sizes of quartz sand was used as the proppant, with the finer 380/212 μm (40/70 mesh) quartz sand at the front and the coarser 830/380 μm (20/40 mesh) quartz sand at the back. Proppant transport and placement experiments have confirmed that smaller particle sizes have a greater transport distance. In recent years, proppant combinations with smaller particle sizes, such as 212/109 μm (70/140 mesh) and 380/212 μm (40/70 mesh), have been gradually expanded to achieve comprehensive support for fractures across all scales. By using key parameters of shale oil horizontal well stimulation as the independent variables and internal rate of return as the dependent variable, a technical-economic optimization model "fracturing parameters - stage cumulative oil production - full lifecycle EUR (Estimated Ultimate Reserve) - internal rate of return" was established. Using the big data of field application as the sample set, the key parameters were optimized as follows: 2.5-3.0 fracturing sections per 100 m, 3-5 clusters per section, proppant intensity of 3.0-4.0 t/m, and fluid injection rate of 15-25 m3/m.
3.5. Factory-like operation mode of large platform
In response to challenges such as the complex loess landform, arid and water-deficient conditions, long-time well building cycles of large platform, and low contribution rates of new wells, a distinctive factory-like operation mode of the loess landform has been developed. It is cored with the "three same directions" construction pattern, factory-like drilling and fracturing operation, and intelligent remote decision support.
3.5.1. "Three same directions" construction pattern
Due to the influence of developed natural fractures, the conventional production pattern causes severe interference between the neighboring wells of the same direction in the same platform or the neighboring platforms in drilling, fracturing, and production processes, which results in frequent delays and suspensions and even well control risks. To address this, a regional "three same directions" construction pattern, i.e. drilling in the same direction, fracturing in the same direction, and producing in the same direction, is established. It involves coordinating drilling, fracturing, and production operations with a region as a unit, making drilling operations in the same well-row direction, followed by switching the drilling rig to the next well-row. Once drilling is completed, fracturing operations are conducted uniformly to that row of wells. This process continues in sequence. By implementing equipment zoning layout, concentrating operations of the same process in the same direction, and ensuring orderly connections between different processes, interference between wells during operations is significantly reduced, resulting in a 5% increase in the contribution rate of new wells on the platform.
3.5.2. Factory-like of drilling and fracturing operation
The factory-like drilling and fracturing operations in the later stage are facilitated by the advanced provision of water, electricity, roads, and communication on the large platform. This comprehensive implementation lays a solid foundation for future factory-like drilling and hydraulic fracturing. The innovation in factory-like drilling introduces a management approach of "one team overseeing multiple sets of equipment for construction". Power generation equipment, emergency materials, drilling fluids, and communication networks are shared and utilized collectively, thus enhancing efficiency. Taking the HH100 platform as an example, five sets of equipment are coordinated by one team to carry out operations, resulting in a reduction of 36 sets of equipment and 42 persons. A total of 31 horizontal wells were drilled within 172 d with an average well depth of 4375 m, an average horizontal section length of 2040 m, and an average drilling cycle of 14.7 d. In terms of factory-like hydraulic fracturing, innovation lies in the comprehensive water supply model of "water storage in river dams, water impoundage at platforms, and recycling of produced water." This is complemented by a support agent storage and utilization model of "sand storage near the sand yard, sand supply on-site from the platform, and continuous sand injection through sand hoppers". Additionally, techniques like zipper fracturing are widely applied to achieve continuous operations. Specifically, one set of equipment operates on two wells simultaneously. While hydraulic fracturing is being conducted on one well, the other well on the same platform undergoes bridge plug pumping and perforation, resulting in a 15% increase in operational efficiency.
3.5.3. Intelligent remote decision support system
An intelligent decision support system of geology-engineering integration was developed, enabling real-time data transmission from the construction site and real-time comprehensive tracking of drilling, fracturing, and other construction processes. With remote command capabilities from the technical center, this system enhances the timeliness and effectiveness of on-site operational decision-making, and achieves the integration of comprehensive research, deployment decisions, and production organization.
3.5.4. Application examples of factory-like operations
Take the HH60 platform as an example, where 22 horizontal wells have been successfully completed. Through the integration of 3D seismic, geological, and logging data, a 3D geological and stress model was established. Based on the classification and grading of 3D "sweet spots," a multi-well intensively-staged fracture design was employed to ensure the maximum control of high-quality reserves while mitigating risks associated with natural fracture development and inter-well interference. Single well transformations were implemented to achieve 2.5-3.0 sections per 100 m and fracture clusters ranging from 3 to 5 per section. The displacement rate, proppant intensity and fluid injection rate were set at 10.0-12.0 m³/min, 3.5-4.0 t/m and 15-20 m³/m, respectively. In the fracturing process, the variable-viscosity slick water was used as fracturing fluid, and the multiple-particle size quartz sand was used as proppants. Multiple sets of fracturing units were employed on site for factory-like fracturing operation. Downhole micro seismic monitoring was performed for the real-time adjustment and optimization of pumping programs and temporary plugging and diversions based on the response of micro seismic events. Monitoring results demonstrated the effective coverage of the single well control area by the micro seismic cloud. After the fracturing, fracture inversion based on staged fracturing curves yielded the propagation morphology of multi-segment and multi-cluster fractures. Upon coupling the inverted fracture network with the 3D geological model, it becomes evident that the artificially created fracture network fully taps into high-quality reserves. As a result, the initial single well productivity on the platform exceeded 15 t.
3.6. Optimization technology for rational production systems
Based on the theory of elastic drive in unsaturated closed reservoirs, combined with the practical insights gained from the volume fracturing development of shale oil horizontal wells in the Ordos Basin, the production cycle of shale oil horizontal wells is divided into three stages: soaking stage, liquid drainage stage, and oil production stage.
3.6.1. Soaking stage system
The primary objective of the soaking following volumetric fracturing in shale oil wells is to achieve pressure and temperature equilibrium between the artificial fractures and the matrix, as well as sufficient imbibition and replacement between the fracturing fluid and the crude oil, enhancing the rejuvenation effect of the fracturing fluid and reducing the oil flowback rate. The key task during this stage is to determine an optimal soaking time based on careful considerations.
The results obtained from the static imbibition experiments and the NMR dynamic imbibition experiments indicate that shale oil exhibits a strong imbibition capability. By comparing the imbibition replacement rate, equilibrium time, and recovery rate of different core samples, it is evident that the wettability and properties of the reservoir, fracturing fluid properties, fractures, and pressure are the primary factors influencing the imbibition effect in the reservoir. In particular, for core samples containing fractures and under confined conditions, the imbibition replacement rate and recovery rate are significantly higher compared with matrix core samples and the core samples under atmospheric conditions. Numerical simulation of variations in pressure and oil saturation using different reservoir properties and fracturing scales during the shut-in process reveals that as the matrix porosity and permeability increase, the fractures become more complex, and the required shut-in time decreases. The greater the single-stage fluid injection volume, the longer the shut-in period is.
Based on the understanding of the imbibition potentials and laws of the block, the determination of an appropriate shut-in period relies primarily on the wellhead pressure drop method, with adjustments made through comprehensive field statistics. During the shut-in period, the measured wellhead pressure drop typically exhibits a three-stage pattern characterized by "rapid decline, slow decline, and stabilization" (Fig. 13 ). When the pressure drop rate exceeds 0.6 MPa/d, the shut-in process is in the pressure diffusion stage. When the pressure drop rate ranges from 0.1 MPa/d to 0.6 MPa/d, the shut-in process is in the oil-water replacement stage. Finally, when the pressure curve becomes relatively stable and the pressure drop rate remains below 0.1 MPa/d for three consecutive days, the shut-in is considered to be ended based on the wellhead pressure drop method. Taking Qingcheng Oilfield as an example, the average shut-in time is determined to be around 30 d using the wellhead pressure drop method. Field statistics indicate that a too short shut-in period can lead to increased sand production, while an excessively long shut-in period can result in increased oil viscosity (over three times that of normal surface oil viscosity), scaling issues, and ultimately affect single well productivity. The shut-in period of 10 d to 40 d typically yields faster oil production with the maximum initial oil production per 100 m of horizontal section after the shut-in process. In practical applications, the shut-in period shall be determined firstly by the wellhead pressure drop method, and then be adjusted within the reasonable range of the block as determined by the field statistics method.

Fig. 13. Relationship between decline curve of wellhead pressure in horizontal wells and time. |
3.6.2. Liquid drainage system
Following the completion of the shut-in period, the horizontal well enters the liquid drainage stage. The primary tasks of this stage are to determine the optimal daily liquid drainage rate and control the pressure drop rate, so as to expedite the production of oil, reduce water cut, and prevent sand production. The production performance during this stage is characterized by high liquid rate, high water cut, and low salinity. The judgment criterion for the end of the liquid drainage stage is the salinity of the produced water approaches that of the original formation water. Production data from the production wells in the Qingcheng area show that when the water cut in horizontal wells decreases to around 60%, the rate of increase in salinity slows down and becomes close to the salt content of the original formation water, indicating the completion of the liquid drainage stage.
Determining the appropriate liquid drainage rate during the liquid drainage stage should primarily consider avoiding damage to fractures and the formation. Based on the theory of proppant backflow and migration, a critical sand production flow rate chart is established for different number of fracture cluster s and various particle sizes of proppant (Fig. 14 ).

Fig. 14. Critical flow rate for different number of fracture clusters and proppant particle sizes. |
Currently, the proppant specifications used in the hydraulic fracturing operations of shale oil wells in the Qingcheng Oilfield are mainly 425/212 μm (40/70 mesh). On average, each well undergoes hydraulic fracturing in 25 stages with 100 clusters. The critical sand production flow rate does not exceed 85 m3/d. In practical applications, to ensure sand-free wellbore conditions and improve production stability, a safety factor of 0.9 is applied based on the actual number of fracturing stages and clusters in each well. The liquid drainage rate for horizontal wells is calculated by multiplying the critical sand production flow rate by the safety factor.
3.6.3. Oil production system
After the initial liquid drainage phase in shale oil horizontal wells, the oil production stage commences. The main characteristics of this stage are declining liquid rate, stable water cut, and the gas/oil ratio varying continuously with the reservoir pressure. Based on the variation patterns of the gas/oil ratio, the oil production stage is divided into four stages: low production gas/oil ratio stage, medium to high production gas/oil ratio stage, high production gas/oil ratio stage, and high to low production gas/oil ratio stage.
(1) Low production gas/oil ratio stage: It is essential to fully utilize the elastic energy from the injected fluid, reservoir, and subsurface fluids, along with the expansion energy from gas dissolution. The expansion energy from gas dissolution refers to the energy released when dissolved gas in oil expands but does not flow, pushing the oil towards the wellbore. In this stage, it is crucial to maintain the ratio of bottom hole flowing pressure to saturation pressure greater than 1.0. The notable characteristics include bottom hole flowing pressure exceeding saturation pressure, and the gas/oil ratio being near the original formation gas/oil ratio, typically ranging from 100 m3/t to 200 m3/t. Based on extensive production statistics, the duration of the low production gas/oil ratio stage is approximately three years. Efforts should be made to prolong this stage and enhance its cumulative oil production.
(2) Medium to high production gas/oil ratio stage: This stage represents the early gas dissolution drive period. As the compressibility factor of gas is one order of magnitude higher than the overall compressibility factor, the elastic expansion energy from gas dissolution becomes the primary driving force. Due to the decrease in reservoir pressure, the bottom hole flowing pressure decreases, gradually falling below the saturation pressure. The ratio of bottom hole flowing pressure to saturation pressure is maintained between 0.8 and 1.0 to maintain a certain liquid production intensity. Research indicates that after the bottom hole flowing pressure falls below the saturation pressure, the dissolved gas begins to exsolve, leading to a significant increase in fluid flow resistance. In the development practices of Qingcheng Oilfield, as the bottom hole flowing pressure falls below the saturation pressure, the production gas/oil ratio increases with the decrease of the bottom hole flowing pressure. During this stage, the production gas/oil ratio is 200-600 m3/t.
(3) High production gas/oil ratio stage: This stage represents the mid-to-late period of the gas dissolution drive. The ratio of bottom hole flowing pressure to saturation pressure is less than 0.8, indicating severe gas depletion in the reservoir. The viscosity of the reservoir's crude oil increases, reducing its flow ability. During this stage, the production gas/oil ratio exceeds 600 m3/t, surpassing six times the original gas/oil ratio.
(4) High to low production gas/oil ratio stage: This stage represents the late period of the gas dissolution drive. Due to extensive gas depletion in the reservoir, significant energy consumption occurs, causing both liquid production rate and production gas/oil ratio to continuously decline. Ultimately, no gas or liquid is produced from the reservoir.
4. Application results
The application of the aforementioned key techniques has resulted in the successful development of the Qingcheng Oilfield in terms of scale and efficiency. Currently, a total of 508 horizontal wells have been drilled in Chang 72 and Chang 71 submembers, resulting in a cumulative production of 198.7×10⁴ t. The average length of the horizontal section is 1648 m, with well spacing ranging from 300 m to 500 m. On average, each well underwent fracturing in 25 stages, with a total injection volume of 26 918 m3 of fluid and 3069 m3 of proppant. The number of productive wells has increased to 497, and key development indicators such as oil layer drilling ratio, single well productivity, oil recovery rate, interim cumulative oil production, and estimated ultimate recovery (EUR) per well have got significant improvement. By implementing the multidimensional “sweet spot” evaluation and selection techniques for continental shale oil from the aspects of planar, vertical, and horizontal sections, the oil layer drilling ratio has increased to 80.2%, which provides a geological foundation for enhancing single well productivity. And combined with the intensively-staged volume fracturing technology, the average first-year cumulative oil production is increased from 3186 t to 4145 t. The application of differentiated 3D well pattern techniques achieves the effective utilization of multiple reservoirs within a single well pattern, resulting in an increase in the degree of producing reserves from 60% to 85% and an improvement in the oil recovery rate from 0.9% to 1.2%. Moreover, the application of the optimization techniques for a rational production system has contributed to the reduction of the first-year decline rate from 39.2% to 28.4% and the increase of EUR per well from 2.0×10⁴ t to 2.6×10⁴ t. The implementation of the optimized rapid drilling and completion techniques of large-clusters horizontal well and the factory-like operation mode of large platform has resulted in accelerated production, increased efficiency, and reduced costs. Now, the development is fully cost-effective, with a complete cost of $55 per unit, leading to an increase in internal rate of return from 5.2% to 6.7%. This signifies the achievement of large-scale cost-effective development of horizontal wells., The annual production of shale oil in the Ordos Basin in 2022 is 221×104 t, accounting for 70% of China's total shale oil production. This is deemed as a crucial direction for the production stabilization and growth of over 6000×104 t in the Changqing Oilfield during the "14th Five-Year Plan" and beyond, while also offering valuable insights for the efficient development of continental shale oil.
5. Conclusions
In conclusion, the integrated geology-engineering "sweet spot" evaluation method is established by combining geological, seismic, and logging techniques together. This method enables quantitative and 3D selection of the "sweet spots" in the planar, vertical, and horizontal sections, leading to an improved oil layer drilling ratio in horizontal wells and a solid geological foundation for enhancing single well productivity.
Furthermore, a differentiated well pattern model is established. Based on the optimization of technical and economic parameters for the well pattern, combined with different geological and surface conditions in single oil layer, overlapping multiple oil layers, and restricted reserves areas, as well as the reasonable interlayer thickness in the 3D development well patterns, four well pattern models are established, allowing for the effective utilization of multiple reservoirs within a single well pattern and significantly increasing the degree of producing reserves.
A series of technological researches are carried out on the optimization of 3D horizontal well profiles with large offset, the optimized rapid drilling of long horizontal wells, and the high-toughness cement slurry. These advancements have contributed to the development of the key technologies for the drilling and completion of large-cluster horizontal wells, resulting in a substantial increase in platform controlled reserves.
Considering the geological characteristics such as high reservoir heterogeneity and limited natural micro fractures in the Chang 7 shale oil reservoirs in the Ordos Basin, a high-density intensively-staged volume fracturing technique has been developed. This process significantly reduces the average spacing between fractures and increases cluster density, effectively creating artificial fractures and maximizing the degree of producing reserves.
To address the difficulties in the loess tableland, such as complex landform, arid conditions, water shortage, long well construction cycles on large platforms, and low contribution rate of new wells, we have strengthened our management innovations and accelerated technological upgrades. This has led to the development of an efficient factory-like operation model with the characteristics of the loess tableland. This model centers around "three same directions" construction organization, factory-like drilling and fracturing operations, and intelligent remote decision support.
Based on the characteristics of shale oil development, the production life cycle of the shale oil horizontal wells of Chang 7 Member is divided into three stages: soaking, liquid drainage and oil production. By using quantitative analysis methods and considering different production stages, we proposed a full lifecycle policy of "effective soaking, efficient drainage, and oil production at stable pressure" for shale oil horizontal wells. This policy maximizes the preservation of reservoir energy and extends the period of stable production.
The key technologies and production organization patterns, such as the comprehensive selection of "sweet spots", the well pattern of large-cluster wells, the optimized rapid drilling and completion, the intensively-staged volume fracturing, the efficient factory-like operation model tailored for the loess tableland, and the rational production system for the shale oil in the Ordos Basin have been researched and developed, which promote the rapid development of shale oil in the Changqing Oilfield and serve as exemplary models for the efficient development of similar oil reservoirs in terms of scale and productivity.
Nomenclature
a—constant, dimensionless;
b—coefficient representing the influence of natural fractures, dimensionless;
f—“sweet spot” grading index, dimensionless;
M—magnitude of micro seismic events;
N—number of micro seismic events detected for a given magnitude;
RAT10, RAT20, RAT30, RAT60, RAT90—array induction resistivity at depths of 254 mm (10 in), 508 mm (20 in), 762 mm (30 in), 1,524 mm (60 in), and 2,286 mm (90 in), respectively, Ω·m;
So—oil saturation, %;
Vsh—shale content, %;
ϕ—porosity, %.