

Introduction
Approximately 20%-50% of the oil in reservoirs is extracted by primary and secondary oil recovery processes[1]. Considering the high demand for energy due to technological and industrial advances, the need for tertiary oil recovery (i.e. enhanced oil recovery or EOR) processes becomes evident. EOR processes include the addition of chemicals, gases, nanoparticles, and microorganisms, as well as thermal processes [2-3]. The most profitable process for oil extraction is water injection, which has been widely applied in secondary oil recovery. Martin [4] was the first to document that brine salinity influenced oil recovery. However, Morrow et al. [5] conducted more systematic studies and postulated that the injection of low salinity water (LSW) was an economical alternative to increase oil recovery in sandstones. After these works, interest in studying the feasibility of processes with LSW has increased.
Several mechanisms have been proposed to explain the effect of LSW in EOR processes. The most accepted are the migration of fines [6], dissolution of minerals [7], Multicomponent Ion Exchange (MIE) [8], salting effect [9], pH modification [10], and expansion of the double layer [11]. A consensus has not been reached on these proposals [12]. The above-mentioned convergence of multiple mechanisms is highly probable.
Katende and Sagala [13] assessed that numerous factors are involved in the performance of oil recovery by LSW. These factors include oil composition, components and concentration of ions in the brine, wettability conditions of the porous media, minerals in the rock, environmental conditions, as temperature. Salinity concentration is a determining factor for the success of LSW processes. Snosy et al. [14] conducted a review of numerous water flooding experiments with LSW. They suggested that monovalent cations must be greater than divalent cations in the injection water and that a Ca2+/Na+ ratio should be less than 0.04 for oil recovery. Katende and Sagala [13] mentioned that, for a notable change in wettability, the salinity must be around 5000 mg/L. Jackson et al. [12] stated a set of conditions for the effect of LSW for EOR: clays and formation water must be present, the oil must have polar compounds, and the injected brine should have multivalent ions. Chavan et al. [15] mentioned the following criteria: the salinity of the water must be 2000-5000 mg/L, with pH greater than 7, and the rock must be strongly oil wet. Other works demonstrated the importance of the components of oil in LSW processes. Shaddel and Tabatabe-Nejad [16] evaluated oils with different total acid number (TAN) and reported that oil with low TAN values presented lower recoveries.
The application of chemicals, such as polymers and surfactants, in EOR processes has been documented as useful for improving the oil recovery factor [3]. The addition of a chemical or natural surfactant causes the reduction of the interfacial tension (IFT) between the oil and the water, and wettability alteration of the rock towards a more water wet state, thus reducing the capillary forces that trap the oil [17]. However, the loss of the surfactant by precipitation or adsorption in the porous media is limiting factors for their application. Regarding adsorption, it has been found that salinity has an important effect [18]. Belhaj et al. [19] hypothesized that brines with high salinity favored adsorption on the rock due to the multiple interactions between the surfactant and the ions contained in the brine.
LSW technology can be combined with other EOR technologies, such as polymers and surfactants, to obtain more efficient processes [20]. Current reports in the available literature suggest that hybrid LSW and surfactant process presents a synergistic effect to improve the oil recovery, compared with individual processes [21-22]. Shakeel et al. [23] experimented with the hybrid process and reported increases of 30%-70% compared to standalone processes. Alagic and Skauge [24] conducted experimental studies on LSW injection schemes in sandstones, followed by an anionic surfactant injection in a tertiary process, which presented a high oil recovery. The reduction of the IFT and the change of wettability were the predominant mechanisms. A similar scheme, using smart water and a green surfactant in carbonate rock, also obtained encouraging results in hybrid systems [25]. Derikvand et al. [26] showed that by reducing the salinity of the flood water, the surfactant oil recovery efficiency increased. Moreover, the concentration of Ca2+ and Mg2+ also influenced the amount of surfactant adsorbed on the rock.
Several experiments with LSW, as well as surfactants, in individual schemes for EOR have been conducted, but combined processes have only recently been evaluated, most of them using model systems, which have generated useful information for understanding the process. However, experiments using field samples are scarce.
The novelty of the work is the study of the hybrid process of low salinity water and surfactant injection using reservoir rocks and heavy crude oils. The experimentation was complemented with tomography, a non-invasive technique that allows better process monitoring of the changes of oil saturation and the sweep efficiency between stages, but also the variation of porosity through the sample. Moreover, mechanisms of LSW were identified.
1. Materials and methods
1.1. Crude oil and rock samples
Oil and core samples were obtained from a sandstone reservoir in southeastern Mexico. The oil samples were collected in bottles and transported and stored at 4 °C until use. The crude oil properties are listed in Tables 1 and 2 .
Table 1. Relevant crude oil properties |
| Parameter | Value | Parameter | Value |
|---|---|---|---|
| Saturates content | 42.30% | TAN | 0.23 mg/g |
| Aromatics content | 26.90% | TBN | 1.90 mg/g |
| Resin content | 19.70% | Relative density | 0.920 6 |
| Asphaltene content | 11.12% | Density at 114 °C and 27.6 MPa | 876.9 kg/m3 |
| Sulfur content | 2.53% |
Table 2. Metal content in oil samples |
| Metal | Content/(mg·kg−1) | Metal | Content/(mg·kg−1) |
|---|---|---|---|
| Ba | <0.50 | Na | 23.84 |
| Ca | 6.34 | Sr | 0.35 |
| Fe | 2.35 | Ni | 20.78 |
| Mg | 0.17 | V | 101.00 |
| K | 0.64 |
The mineral composition of the core was determined using X-ray diffraction and fluorescence techniques. The results are summarized in Fig. 1 . It should be noted that the rock had a low quartz content and a high concentration of albite and anorthite. The rock was cut and washed with toluene and methanol.
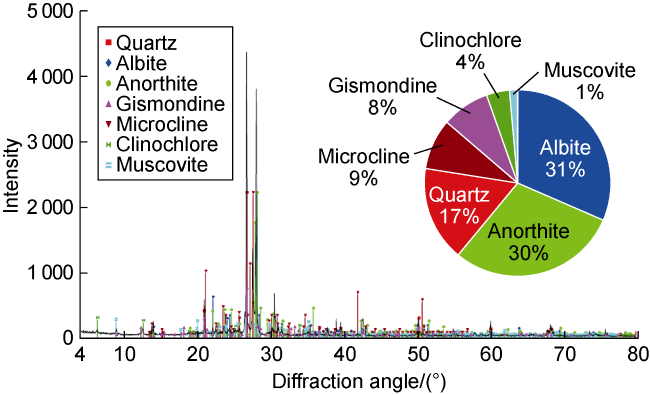
Fig. 1. Mineral composition of the core. |
1.2. Brines
The following brines were used: synthetic formation water (FW), seawater from the Gulf of Mexico (SW), and ten times diluted seawater (used as low salinity water - LSW10%). Table 3 shows some characteristics of the brines.
Table 3. Brine characteristic parameters |
| Brine | pH | Conductivity/ (mS·cm−1) | Total dissolved solids/(mg·L−1) | Total hardness as CaCO3/(mg·L−1) | Salinity as NaCl/ (mg·L−1) | Density at 114 °C and 27.6 MPa/(kg·m−3) |
|---|---|---|---|---|---|---|
| FW | 8.03 | 131.63 | 101 208.57 | 9766.67 | 94 000 | 1027.14 |
| SW | 8.03 | 54.93 | 39 362.40 | 6600.00 | 35 000 | 987.29 |
| LSW10% | 7.32 | 6.38 | 3802.82 | 639.33 | 3600 | 964.18 |
1.3. Surfactant
The surfactant used in the experiments was IMP- AMESUS-1100, which belongs to the IMP-WET-FOAM® line, a product developed by the Mexican Petroleum Institute, which is stable at elevated temperatures (180 °C) and salinities (400 g/L). In previous studies, the critical micellar concentration (CMC) of the surfactant was determined as 0.75 g/L.
1.4. Interfacial tension (IFT)
The measurement of interfacial tension between oil and brines was conducted with the pendant drop technique, using a stainless-steel high-pressure cell with a quartz peephole. The cell contained a capillary needle for injecting oil and the system was complemented by a digital camera (Fig. 2 ). The brine was injected into the cell and the temperature and pressure were set at 114 °C and 27.6 MPa (4000 psi). When the system stabilized, the oil was injected via the capillary needle to form a drop. The IFT was determined by the dimensions of the drop, the density of the fluids and the Laplace equation. The average of ten measurements was recorded.
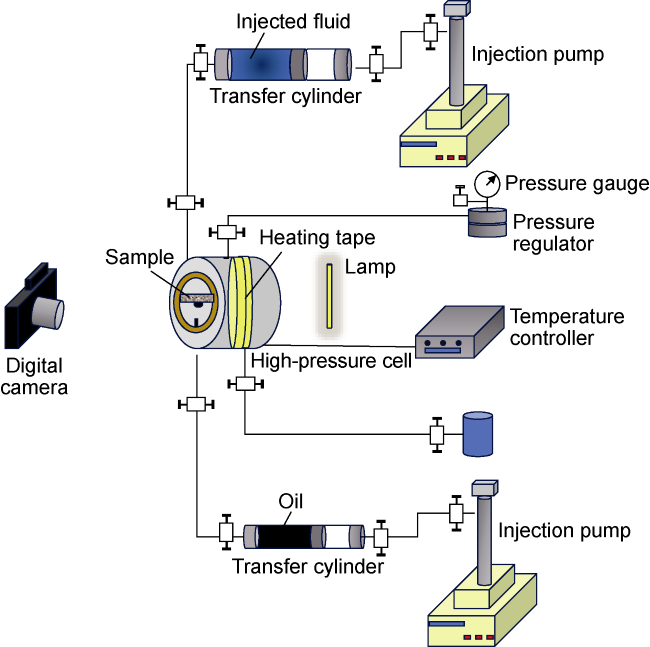
Fig. 2. Schematic of the IFT and contact angle measurement system. |
1.5. Contact angle measurement
Before the core-flooding experiment, the contact angle measurement was performed using the captive bubble technique. The reservoir rocks were cut into plates of 25.4 mm diameter and 6 mm thick and washed with methanol and toluene. The rock plates were impregnated with oil at 6.9 MPa (1000 psi) and 60 °C and aged for 7 d, and then submerged in the brine to be evaluated for 7 d at 70 °C. Subsequently, the rock was placed in the cell shown in Fig. 2 . The studied brine was injected, and the system was set at 114 °C and 27.6 MPa (4000 psi). Oil was injected via the capillary needle until an oil drop was attached to the rock. The contact angle was measured at different time intervals until equilibrium was reached. The images were periodically captured with the digital camera.
1.6. Evaluation of ions
The ion concentrations of the injected brines, as well as the effluents obtained in different stages of the process, were evaluated by atomic absorption spectroscopy.
1.7. Carbon chromatography of crude oil
The carbon chromatography of the original oil samples, as well as the oil samples recovered in different stages of the process, was determined according to the ASTM D7169-05 standard method [27] for clarifying the boiling point distribution.
1.8. pH
The pH of the injected brines, as well as the effluent samples, was determined using a Cole-Parmer brand pH meter, model AR50.
1.9. Core-flooding experiment
The reservoir core was cut, placed in a titanium core holder (Fig. 3 ), washed with methanol and toluene, and then dried and saturated with formation water (Table 4 ). The pore volume was determined by the difference in weight between the dry sample and the saturated sample, while the core permeability was determined by injecting the formation water at different rates and using the Darcy's Law. Subsequently, dead oil was injected at 1 mL/h, until core saturation. Then the core was confined and aged for 20 d at 114°C. The initial oil saturation in the core was 47.5%. The core parameters are given in Table 4 .
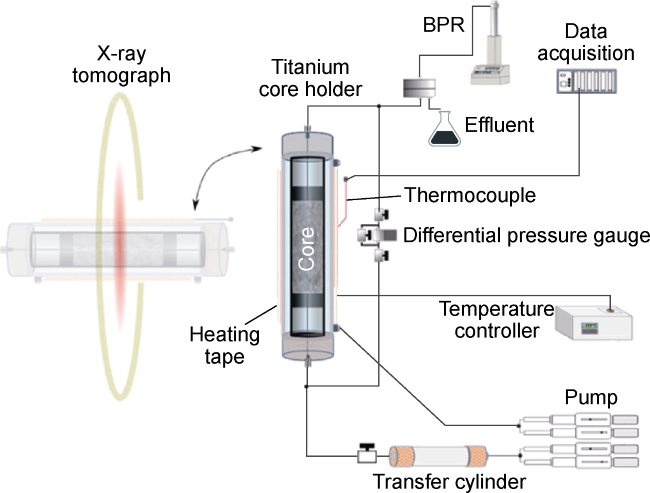
Fig. 3. Schematic of the core-flooding system. |
Table 4. Core parameters |
| Parameter | Value | Parameter | Value |
|---|---|---|---|
| Length | 12.5 cm | Porosity | 24.8% |
| Diameter | 5.0 cm | Permeability | 94.5×10⁻³ μm2 |
| Dry weight | 531.6 g | Initial oil saturation | 47.5% |
| Pore volume | 61.6 cm3 |
The core-flooding experiment was carried out at the reservoir temperature (114 oC) and pressure (27.6 MPa or 4000 psi). The brines were injected in the following sequence: SW, LSW10%, LSW10% + S0.1% (0.1% surfactant), and LSW10% + S0.2% (0.2% surfactant).
For each brine injection, two rates were used: 1 mL/h initially until the oil production was null, and then 5 mL/h, to eliminate the edge effect. The effluents were collected at ambient temperature and pressure for further analysis. During the experiment, the volume of brine injected, volume of oil recovered, and differential pressure were determined. The oil saturation and original oil in place (OOIP) were calculated by means of a material balance.
1.10. Tomographic analysis
The X-ray tomographic analysis was performed on a Philips Brilliance CT 6 tomograph. In the images, the pixel values are given as a CT number, determined by the attenuation coefficient associated with the density of the materials. The images were taken with a spacing of 3 mm. The core was in a vertical position for displacement and in a horizontal position for tomographic scanning (Fig. 3 ).
Images of the core were taken at reservoir conditions at the end of each of the following stages:
• Dry series - series with clean and dry samples (initial condition)
• Swi, brine saturated series - Maximum brine saturation
• Soi+Swi, oil saturated series - Maximum saturation of oil and irreducible water
• End series of displacement with SW
• End series of displacement with LSW10%
• End series of displacement with LSW10% + S0.1%
• End series of displacement with LSW10% + S0.2%
• Final dry series (after the cleaning process)
The images were taken at the same reference position to identify the differences of the images at each stage. The distribution map of the oil recovery zones was determined by a subtraction operation for each series of displacement stages, with respect to the series of irreducible oil and water (So + Swi), which reflect the zones where the oil is mobilized. The areas that presented the maximum differences were particularly evaluated.
The porosity analysis was performed using the differences between the series of images from the saturated series Swi and the dry series. This operation allowed the distribution map of the zones saturated with water and the global numerical average of the CT number to be obtained, which was calibrated with the porosity value determined in the experiment.
2. Results and discussion
2.1. Interfacial tension (IFT)
The interfacial tension between oil and brines was evaluated under reservoir conditions (Fig. 4 ). The IFT is 29.87 mN/m in the case of SW, and 34.96 mN/m in the case of LSW10%; hence, LSW10% brine presents a higher IFT than brines with high salinity. For the brines of LSW10% + S0.1% and LSW10% + S0.2%, the IFT is 1.5 mN/m for both. Clearly, the addition of surfactant drastically reduces the IFT.
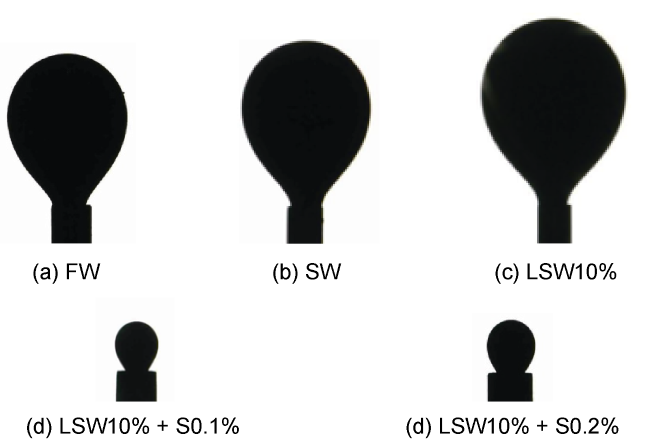
Fig. 4. Evaluation of the IFT between brines and oil. |
There is no consensus on the relation between the application of LSW and the modification of IFT. Some researchers reported a significant reduction in IFT when applying LSW. Kakati et al. [28] evaluated the IFT between crude oil and brines of different salinities, and indicated that with seawater, the IFT was 15.7 mN/m, while for the brine diluted to 25%, the IFT was 8.92 mN/m. However, other works concluded that the addition of LSW does not have a significant effect on the reduction of IFT, and, therefore, the reduction of IFT is not a mechanism that explains the oil recovery process [8]. Crude oil and water elements, as well as environmental conditions, can modify the tenso-active properties in the fluid-fluid interaction. Khalili et al. [29] found that the composition of the water and the concentration of asphaltenes have relevance in IFT. In addition, the ions of Ca2+ and Mg2+ have an important effect on the IFT.
The results of this work show that water composition can significantly affect the IFT. Furthermore, LSW10% presents the highest values among the brines evaluated. The result is supported by Zhu et al. [30] who studied the effect of LSW in the interfaces. They found that the IFT gradually increases as the salt concentration in the brine decreases, and the concentration of Ca2+ also has the greatest effect on the IFT. Rezaeidoust et al. [31] suggested that, at LSW, the concentration of cations in the solution is reduced and, in turn, this limits the mobility of oil droplets and the substances with active surfaces in the interface, which increases the IFT. The composition of the oil is also an important variable in the modification of IFT. Garcia-Olvera et al. [32] studied the effect of oil components in LSW processes. They found that, at higher asphaltene concentrations, the IFT value is higher, and the same occurs at low acid concentrations. Studies in this regard found that oils with low acid number present IFT variations of less than one unit [33]. As observed in Table 1 , the oil used in this work has a low acid number, which would also explain the high IFT values at the LSW10% stage.
2.2. Contact angle
Wettability alteration is one of the most studied mechanisms in EOR processes, since it affects both the relative permeability and the capillary pressure [34]. At laboratory level, one of the most used methods to evaluate wettability is the contact angle. The patterns established by Anderson [35] are generally accepted for interpreting contact angle measurement. Surfaces are water-wet at angles of 0°-75°, oil-wet at angles of 115°-180°, and of intermediate wettability at angles of 75°-115°. To evaluate the contact angle, different materials have been used, such as quartz, glass, or Berea; however, there are few studies reported for reservoir rock.
This work dealt with reservoir rocks. Fig. 5 shows the evolution of the contact angle with the brines at different stages. In the system with SW, the contact angle is measured to be greater than 120°, which suggests that the rock is oil wet. In the system with LSW10%, the contact angle drastically decreases to values close to 60°, which indicates that the interaction between the rock and LSW10% modifies the wettability of the rock, which is preferentially water wet. Comparable results were reported by Alotaibi et al. [36]. Kakati et al. [28] stated that wettability alterations are caused by IFT reduction, as well as the separation of polar components of the oil adsorbed on the rock by ions like Ca2+. We found that, in the systems with surfactant, the droplet size is significantly smaller compared with the previous brines, which is attributable to the reduction of the IFT. In the case of LSW10% + S0.1%, the contact angle measurement is comparable with that obtained with LSW10%. In contrast, for LSW10% + S0.2%, the contact angle increases to around 90°, which implies an intermediate wettability. Studies have shown that an intermediate wettability condition favors oil recovery [37].
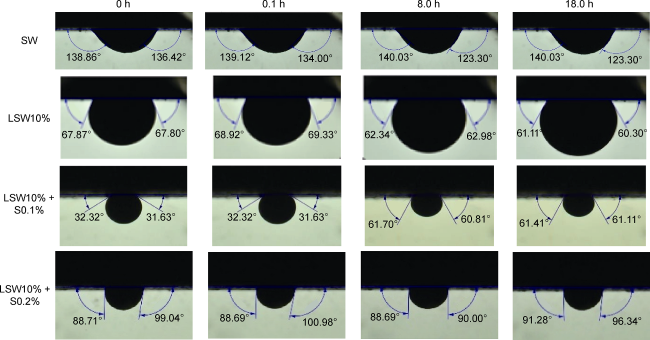
Fig. 5. Evaluation of the contact angle with different brines. |
The wettability alteration depends on the characteristics of both the rock and the fluids involved. Mohamed et al. [38] proposed that an important condition for the LSW effect is the presence of clays. In their experiments, they did not find wettability alternation on substrates made only of quartz. Alomair et al. [39] reported that LSW injection alters the wettability of synthetic Berea, making it more water wet. Zhu et al. [30] showed that, as salinity decreases, the contact angle decreases, because the rock is more hydrophilic.
According to the theory proposed by Austad et al. [9], the interaction between the brine and the rock causes clays to function as a cation exchanger. The Ca2+ ion is initially adsorbed in clays and organic materials; however, it is desorbed due to the imbalance caused by the LSW injection. The loss of the cations in the clay is compensated by adsorbing the protons from the water, which generates a higher concentration of OH- groups and, therefore, an increase in the pH (Eq. (1)). In turn, this generates the release of polar components of the oil, such as acids, since LSW has a low ionic strength and, in this condition, the polar components are more soluble in water (Eq. (2)). These changes would cause wettability alteration of the rock.
2.3. Core-flooding experiment
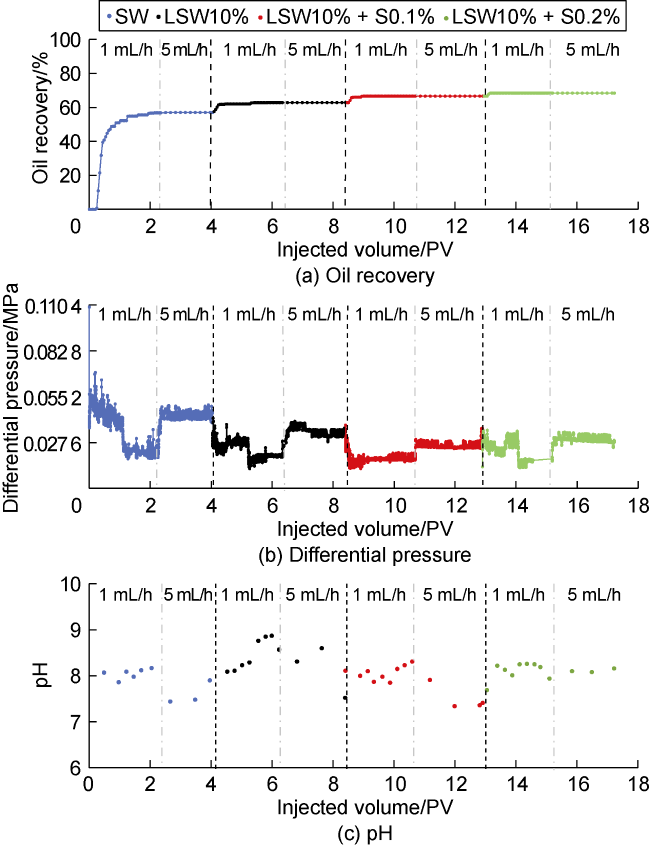
Fig. 6. Core-flooding experiments with different brines. |
2.3.1. Oil recovery
Numerous studies of LSW displacement have been performed with very varied results. In some cases, the application of LSW in tertiary oil recovery mode had no effect on oil recovery, while, in others, it was successful. Shehata et al. [40] evaluated four types of Berea (Bandera, Parker, Gray Berea, and Buff Berea) in tertiary oil recovery, and found that only Bandera had an additional oil recovery of 6.9% OOIP, while the other three rocks did not respond to the treatment. They proposed that the mineral distribution and the quality of the rock (evaluated as average pore throat radius) are crucial factors in the effectiveness of the process.
Experimental studies highlight the importance of oil composition. Hadia et al. [33] evaluated the oil recovery by injection of seawater and LSW using Berea cores and crude oils with different contents of asphaltenes, acids and basic components. They found the results varying in 0.5%-4.0% as tertiary oil recovery, and also stated that acid-free oils presented the lowest recoveries. Therefore, they postulated that the components of the oil have a significant role in the process. McMillan et al. [41] reported that the experiments with crude oils with relative density of 0.893 (or 27° API) showed a better response to LSW injection, compared with crude oils with relative density of 0.850 (or 35° API) or 0.865 (or 32° API).
In the case of LSW10% and surfactant, the increase in oil recovery is attributed to the reduction of IFT and the alternation of wettability. The present results agree with those obtained by Araz et al. [21] who conducted a combined study of LSW and the surfactant Sodium Dodecyl Benzene Sulfonate. Alagic et al. [42] also reported that the combination of LSW with surfactants increased the oil recovery factor, but the result was better in aged cores. Johannessen et al. [43] reported on experiments with hybrid systems, indicating an additional oil recovery of 0.6% OOIP in case of LSW and 7.3% OOIP with LSW and surfactant, in Berea cores. They attributed the reduction of IFT as the main oil recovery mechanism, pointing out that in cores with intermediate wettability the combined process is more efficient. This indicates that the rock/ brine/oil system is complex, and several variables and interactions affect the LSW injection with and without surfactants, as a tertiary oil recovery method.
2.3.2. Differential pressure
2.3.3. Effluent pH
Effluent samples were collected for each brine solution and the pH was measured, as shown in Fig. 6c . In case of SW injection, the effluent was slightly alkaline, with pH=8 or so as measured, which became 7.5 as the injection rate increased. Subsequently, when LSW10% was injected, the effluent was measured with the pH up to a value of 9. In the LSW10%+S0.1% injection at the low rate, the effluent registered a pH of 8; at the high flow rate, the pH value decreased again to 7.5. Finally, the injection of LSW0.1% + S0.2% produced the effluent with around pH=8. It is thus assumed that the change in pH is a manifestation of the interaction between the brines and other components of the system.
Hadia et al. [33] also reported a pH increase in the effluent after LSW injection, which, however, was less than one pH unit, presenting a value of around pH=7. They attributed the change to the dolomite dissolution, as well as the presence of albite. Neog [44] conducted studies with low salinity brines in sandstone cores, and highlighted that the temperature, as well as the interaction between rock minerals and brines, are relevant factors in the increase of pH of the effluents. Other authors, such as Piñerez et al. [45], also discussed the effect of the porous media on pH changes when using LSW. Based on experiments with sand packs, Al-Saedi et al. [46] indicated that clays can affect the pH value. Kakati et al. [28] reported that the pH of effluent in case of LSW injection was higher than that of high salinity brines, which is believed to be caused by alterations in the chemical equilibria between the divalent ions in the brine and the components in the rock. Alagic et al. [42] and Cissokho et al. [47] reported comparable results. In contrast, McMillan et al. [41] did not detect changes in the pH values of effluents, which practically presented neutral values in case of LSW injection.
In this work, the pH values of brines (before the core- flooding) were compared with those of the effluents obtained after displacement. The initial value of pH was 8.14 for SW, 7.45 for LSW10%, and 6.30 for both LSW10% + S0.1% and LSW10% + S0.2%. These data show that the effluents after injection of each of the last three brines become alkaline, mainly due to the interactions within the system.
Recent studies in systems with LWS have showed that IFT is strongly influenced by pH: IFT decreases significantly with increasing pH [30]. The authors hypothesized that at high pH values, the components of crude oil present greater ionization, forming anionic surfactants that reduce the IFT. It was found that the contact angle also decreases as the pH increases. They reported that, in the same system, when pH=6, the contact angle is 42.94°, and when pH=11, the contact angle becomes 32.9°. The results suggest that, under alkaline conditions, the rock is more hydrophilic. The studies also proposed that saponification reaction occurs in the system to generate natural surfactant that would modify the IFT and wettability of the rock.
2.4. Effluent ion analysis
Ion analysis was conducted on the effluents obtained at each stage. The initial concentration of strontium in the injection of LSW10% was approximately 1 mg/L and served as an internal standard. Table 5 presents the ion concentrations of the influent (injected brine) and the effluent.
Table 5. Ion concentrations |
| Brine | Concentration/(mg•L-1) | ||||||
|---|---|---|---|---|---|---|---|
| Ca2+ | Mg2+ | Mn2+ | Na+ | Sr2+ | Ba2+ | Fe2+ | |
| SW in | 382 | 1283 | <0.05 | 9308 | 8.0 | <0.20 | <0.10 |
| SW ef | 874 | 1270 | 5.39 | 11 147 | 9.0 | 0.53 | <0.04 |
| LSW10% in | 43 | 137 | <0.02 | 1095 | 0.8 | <0.20 | <0.04 |
| LSW10% ef | 204 | 108 | 0.66 | 1183 | 1.4 | 0.56 | <0.04 |
| LSW10%+S0.1% in | 43 | 142 | 0.02 | 1215 | 0.8 | <0.20 | <0.89 |
| LSW10%+S0.1% ef | 257 | 68 | 0.82 | 1205 | 1.4 | 0.37 | <0.04 |
| LSW10%+S0.2% in | 43 | 137 | <0.02 | 1279 | 0.8 | <0.20 | <0.20 |
| LSW10%+S0.2% ef | 216 | 83 | 0.89 | 1287 | 1.3 | 0.34 | 0.11 |
Note: in= influent, ef= effluent |
In the SW stage, there was no significant variation for Sr2+, Ba2+, Fe2+, and Mg2+; however, a significant increase was detected in Ca2+ and Na+. In the LSW10% and LSW10% + surfactant stages, the concentrations of Sr2+, Ba2+, and Fe2+ remained less than 1.5 mg/L, with no visible difference between the influents and the effluents. The Na+ concentration in the effluent was slightly higher than that in the influent in case of LSW10%, but did not present a significant variation in case of LSW10% + surfactant. In contrast, the concentrations of Ca2+ and Mg2+ became remarkably different. Specifically, in all brines, the Ca2+ concentration increased, while the Mg2+ concentration decreased.
According to the multicomponent ion exchange (MIE) mechanism proposed by Lager et al. [8], LSW injection in sandstone rocks can cause the replacement of divalent ions. These authors found that the effluents presented a reduction of Ca2+ and Mg2+ from the concentrations in the injected brine. Therefore, they postulated that divalent ions are absorbed by the rock through an ion exchange process. Instead, Alagic et al. [42] found that Ca2+ was significantly washed out of the cores, while Mg2+ was retained. They explained that calcite dissolution was responsible for the Ca2+ increase. Al-Saedi et al. [48] reported on the presence of Ca2+ in the effluents when the injected water did not contain Ca2+ during experiments with LSW and sandstone. They suggested the desorption of Ca2+, caused by ionic exchange between H +, Ca2+ and Na+ on the rock surface. In our case, a significant increase in Ca2+ was found in all stages and not only in the injection of LSW10%.
Other authors have described that clays function as cation exchangers for Ca2+, Mg2+, K+ and Na+ [40]. Gasco et al. [49] evaluated the affinity of clays, specifically kaolinite, for divalent ions. They observed that a lower ionic radius increases the affinity for the surface of the clay, and thus concluded that Ca2+ has a lower affinity and is expelled from the rock surface, while Mg2+ is retained. Another explanation for the increase in Ca2+ is the dissolution of the porous media. The desorption of Ca2+ would occur by the imbalance caused by LSW in the system [3]. The results of this work show that there is an ionic exchange between the brine and the rock.
2.5. Chromatographic analysis of crude oil
The recovered oil fractions were analyzed by the fractional distillation technique. Fig. 7 shows the profile of the original oil and the oil recovered at each stage. In general, after injection of SW, the oil recovered presents a similar profile with the original oil. However, the fractions collected in the injection of LSW10% present a decrease in light fractions C9-C14, and a redistribution towards heavier fractions. Additionally, the profile of the oil collected in the stage with LSW10% + S0.1% presents the same behavior as the stage with LSW10%. This indicates that the interaction between oil and LSW10% causes modifications in the crude oil components, but the addition of the surfactant does not alter the components of the oil. According to the salting-out theory, the solubility of organic matter in water increases in low salinity conditions, and polar fractions can dissolve in water, which would explain the changes in the light fractions of the oil recovered in the LSW10% stage [30].
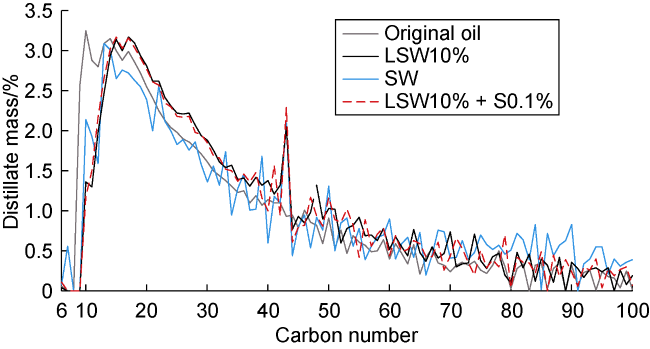
Fig. 7. Analysis of the oil fractions collected after core- flooding by fractional distillation chromatography. |
Additionally, the composition of the brine can change the equilibria at the water-oil interface. Yang et al. [50] suggested that organic acids in the oil can be absorbed by the surface of the clays, through calcium bridges. However, the addition of LSW can generate imbalances between the carboxyl groups of the acids and the clay surface. The electrostatic interactions would cause the calcium bridge to break, so that the oil is released. Chakravarty et al. [51] proposed that LSW can react with oil to form microemulsion, which would alter the fluid-fluid interaction; however, the formation of the emulsion depends on the compositions of the brine and the oil.
2.6. Tomographic analysis
2.6.1. Evaluation of residual oil saturation
For each series, 41 CT images were obtained, each one equivalent to a spacing of 3 mm along the core. The images are numbered 1-41, from the injection end to the recovery end. As shown in Fig. 8 , the CT value presents slight variations; therefore, the core is fairly homogeneous.
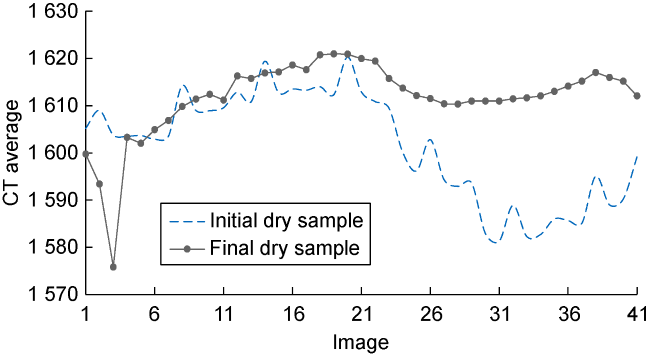
Fig. 8. CT distribution of initial dry samples and final dry samples after core-flooding and washing. |
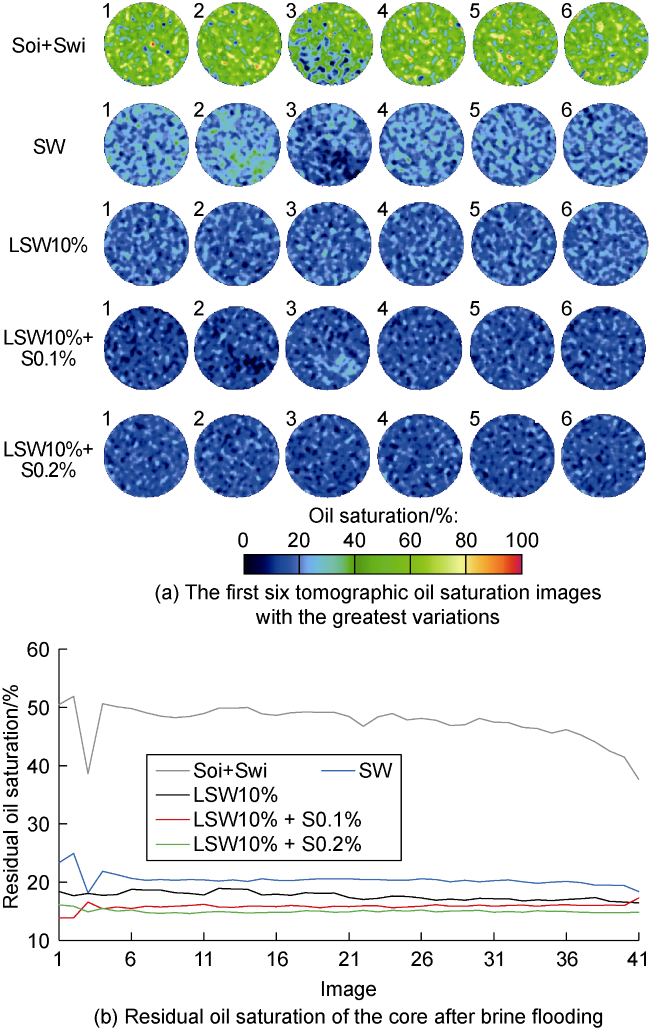
Fig. 9. Oil saturation at the end of injection stages. |

Fig. 10. Sweep efficiency by stages. |
2.6.2. Porosity analysis
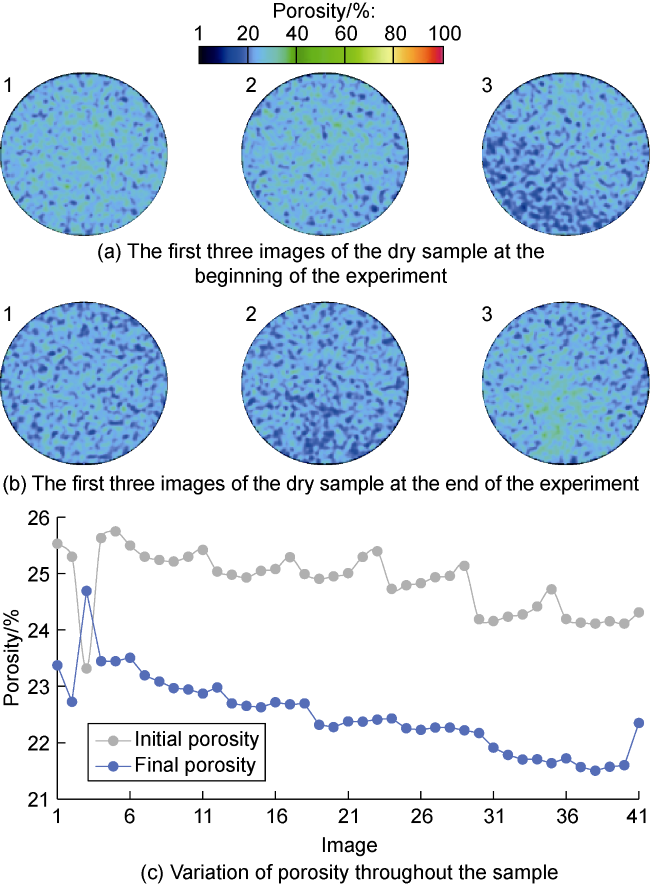
At the end of the core-flooding experiment, the core was washed with solvent and the tomographic analysis of the dry sample was conducted. Fig. 8 shows the CT distribution of the initial and final dry samples. The images of the sample, after washing, show a notable CT decrease in image 3 and a slight increase in the last section of the sample. This suggests that material was deposited in this zone. A special case is the area corresponding to image 3, with a CT value of 1575.83. This area presents a decrease in CT compared with the value (1603.82) of the same image for the initial dry samples, which can be explained by alteration of the rock. It is suggested that material migrated from this area and was deposited throughout the core.
Additionally, the porosity was evaluated at the beginning and end of the experiment, to determine the variation for the entire sample by subtracting the images of the saturated series with respect to the dry series. Fig. 11 shows the distribution of the initial and final porosity of the sample. Only the first three images are shown as they present relevant differences (Fig. 11a and 11b ), and the porosity profile of the entire sample is displayed (Fig. 11c ). The core presents a decrease in porosity from 24.8% to 22.5% at the end of the experiment. A special case is the area of image 3, in the lower middle part of which the initial porosity is approximately 18% and increases to 30% after the experiment. This indicates more pore space, probably due to the dissolution of some materials. In general, the porosity gradually decreases throughout the sample, which can be explained by the reduction in pore space due to the deposition of fines.
Fig. 11. Porosity analysis. |
To the best of our knowledge, this is the first work conducted on the hybrid system with LSW and surfactant for oil displacement aided by tomographic analysis. It provides an approach to understand the phenomena inside the system during displacement. Fines were not found in the effluents of any of the injected brines; however, tomographic analysis suggests that mineral dissolution and fines migration occurred in the present experiment.
Pu et al. [7] indicated that anhydrite can be dissolved when interacting with LSW. In the specific case of the present work, the characterization of the rock shows a high feldspate content, including albite (31%) and anorthite (30%), and the porous media did not contain kaolinite. As reported by Hadia et al. [33], these minerals can react with LSW10% and dissolve (Eq. (3)), which explains the porosity increase. Moreover, the increase in the pH of the effluents may be additional evidence for such reaction.
Fogden et al. [52] highlighted the positive effects of rock dissolution, as the oil adhered to the fines is mobilized, but these particles can also be incorporated throughout the porous media, reducing porosity. Awolayo et al. [53] mentioned that the migration of fines can also cause fluid redirection, resulting in a better sweep of oil. Recovery can also be favored due to rock dissolution which results in the exposure of underlying surfaces and the changes in wettability [34]. Additionally, as described by other reports [47], our work demonstrates that the presence of kaolinite is not necessary for the oil recovery with LSW flooding.
3. Conclusions
This paper presents a hybrid low salinity water and surfactant process as an alternative for oil recovery. This process achieved an increase of 11.4 percentage points in OOIP in the experiment for a complex system including heavy oil, with a low acid number and a porous media from a reservoir with low quartz content. The results show that some conditions are not necessary for oil recovery with LSW, such as the presence of kaolinite in the porous media, or oil with a high acid number.
The experimental evidence from this study shows that, during LSW10% flooding, various phenomena occurred, such as wettability alternation, mineral dissolution, fines migration, ionic exchange, pH change, and modification of oil composition. Therefore, the addition of LSW favors changes in the balances in the oil/rock/brine system. Moreover, multiple mechanisms occur in LSW process. However, not all mechanisms will be present in all systems, since the different phenomena will depend on the properties of the rocks, brines, crude oil, and environmental conditions, such as pH, temperature, and interaction time. Furthermore, these mechanisms act in a synergistic way.
During surfactant injection, IFT reduction and wettability alternation are the main mechanisms involved in the EOR process. In addition, tomographic analysis can provide information that allows a better understanding of the phenomena inside the core during the flooding experiment.
The hybrid process has the potential to be applied to heavy oils. However, given the complexity of the systems, more experimental work with materials from the reservoir is critically needed to have a better understanding of the mechanisms. Therefore, for each field, specific experimental design is required to assess the feasibility of the process on a larger scale.