

Introduction
Horizontal well fracturing technology on a large scale maximizes the contact area between the wellbore and the reservoir, which enhances fluid flow and makes it an essential cost-effective method for producing unconventional oil and gas reservoirs [1]. During the fracturing process of unconventional oil and gas reservoirs, the monitoring system automatically records the raw fracturing data [2], such as pressure, pump rate, proppant concentration, etc. The hydraulic fracturing treatment plot, generated from pumping data measurements, is used by the operation team to manually identify and evaluate different events that occur during the fracturing process. By analyzing the curve characteristics at different time intervals, the operators can diagnose operational and formation conditions, fracture characteristics, and promptly adjust the design parameters of the fracturing process. This approach helps to optimize and control the fracturing process [3-4].
Horizontal fracturing of unconventional oil and gas reservoirs offers several advantages over vertical well fracturing, including a larger oil drainage area, better activation of natural fractures, and greater utilization of the pay zone [5]. However, the extent of formation stimulation created by horizontal fracturing may be significantly different in different wells, sections, and layers due to various factors such as reservoir heterogeneity, natural fracture development, and operation conditions. The fracturing process in unconventional reservoirs is complicated and involves multiple fracturing events [6-7] due to the large number of fracturing stages, the extensive amount of total fracturing data, and the discontinuous nature of surface pressure/rate data. As a result, the highly variable fracture treatment plot contains a substantial amount of unexplained information, making it difficult to effectively identify various types of complex events. Many scholars believe that accurate and efficient identification of various events occurring during fracturing is the key to ensuring the efficiency and quality of each fracturing stage [8⇓⇓-11]. Traditional methods of fracturing events identification include the manual identification, the empirical fracturing curve analysis, and the curve matching method using numerical simulation. The manual identification method is simple, but the huge amount of data generated during fracturing operations imposes significant difficulty to manual identification, which severely reduces the efficiency and accuracy of event identification. In response, many scholars have sought to improve fracturing event identification by establishing the fracturing learning curve [12-13]. However, the process of establishing the fracturing learning curve is time-consuming and requires a significant amount of human experience. The accuracy and efficiency of event learning and identification rely heavily on the accumulation of previous experience and operator proficiency. Meanwhile, curve matching method based on numerical simulation calls for the development of a reliable numerical simulation model, which is usually time-consuming. This method also requires continuous parameter adjustments that can lead to significant randomness, resulting in limited event identification accuracy [14⇓-16]. To conclude, it is challenging to balance the efficiency and accuracy of identifying multiple types of events during fracturing using current methods. Therefore, there is an urgent need to establish an efficient and accurate method for automatic fracturing event identification.
Various methods have been developed for the real-time risk warning systems for hydraulic fracturing using big data analysis and machine learning methods. One approach involves building a fracturing well database to analyze fracturing parameters and establish a real-time warning model using the neural networks. This model is trained on a large set of monitored data to predict the risk for current or future fracturing conditions, with a focus on sand plugging risk [17⇓⇓-20]. Another method involves combining an abnormal pressure data set with the random forest algorithm to establish a fracture risk classification model. Real-time pressure data is then compared with abnormal pressure data to diagnose casing failures and calculate the probability of event occurrence[21]. A third approach integrates risk characterization parameters into a Bayesian network to establish a real-time risk warning model, which predicts the probability of downhole failure during the fracturing process[22]. However, the intelligent real-time warning method for simultaneously identifying multiple types of fracturing events is still at the starting stage. It is urgent to establish an efficient and accurate real-time warning method for all types of events during the fracturing process, in order to realize the real-time warning for all event types and ensure efficient fracturing operation can be conducted.
Machine learning methods can extract useful information, and establish effective mathematical models, or even identify physical constitutive relationships through data analysis [23-24]. These methods have been widely applied in oil and gas reservoir development [25⇓⇓-28]. Based on the analysis of on-site data and reports of multistage horizontal well fracturing in shale gas reservoirs, this paper proposes an intelligent identification and real-time warning method for multiple types of fracturing events using improved deep learning algorithms.
1. Multiple type events during multistage fracturing of horizontal wells
As shown in Fig. 1 , an intelligent identification and real-time warning method for multiple types of events during the horizontal well fracturing process is established, and the method consists of three different models. Firstly, the “point” event identification model of the fracturing process is established based on the attention-based bidirectional long short-term memory neural network (Att-BiLSTM) in conjunction with the Broad Learning System (BLS) [29] and the Backpropagation neural network (BP) to intelligently identify the start/end of fracturing, formation breakdown, and instantaneous shut-in. Then, based on the pressure and pump rate curves, the U-net++ is adopted to establish the “phase” event identification model to automatically identify the operational events including ball pumping, temporary plugging fracturing, sand plugging, and pre-frac acid treatment; Finally, the real-time pressure prediction model based on the AttBiLSTM network is developed, and the predicted pressure data are used as inputs to feed the “point” model and the “phase” model to achieve the intelligent identification and real-time warning of multiple types of events in the fracturing process.
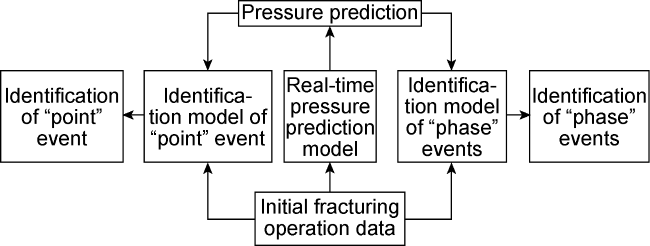
Fig. 1. Workflow of auto-identification and real-time warning methods for multiple types of complex events during horizontal well fracturing. |
In this study, with a shale gas field in the Sichuan Basin in Southwest China as an example, we studied the intelligent identification and real-time warning of multi-type events during multi-stage horizontal well fracturing. The shale gas reservoir in this region is characterized by high heterogeneity, low porosity, and low permeability. Horizontal well fracturing has been prevalently used to exploit the shale formation in this region. However, due to the various factors such as natural fracture development, neighboring well fracturing, wellbore interference, stress interference between wells, drilling contamination, and casing deformation, the fracturing conditions are very complicated, and vary significantly for different intervals and different wells. Considering that the maximum number of fracturing stages in a single well is over 30, and there are hundreds of thousands of fracturing data, manually identifying the complex fracturing events is time-consuming, labor-intensive, and inaccurate. Based on the fracturing operation data and fracturing reports of 200 intervals in the horizontal wells in this study block, we selected 7 typical events that frequently occur during the fracturing process as the study targets. A sample database of multi-type events during the fracturing process has been established and analyzed. The database comprises approximately 3×10⁶ time-stamps. The number of occurrences for 7 typical events is: 134 times for ball pumping, 42 times for temporary plugging fracturing, 200 times for start/end of fracturing, 200 times for formation breakdown, 200 times for instantaneous shut-in, 68 times for pre-frac acid treatment, and 26 times for sand plugging. Considering the specific characteristics of each event, the seven types of fracturing events are divided into two categories: “point” events (including the start/end of fracturing, formation breakdown, and instantaneous shut-in) and “phase” events (including the pumping ball, temporary plugging fracturing, pre-frac acid treatment, and sand plugging).
1.1. “Point” events in fracturing
“Point” events refer to the discrete events that occur at some point during the fracturing process and there is no duration during fracturing operation. These events are represented as points on a hydraulic fracturing treatment plot, including the start/end of fracturing, formation breakdown, and instantaneous shut-in (Fig. 2 ).
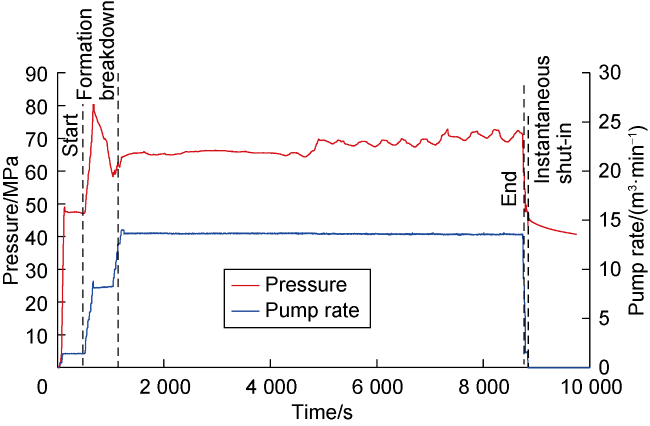
Fig. 2. “Point” events in a hydraulic fracturing curve. |
Fracturing start time and end time are mainly used to determine the various parameters during the fracturing process, including total fracturing duration, average pressure, maximum pressure, pump rate, sand concentration, cumulative fluid volume, and pumping time.
The formation breakdown pressure is a crucial parameter for reservoir monitoring, which is an important indicator for determination of the upper limit of the pressure and geometry of the resulted hydraulic fractures. It is an important parameter to guide and optimize fracturing design [30].
The instantaneous shut-in pressure represents the difference between the final pumping pressure and the pressure drop, and can be utilized to calculate the minimum fracture propagation pressure. It also reflects the upper limit of the minimum horizontal principal stress, which has a direct impact on the fracture geometry [31].
Accurately identifying point events such as the start/end of fracturing, formation breakdown, and instantaneous shut-in pressure can help us to improve the understanding of the reservoir and the fracturing process.
1.2. “Phase” events in fracturing
Different from “point” events, “phase” events are represented as a duration rather than a point on the hydraulic fracturing treatment plot, because they occur continuously over a period. “Phase” events include pumping ball, temporary plugging fracturing, pre-frac acid treatment, and sand plugging (Fig. 3 ).
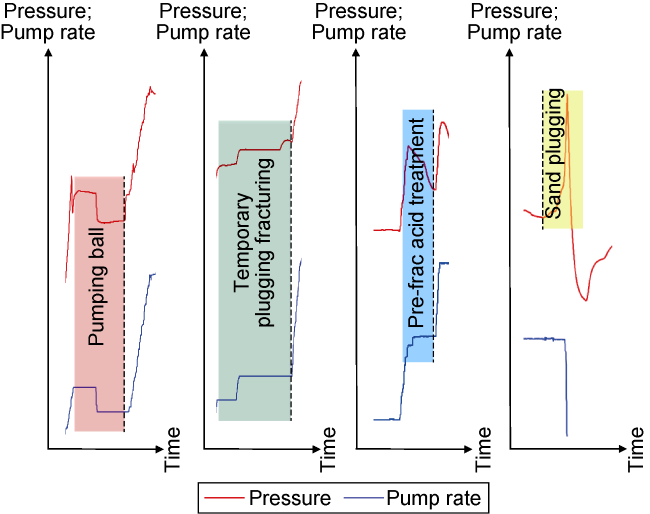
Fig. 3. “Phase” events in different hydraulic fracturing curves. |
In bridge plug fracturing, the fracturing process starts when the frac ball reaches the surface of the ball seat, the increase of wellbore pressure creates a pressure differential that forces the perforations to expand in all directions. Accurately identifying frac ball pumping events is an important task in pumping data analysis.
If the casing is deformed and the bridge plug cannot be pumped to the designated position, the fracturing ball cannot control the pump rate in the pre-fracturing stage, then the temporary plugging fracturing completes the fracturing of the fractured layer to improve the fracture uniformity between different stages and the efficiency of fracturing operations, it also helps to control the pump rate to prevent the aggravation of casing deformation [32].
At the pre-fracturing stage, pre-treatment by pumping hydrochloric acid can effectively alleviate drilling contamination and perforation damage in the near-wellbore formation, reduce the breakdown pressure and initial pumping pressure, and re-establish the pump rate [33].
Sand plugging event is significantly detrimental to the fracturing operation and force the operator to delay the fracturing operations, and perform long-term diagnosis and treatment for the potential problems by sand plugging, thus resulting in delay to the subsequent operations and increase in cost [34].
Therefore, accurately identifying events such as pumping ball, temporary plugging fracturing, pre-frac acid treatment, and sand plugging can help us to better understand the fracturing process, as well as improve the judgment of operators and the efficiency of decision making in subsequent fracturing operations.
2. Identification model of “point” events during fracturing
To avoid the potential problems of manual identification, in this study, we constructed a “point” event identification model for fracturing process based on the deep learning method, aiming at automatically identifying the “point” events in fracturing, such as the start/end of fracturing, formation breakdown, and instantaneous shut-in.
2.1. Sample processing of fracturing “point” events data
When multiple types of events occur during the fracturing process, the operation pressure and pump rate curves often exhibit specific responses that are distinct for each event. Therefore, based on the operation pressure and pump rate, and using calculation steps of size 5, 10, and 15 respectively according to Eqs. (1)-(3), we calculated the mean, deviation, and average rate of change as extended parameters. All required input parameters are shown in Table 1 .
$\frac{\Delta f}{\Delta t}=\left\{\begin{array}{cc} 0 & i=1 \\ \frac{f\left(t_{i}\right)-f\left(t_{1}\right)}{t_{i}-t_{1}} & 1<i<j \\ \frac{f\left(t_{i}\right)-f\left(t_{i-j+1}\right)}{t_{i}-t_{i-j+1}} & j<i \leq N \end{array}\right.$
$\overline{f\left(t_{i}\right)}=\left\{\begin{array}{ll} f\left(t_{1}\right) & i=1 \\ \overline{f\left(t_{i}\right)} & 1<i \leq N \end{array}\right.$
$d\left(t_{i}\right)=\left\{\begin{array}{cc} 0 & i=1 \\ f\left(t_{i}\right)-\overline{f\left(t_{i}\right)} & 1<i \leq N \end{array}\right.$
Table 1. Model input parameters |
| Parameter | Unit | Parameter attribute |
|---|---|---|
| Time | s | Original parameter |
| Pressure | MPa | Original parameter |
| Pump rate | m3/s | Original parameter |
| Mean pressure | MPa | Extended parameter |
| Mean pump rate | m3/s | Extended parameter |
| Pressure deviation | MPa | Extended parameter |
| Pump rate deviation | m3/s | Extended parameter |
| Average rate of change of pressure (j=5) | MPa/s | Extended parameter |
| Average rate of change of pump rate (j=5) | m3/s2 | Extended parameter |
| Average rate of change of pressure (j=10) | MPa/s | Extended parameter |
| Average rate of change of pump rate (j=10) | m3/s2 | Extended parameter |
| Average rate of change of pressure (j=15) | MPa/s | Extended parameter |
| Average rate of change of pump rate (j=15) | m3/s2 | Extended parameter |
The time periods before the start of fracturing, between the start of fracturing and the formation breakdown, between the formation breakdown and the end of fracturing, between the end of fracturing and the instantaneous shut-in, and after the instantaneous shut-in time were classified as 0, 1, 2, 3, and 0, respectively. Based on this classification, the time stamps in the operation data are manually labeled, i.e., the fracturing event identification model can identify different events by searching for labels 0, 1, 2, and 3. The average filter with the size of 35 was used to smooth various parameters and reduce data noise. The standard scaler function is used to eliminate the adverse effects caused by singular sample data and speed up the calculation; then, a sliding window of size 15 is used for data sampling (Fig. 4 ). The moving direction of the sliding window is the direction of increasing time, and the moving step is 1 s. By taking the data in the window as the sample matrix xi, and at the same time taking the category corresponding to the last row of data in the sample matrix as the label, yi, of the current sample matrix, a sample point (xi, yi) is created, where the sample matrix xi is the input of the model, and yi is the true category corresponding to the sample matrix xi. All the sample points are used to form a “point” event data set, which is randomly divided into training set and testing set with a proportion of 9:1.
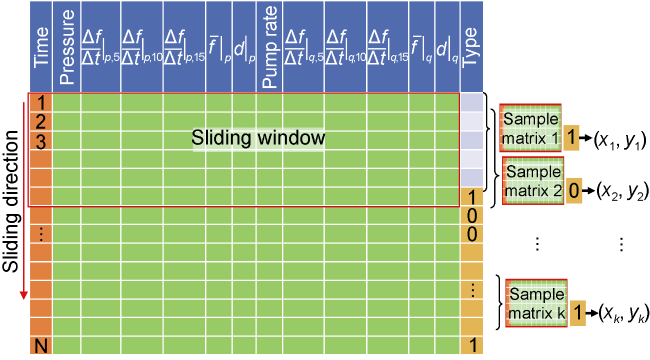
Fig. 4. Sliding window sampling and sample matrix label. |
2.2. Development of the “point” event model
The proposed approach involves the development of a novel “point” event identification model for the fracturing process based on the AttBiLSTM network, and the specific workflow is illustrated in Fig. 5 .
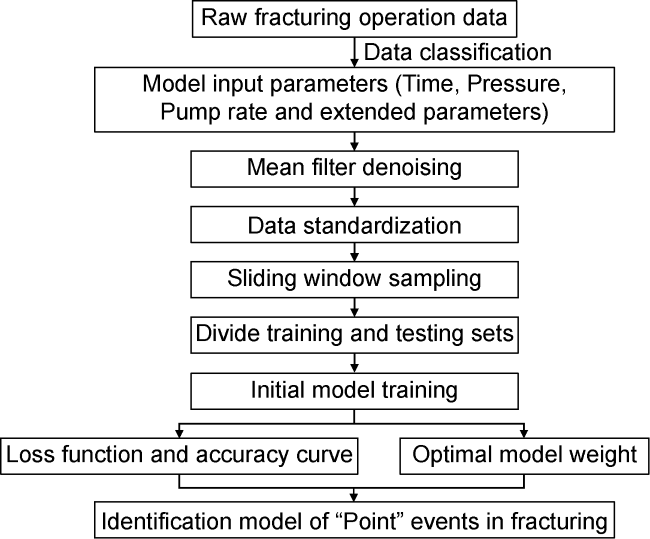
Fig. 5. Workflow of the “point” events identification model. |
This model comprises the BP-BLS structure and the AttBiLSTM network structure. The BP structure generates/updates the weight of the input matrix by two BP nets, in which the number of neurons of the hidden layer is 13 and 26, respectively. This structure generates one feature node and one enhanced node, and then concatenates the original input matrix with the two nodes as the final output, and it not only ensures the completeness of the data information but also enhances the effective information in the original input. The AttBiLSTM structure is mainly composed of the Bi-directional Long Short- Term Memory network (BiLSTM) with 128 neurons and the Attention Mechanism layer. The former addresses the disadvantage that traditional LSTM cannot encode information backward by splicing forward and reverse outputs in the LSTM, and ensures the transmission of effective information in data; The latter uses the Soft Attention of weighted summation to automatically extract information that has a decisive impact on identification from the acquired data after nonlinear activation of the input data.
2.3. Effectiveness of the “point” event model in identification
(1) Model training: The dimension of the input data is 15×13, the model is trained with 100 iterations, a batch size of 1050 samples per training, a learning rate of 0.000 1, and a learning rate decay rate of 0.92.
(2) Model evaluation: To assess the accuracy of the model, the cross-entropy loss function is used to calculate the error between the predicted and true classifications, while the time-stamp accuracy is used to determine the accuracy of the model. The model achieved a relative error of loss function less than 3% (Fig. 6 ) and an accuracy exceeding 97% (Fig. 7 ).
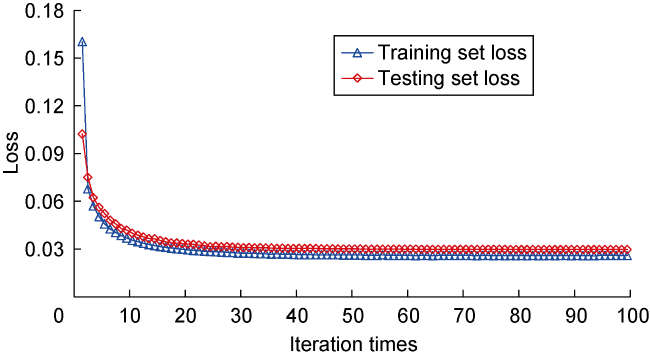
Fig. 6. Iterative training loss of the “point” event identification model. |
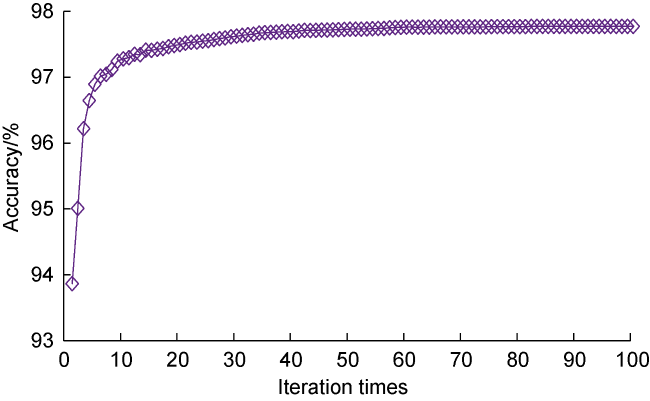
Fig. 7. Training accuracy of the “point” event identification model. |
(3) Output label result: Classification results output for 0→1 (start of hydraulic fracturing) are 80, for 1→2 (formation breakdown) are 90, for 2→3 (end of hydraulic fracturing) are 70, for 3→0 (instantaneous shut-in) are 60, and all other cases output zero. The identification results are shown in Fig. 8 .
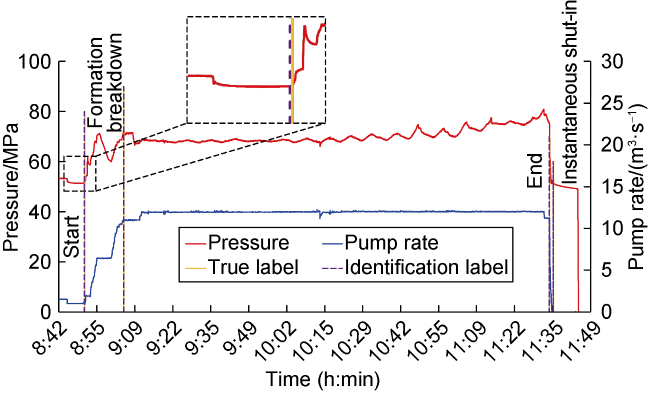
Fig. 8. Identification result of the “point” identification model. |
3. Identification model of “phase” events during fracturing
Unlike “point” events, the phase events such as ball, pumping temporary plugging fracturing, pre-frac acid treatment and sand plugging during the hydraulic fracturing process last for a period of time. The beginning (or end) of each event has a special meaning. Therefore, accurate identification of “phase” events is extremely important. In this study, we established an intelligent identification model for “phase” events during hydraulic fracturing process based on the pressure vs. pump rate plot.
3.1. Sample processing of “phase” events data during fracturing
To feed the model, we create a pressure vs. pump rate plot using the pressure and pump rate data. Each graph in the plot is assigned with one or multiple “masks” represented by different colors, which indicate the duration of the corresponding event(s). As illustrated in Fig. 3 , each event is represented by a distinct mask on the pressure vs. pump rate plot. Specifically, the red mask corresponds to the pumping ball event, and the dotted line indicates the impact of fracturing ball on the ball seat. The green mask represents the temporary plugging fracturing, with the line indicating the role of the temporary plugging material. The blue mask denotes the pre-frac acid treatment, and the line indicates a pressure drop to the limit. Finally, the yellow mask corresponds to the sand plugging event, and the line indicates the start time of sand plugging. The proposed model identifies these events by assigning different masks to the pressure vs. pump rate plot. To train the model, all plot images are randomly split into a training set and a testing set in a 9:1 proportion. Due to the scarcity of temporary plugging fracturing and sand plugging events in the dataset, we use data augmentation techniques to increase the sample size and enhance the event characteristics.
3.2. Development of the “Phase” event model
The U-net++ network [35] is used to achieve intelligent identification of phase events such as ball pumping, temporary plugging fracturing, pre-frac acid depressor event and sand plugging. The workflow of the “phase” events identification model is shown in Fig. 9 . There are three main structures in U-net++. (1) The encoded down-sampling structure, and it can perform feature extraction and dimensionality reduction of the pressure vs. pump rate plots through the 2D convolution and the max pooling. (2) The decoding up-sampling structure. Through deconvolution and convolution operations, the original dimension of the images can be restored, and can ensure that the sizes of the input and output images are consistent. (3) The skip connection structure. By using the characteristic image resulted from the encoded down-sampling operation of each stage, we can reduce the loss of important features of the plot. The U-Net++ model is capable of extracting the features of previous result information using skip connections during the calculation process. With this model, we can realize information fusion through the feature superposition method, effectively minimizing the loss of important information in the feature map during calculation and thereby improving the identification accuracy.
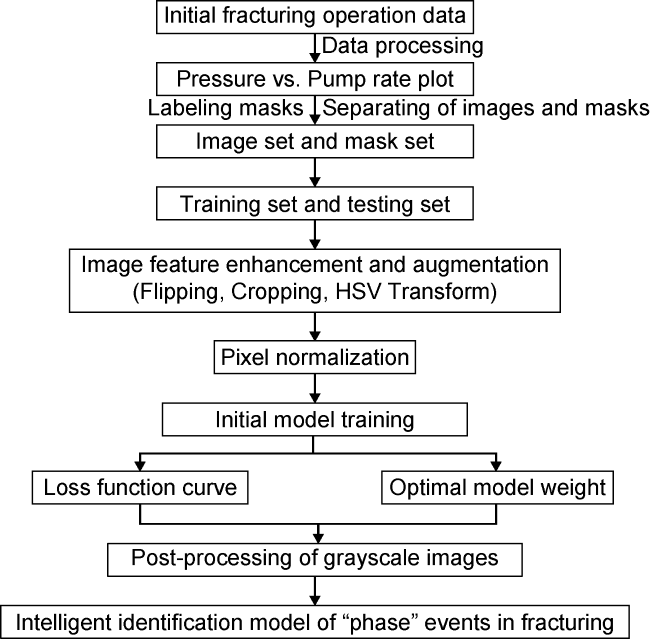
Fig. 9. Workflow of the “phase” events identification model. |
3.3. Identification effect of the “phase” event model in fracturing
(1) Model training: The dimension of the input data was 256×256, the model was trained with 2000 iterations, with a batch size of 10, a maximum learning rate of 0.000 1, and a minimum learning rate is the maximum learning rate multiplied by 0.01. In this model, the cos learning rate decline method was used, and the learning rate is adaptively adjusted based on the batch size.
(2) Model evaluation: Based on the training set and testing set, the model accuracy was evaluated using the multi-class F1-score and Cross-Entropy loss function, where the F1-score is the harmonic mean of precision and recall, and the multi-class F1-score is the arithmetic mean of F1-scores for all categories.
(3) Identification result: The average multi-class F1-score of the training set and testing set was 0.98, and the relative error of the cross-entropy loss function was less than 0.2% (Fig. 10 ), indicating that the model performance was well. However, the edge of the mask was found to be severely jagged. To address this issue, different threshold values were used for event identification (70% for the ball pumping and 50% for other events) to automatically alleviate the jagged shape of the mask edges (Fig. 11 ).
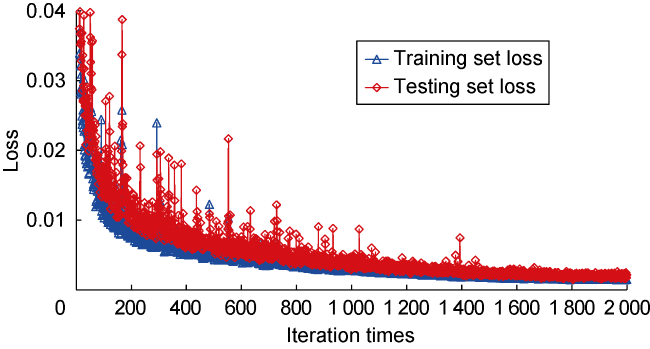
Fig. 10. Iterative training loss of the “phase” event identification model. |
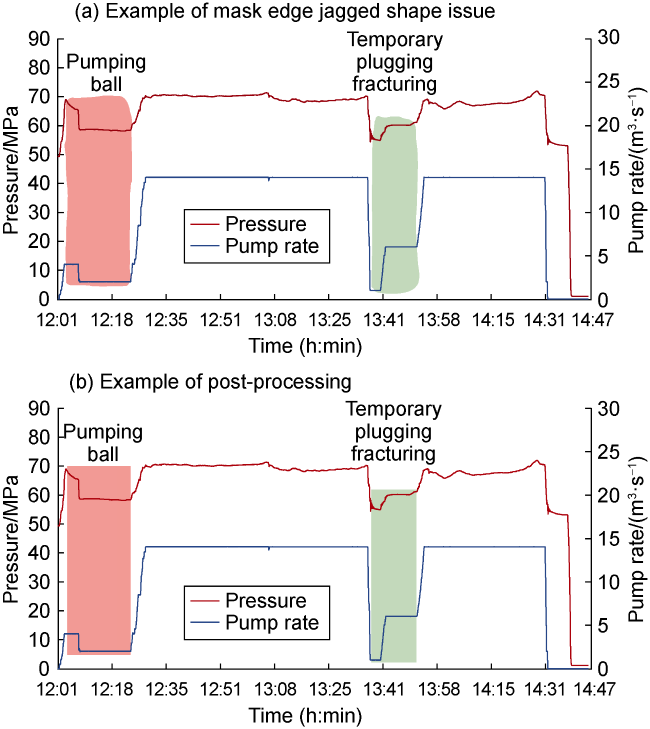
Fig. 11. The post-processing effect of mask edge jagged shape issues. |
4. Real-time warning model of multiple type events in fracturing
Given the intricate nature of fracturing operations, field operators typically have to deal with potential problems caused by various events in a prompt manner. The inherent latency of recognizing the signs of such events could cause severe consequences. Hence, it is imperative to establish real-time warning and identification systems for different types of events in fracturing operations so that prompt predictive ability can be taken.
4.1. Sample processing for real-time warning of fracturing events
Pressure change is a crucial parameter for identifying different types of events during the fracturing process. The research results indicate that pressure anomalies are closely linked to operating conditions, geological factors, and fracturing facilities. The pressure change is often accompanied by change in pump rate and proppant concentration [36]. Therefore, to realize real-time warning of fracturing events, it is essential to first predict the real-time pressure change and subsequently identify the corresponding fracturing events using an appropriate event identification model.
Using the Att-BiLSTM neural network, a real-time pressure prediction model for the fracturing process has been established. The input parameters of the model are shown in Table 1 , which include 13 categories of features. The output parameter is pressure. Data preprocessing is achieved using a mean filter and MinMaxScaler function normalization technique. The By using the maximum and minimum pressure, the pressure can be normalized (i.e., the normalized pressure is obtained by dividing the difference between the pressure and the minimum pressure by the difference between the maximum and minimum pressures) to improve the convergence speed of the model.
The input data is sampled using a sliding window of size 60, and the sampled data is randomly divided into a training set and test set in a ratio of 9:1.
4.2. Development of the real-time pressure prediction model in fracturing
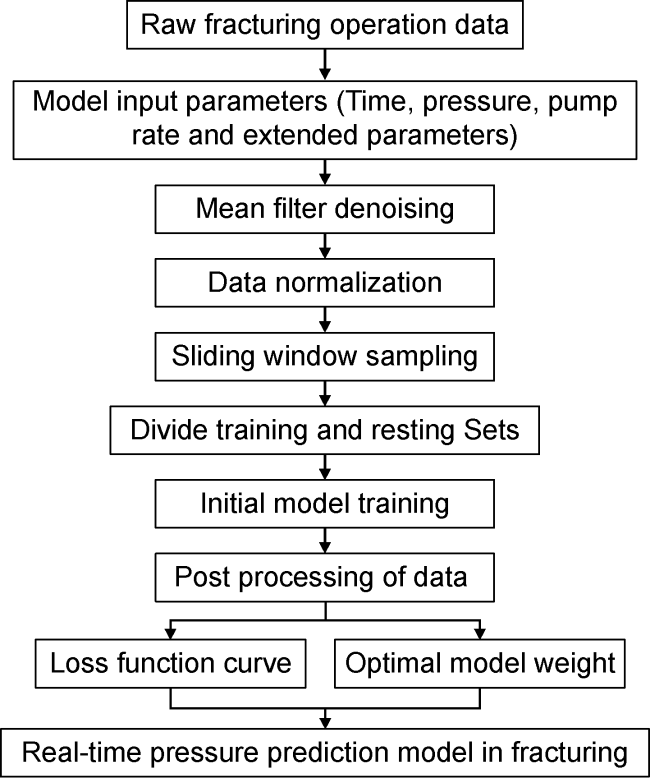
Fig. 12. Workflow of the real-time pressure prediction model. |
4.3. Predictive result of a real-time pressure prediction model in fracturing
(1) Model training and evaluation: The dimension of input data is 60×13, and the model is trained with 300 iterations and a batch size of 50. The Adam optimizer with a learning rate of 0.000 1 is used to minimize the loss. The model loss function relative error is less than 2% (Fig. 13 ).
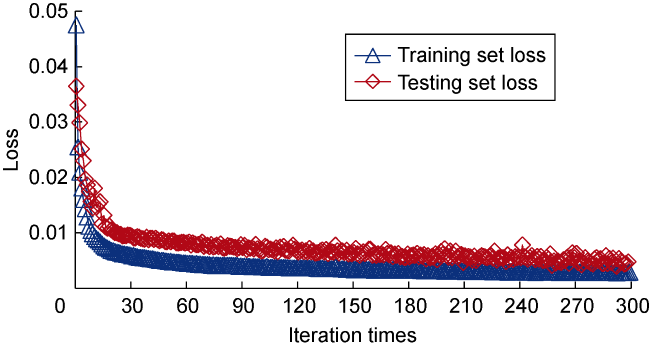
Fig. 13. Iterative training loss of the real-time pressure prediction model. |
(2) Data post-processing: Post-processing of the pressure prediction data for each time step was done using a mean filter with a window of 5. Fig. 14 shows the match result between the predicted and actual pressure values for the following 30 s after the 100th and 570th seconds during the fracturing process. The pressure prediction accuracy is above 97%.
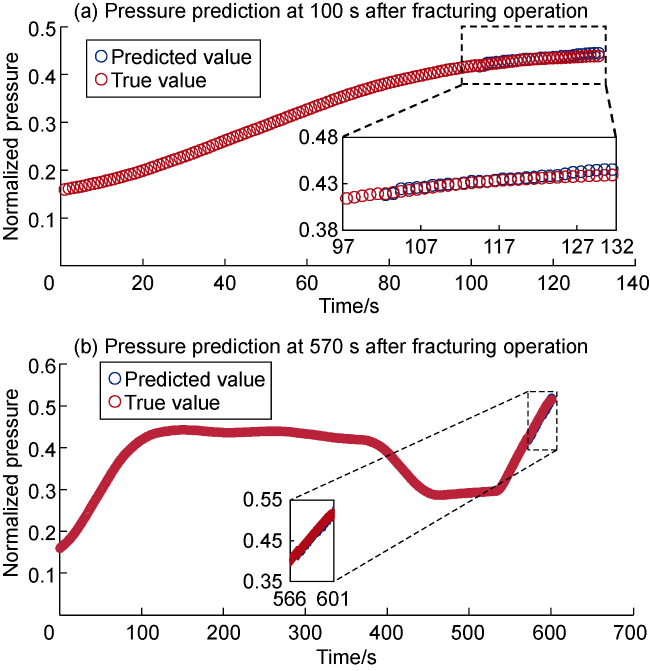
Fig. 14. Prediction of early pressure change during fracturing. |
4.4. Real-time warning model of multiple type events in fracturing
Real-time pressure prediction was carried out based on the initial fracturing data. The “point” and “phase” events were identified separately using the extended parameters and pressure-displacement plots. A real-time warning model for multiple types of fracturing events has been established. The workflow is shown in Fig. 15 .
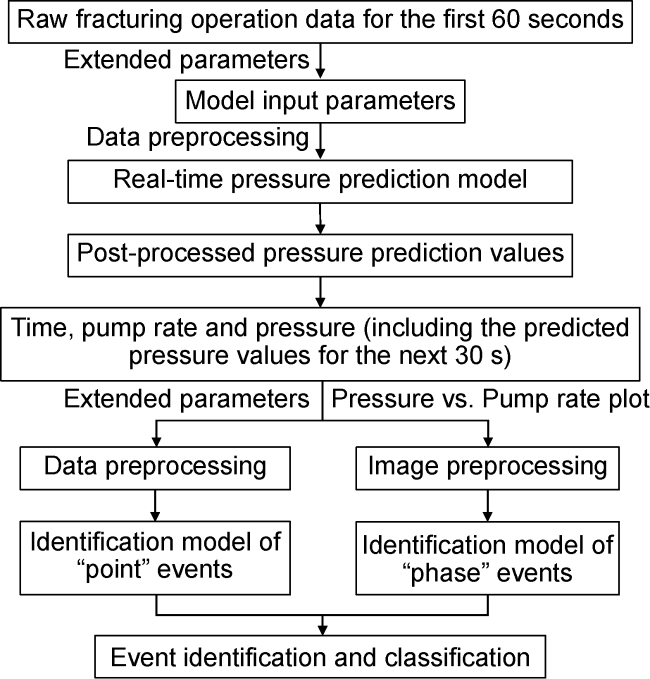
Fig. 15. Workflow of real-time warning model for multiple types of events in fracturing. |
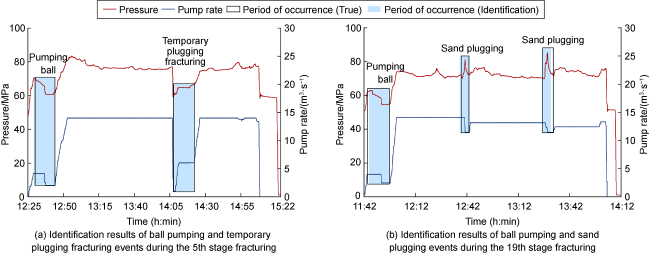
The above model was used to diagnose the fracturing events in a horizontal well in a shale gas reservoir located at the Sichuan Basin. The horizontal well was fractured with 25 stages. The fracturing data include 25 fracturing start/end events, 24 ball pumping events, 10 temporary-plugging fracturing events, 25 formation breakdown events, 25 instantaneous shut-in events, and 6 sand plugging events. If the predicted time when a “point” event occur has an error of less than 30 s compared with the actual time of occurrence, it is considered as correct identification. The identification of “phase” events is based on whether each event is assigned the correct color code mask. The event identification results are shown in Table 2 . The accuracy for each type of event is above 92%. In addition, the average identification accuracy of 234 871 timestamps for the “point” event identification model is 98.78%. Fig. 16 shows the real-time prediction results for the pressure curve and “point” events for the 2nd fracturing stage. Fig. 17 shows the identification results of “phase” events for the 5th and 19th fracturing stages. The accuracy of pressure prediction is 96%, and the accuracy of “point” event warning is 97%. The accuracy of “phase” event warning identification is 100%.
Table 2. Statistical identification results of fracturing events for a typical shale gas well |
| Fracturing events | Number of occurrence | Number of accurately identified events | Accuracy/ % |
|---|---|---|---|
| Start of fracturing | 25 | 23 | 92 |
| Formation breakdown | 25 | 24 | 96 |
| End of fracturing | 25 | 24 | 96 |
| Instantaneous shut-in | 25 | 24 | 96 |
| Pumping ball | 24 | 24 | 100 |
| Sand plugging | 6 | 6 | 100 |
| Temporary plugging fracturing | 10 | 10 | 100 |
| Pre-frac acid treatment | 0 | 0 | 100 |
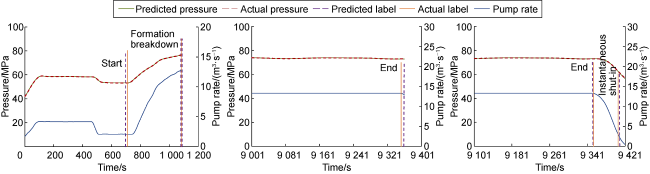
Fig. 16. Identification results of the start/end of fracturing, formation breakdown, and instantaneous shut-in events during the fracturing process of a typical shale gas well. |
Fig. 17. Identification results of ball pumping, temporary plugging fracturing and sand plugging during the fracturing process of a typical shale gas well. |
5. Conclusions
By analyzing the fracturing data and reports of 200 fracture stages of shale gas wells, an intelligent identification and real-time warning method for multiple types of complex events in the fracturing process is developed according to the characteristics of different events. This method can automatically identify “point” events such as the start/end of the fracturing process, formation breakdown, and instantaneous shut-in, as well as “phase” events such as pump ball, pre-frac acid treatment, sand plugging, and temporary plugging fracturing. It can also predict the real-time pressure changes during the fracturing process. The proposed method can significantly improve the efficiency and accuracy of intelligent identification of fracturing events and provide effective warning for the abovementioned events during the entire fracturing process.
Nomenclature
d(ti)—deviation, which is the difference between the parameter data at time ti and the average of the parameters at the previous i time points;
f(t1)—parameter data at the initial time;
f(ti)—parameter data at time ti;
—average value of parameters at the previous i time points;
—average rate of change of parameters over a certain time period;
i—timestamp index;
j—time step size, s;
k—total number of sample points in a fracturing segment of N data points, where k = N - j + 1;
N—number of data points in a fracturing segment, the data points is 1000 when the operation time is 1000 s;
p—pressure, MPa;
q—pump rate, m3/s;
t1—initial time of hydraulic fracturing;
ti—the i-th timestamp during hydraulic fracturing;
xi—a single sample matrix in the model input data;
yi—the true category corresponding to the sample matrix xi.