

Introduction
The extremely low porosity and permeability, strong heterogeneity, and low formation energy of shale oil reservoirs lead to low recovery from depletion development [1⇓-3]. CO2 is easy to inject and can improve the mobility of crude oil [4], so that CO2 injection is widely used to enhance shale oil recovery (CO2-EOR). However, problems such as low CO2 solubility, high minimum miscibility pressure (MMP), poor oil displacement, and serious gas channeling in some shale oil reservoirs result in limited oil recovery enhancement [5-6]. Previous studies proposed a cosolvent-assisted CO2 injection method to achieve high-efficient development of shale oil reservoirs [7-8].
The mechanisms of cosolvent-assisted CO2 injection to enhance oil recovery include promoting the dissolution of CO2 in shale oil, reducing the interfacial tension between oil and gas phases, and enhancing the competitive adsorption between the two phases. Yu et al. found that ether groups can improve the solubility of CO2 in crude oil by molecular simulation [9]. Huang et al. found that the interfacial tension between CO2 and crude oil was effectively reduced by dimethyl ether [10]. Rudyk et al. found that methanol or ethanol can improve oil recovery [11]. Rudyk et al. found that the promoting effect of ketone cosolvents on the extraction of heavy hydrocarbons was stronger than that of alcohol cosolvents [12]. Gao et al. found that the solubility of CO2 in alkanes increases with the increase of ethyl acetate concentration [13]. Good progress has been made in the research of CO2-cosolvent to enhance oil recovery, but the nanopore confinement effect of shale reservoirs has not been considered yet.
The Forcite module (molecular dynamics) in Materials Studio (MS) can perform potential energy and geometric optimization calculations on molecules and periodic systems with high algorithm accuracy. In this study, a nanopore model was established by MS considering the nanopore confinement effect of shale oil reservoirs, and three shale oil systems, five CO2+cosolvent composite systems and pure CO2 system were used to conduct molecular dynamics (MD) simulations. Then the accuracy of the molecular simulation method was verified by experimental data. Finally, the effects of quartz wall, pore size, cosolvents and shale oil components on CO2 displacing shale oil in nanopores were analyzed. The variation of CO2 relative concentration (the ratio of CO2 concentration in a certain area to the CO2 concentration in the whole box) and the interaction energy between rock wall and CO2 were also analyzed to evaluate the storage rate and stability of CO2 in nanopores.
1. Molecular dynamics modeling and verification
1.1. Molecular dynamics modeling
Composite nanopore model: Quartz is widely used in the construction of inorganic wall in molecular simulation studies. In this study, the quartz cell was cleaved along the profile (1 0 0) and extended to construct a supercell to characterize inorganic wall of shale. Because the process of CO2 displacing shale oil is greatly affected by rich organic matter in shale reservoirs, the Type II kerogen (C210H184O20N4S4) constructed by Dr. Huang was selected as organic matter, and the kerogen molecule was geometrically optimized with the polymer consistent force field (PCFF) [14]. Then the Amorphous Cell module was used to construct the initial kerogen wall box, and the MD method was used to optimize its structure. Temperature equilibrium was carried out in canonical ensemble (NVT), and the temperature was set at 323.15 K and controlled by the Nosé-Hoover thermostat [14]. The long-range electrostatic interaction was described by the Ewald summation [9]. The van der Waals interaction was set to Atom based [9]. The cutoff distance is 1.25 nm. Pressure equilibrium was carried out in isothermal isobaric ensemble (NPT), and a pressure of 20 MPa was controlled by Berendsen barostat [14]. The time step and total simulation time were set to 1 fs and 500 ps, respectively.
Shale oil system: Data from the Paleoproterozoic Shahejie Formation shale oil in the Bohai Bay Basin, East China [15], the Wolf Camp shale oil in the Permian Basin, United States [16], and the Cretaceous Qingshangkou Formation shale oil in the Songliao Basin, NE China [17] (Table 1 ) were referenced to construct the shale oil boxes. Temperature and pressure equilibrium were performed on the COMPASS II force field [18] before simulations. For the convenience of discussion, three types of shale oil are marked as Type I, Type II and Type III shale oil in this paper. Asphaltene component was not considered in this study because asphaltene molecules are too large to occupy nanopores. In shale oil systems, nC6, nC12 and nC20 were selected to represent saturated hydrocarbons, toluene and 2-methylnaphthalene were selected to represent aromatic hydrocarbons, and indole, nonyl mercaptan and cyclohexanepropionic acid were selected as non-hydrocarbon compounds. The content of saturated hydrocarbons in shale oil increases from Type I to Type II and Type III. All components of aromatic hydrocarbons and non-hydrocarbon compounds except toluene are polar molecules, and the polarity of the three types of shale oil decreases in that order.
Table 1. Composition of three types of shale oil and oil density |
| Shale oil types | Saturated hydrocarbons/% | Aromatic hydrocarbons/% | Non-hydrocarbon compounds/% | Density/ (g·cm-3) | |||||
|---|---|---|---|---|---|---|---|---|---|
| nC6 | nC12 | nC20 | Toluene | 2- methylnaphthalene | Indole | Nonyl mercaptan | Cyclohexanepropionic acid | ||
| Paleoproterozoic Shahejie Formation shale oil in the Bohai Bay Basin (Type I) | 23.14 | 17.38 | 9.68 | 10.14 | 10.14 | 8.24 | 8.24 | 13.04 | 0.87 |
| Wolf Camp shale oil in the Permian Basin (Type II) | 49.46 | 13.97 | 6.45 | 12.90 | 12.90 | 2.16 | 1.08 | 1.08 | 0.78 |
| Cretaceous Qingshangkou Formation shale oil in the Songliao Basin (Type III) | 62.37 | 21.47 | 8.60 | 2.16 | 2.16 | 1.08 | 1.08 | 1.08 | 0.81 |
1.2. Simulation
The nanopore model, shale oil system and CO2+cosolvent composite system were combined in the Build Layers module in MS (Fig. 1 ). The cross-section of the model is square. The pore diameters were set to 5, 10, 15 nm, respectively, and periodic boundary was used to eliminate the influence of boundary effect in modeling. The long-range electrostatic interaction was described by the Ewald summation, and the van der Waals interaction was set to Atom based [9]. The cutoff distance was set to the default value of 1.25 nm. The time step was set to 1.0 fs, and the simulation time was set to 4.0 ns. The simulation process was divided into two steps: (1) The wall molecules were fixed. The Forcite Geometry Optimization module in MS was used to optimize the geometry of the models, and the smart algorithm was used to iterate 1×10⁵ steps to make the molecules on the surface with the minimum potential energy. (2) MD simulation was performed in the NVT ensemble, and the temperature at 323.15 K was controlled by the Nosé-Hoover thermostat. The Forcite Analysis module was used to analyze the parameters required in this study.
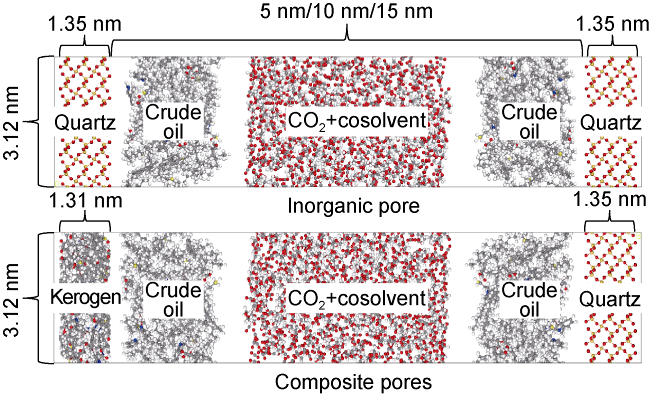
Fig. 1. Schematic diagram of molecular models for CO2+ cosolvent displacing shale oil. |
1.3. Verification of molecular simulation accuracy
The ratio of the density change of shale oil adsorption phase before and after displacement to the initial density obtained by dynamic simulation can be regarded as the efficiency of CO2 displacing shale oil. The simulated result and the experimental result (Fig. 2 ) with different dimethyl ether contents are a little different [20], but their change rules under the influence of dimethyl ether are consistent, indicating that the simulated result is reliable. There are two causes for this difference: (1) The shale oil composition established in this study is quite different from the shale oil used in the experiment; (2) There is free shale oil in micron-sized pores and fractures in the shale cores, but this study focuses on the displacement process of adsorbed shale oil by CO2 in nanopores.
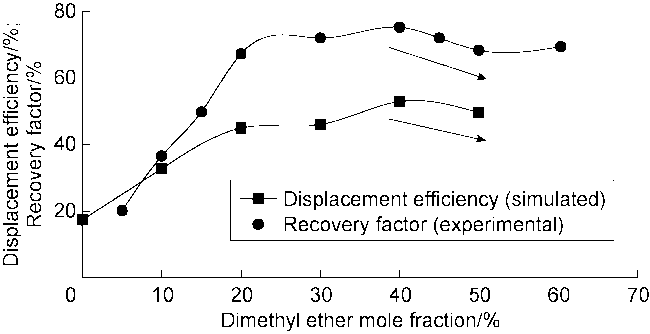
Fig. 2. Verification of displacement efficiency and recovery factor. |
In view of the limitation of displacement efficiency verification, CO2 was mixed with each cosolvent according to the ratio in references [21⇓⇓-24], and the specified temperature and pressure equilibriums were performed. The simulated densities were compared with the experimental results (Fig. 3 ). It can be seen that the differences between simulated values and experimental values are insignificant, and the error is 0.80%-4.66%. The accuracy of the molecular simulation method used in this study can be demonstrated by combining the aforementioned verification results of the displacement efficiency.
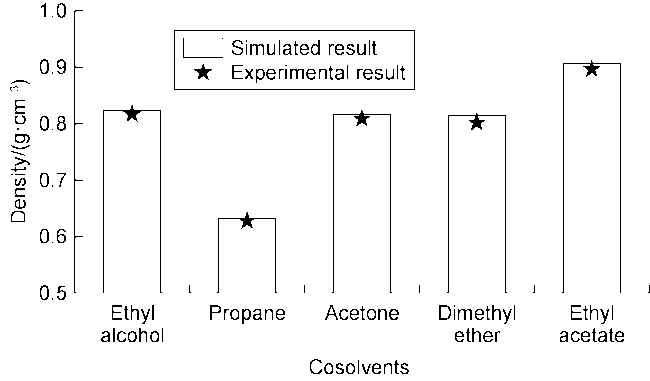
Fig. 3. Accuracy verification of density simulation results. |
2. Influencing factors on CO2-EOR
2.1. The effect of hydroxylation on CO2-EOR
Hydrogenation to different numbers of oxygen atoms on quartz surface allows the construction of inorganic nanopores at different degrees of hydroxylation. Fig. 4 shows how hydroxylation degree influences the displacement efficiency and oil-wall interaction energy of three types of shale oil in inorganic pores. The oil-wall interaction energy is equal to the total energy of the system consisting of the two minus the energy of the crude oil system and that of the wall separately. The following results can be obtained. (1) Due to the large amount of non-hydrocarbon compounds in Type I shale oil, the adsorption of the wall to oil molecules was enhanced by hydrogen bonds formed by polar functional groups and hydroxyl groups with the increase of the hydroxylation degree of the wall. Therefore, the displacement efficiency of Type I shale oil decreased significantly from 9.45% to 5.04%. The displacement efficiency of Type II and Type III shale oil decreased too, but with a relatively small range. (2) The interaction energy between Type I shale oil and the wall is the most sensitive to the hydroxylation degree of the quartz wall. Negative interaction energy indicates adsorption between two phases. When the quartz wall was completely hydroxylated, the adsorption of Type I shale oil was 124.85% and 131.39% of Type II and Type III shale oil, respectively, which indicates that the adsorption was very strong. It’s concluded that the higher the degree of quartz hydroxylation, the greater the difficulty in recovering the polar components in shale oil.
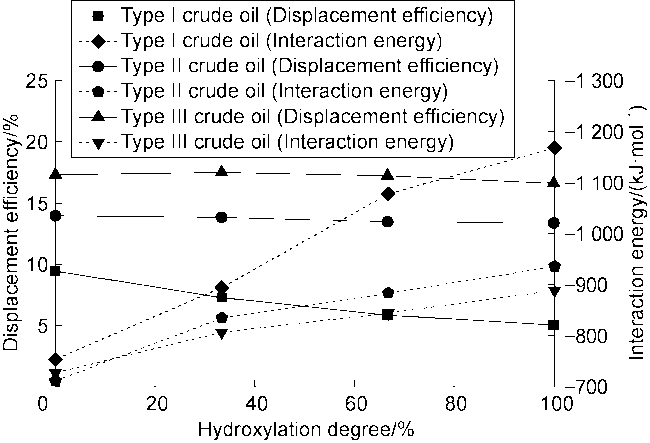
Fig. 4. The relation curves of the hydroxylation degree and the displacement efficiency of shale oil and oil-wall interaction energy in pores. |
2.2. Effect of nanopore size on CO2-EOR
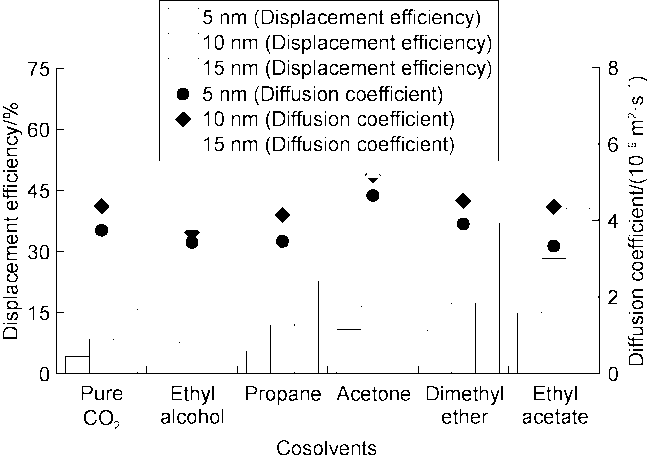
Fig. 5. The relationship of different cosolvents with the displacement efficiency and diffusion coefficient of Type I shale oil in composite nanopores of different sizes. |
2.3. Effect of shale oil components on CO2-EOR
2.3.1. Displacement effect
The relative concentration of crude oil obtained by MS software was converted into density to analyze the distribution of crude oil [18]. The radial distance is the distance extending radially to the right from the left outer side of the model box as the origin (including the wall thickness of 1.31 nm). The model is pre-equilibrated to an initial state, corresponding to the moment at 0.04 ns and the initial density. The state of the model after 4 ns is the final state. Fig. 6 shows the density variation of three types of crude oil from initial to final states under the influence of different cosolvents in 10 nm pores. The following results are obtained. (1) Under the influence of any cosolvent, the density of shale oil near the pore wall decreases significantly compared to the initial density. This indicates that the oil adsorption phase on both inorganic and organic walls has been displaced to varying degrees. (2) The stripping effect of pure CO2 is the weakest, and the average density decrease of types I-III shale oil near the pore wall is only 0.104 g/cm3. By contrast, with the effect of ethanol, propane, acetone, dimethyl ether, and ethyl acetate, the average density of the oil adsorption phase decrease to 0.182, 0.204, 0.253, 0.296, and 0.308 g/cm3, respectively, indicating that the solubilization effect of ethyl acetate is the best. (3) The effect of dimethyl ether on improving the stripping of Type II and Type III shale oil is excellent but poor on Type I shale oil. (4) The lower the content of aromatic hydrocarbons and non-hydrocarbon compounds in shale oil, the greater the increase of shale oil density in the center of the pore (radial distance 4-8 nm) (Table 2 ). This is because that the presence of large π-bonds causes aromatic ring stacking in benzene ring-containing oil molecules, and hydrogen bonds may form between non-hydrocarbon compounds, which weaken the migration of oil molecules.
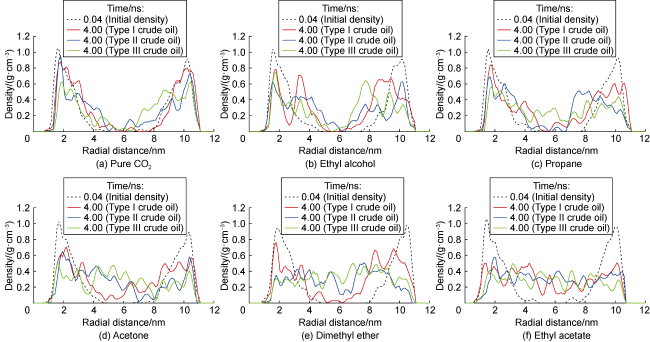
Fig. 6. Density variation of shale oil from initial to final states under the influence of different cosolvents. |
Table 2. Density variation of shale oil in the center of the pore under the influence of cosolvents |
| Types of shale oil | Shale oil density in the center of the pore/(g•cm−3) | |||||
|---|---|---|---|---|---|---|
| Pure CO2 | Ethyl alcohol | Propane | Acetone | Dimethyl ether | Ethyl acetate | |
| Type I | 0.025 | 0.090 | 0.102 | 0.123 | 0.127 | 0.204 |
| Type II | 0.091 | 0.145 | 0.174 | 0.218 | 0.290 | 0.275 |
| Type III | 0.115 | 0.202 | 0.207 | 0.268 | 0.293 | 0.257 |
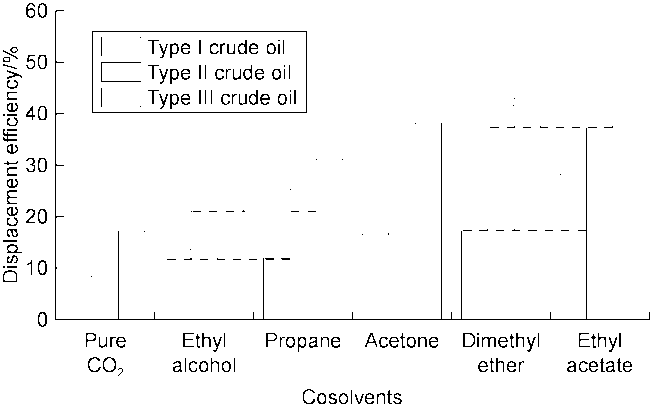
Fig. 7. Displacement efficiency of shale oil under the influence of different cosolvents. |
2.3.2. Mutual solubility between CO2 and shale oil
The radial distribution function reflects the probability of other particles appearing around a specific particle. The effects of different cosolvents on the mutual solution between shale oil and CO2 can be analyzed by calculating the radial distribution function (RDF) values between shale oil and pure CO2 or CO2+cosolvent (Fig. 8 ). The larger the RDF value between shale oil and CO2, the better the mutual solubility. Fig. 8 shows that there are different promotion effects to mutual solubility between CO2 and shale oil by different cosolvents, which is similar to displacement efficiency mentioned above. For Type I shale oil, ethyl acetate can reduce the interfacial tension between gas and oil phases and improve the solubility of CO2 in shale oil due to its good lipophilicity and good affinity for CO2 and non-hydrocarbon compounds, resulting in the largest RDF value. However, the laws reflected in types II and III shale oil are not consistent with the above, and the RDF value of CO2+dimethyl ether is the largest for types II and III shale oil. It can be seen that different cosolvents are suitable for different components of shale oil, and the more similar the properties of cosolvents and shale oil are, the greater the RDF value is. It can be inferred that the better the effect of improving mutual solubility, the lower the interfacial tension between CO2 and shale oil, and the higher the displacement efficiency.
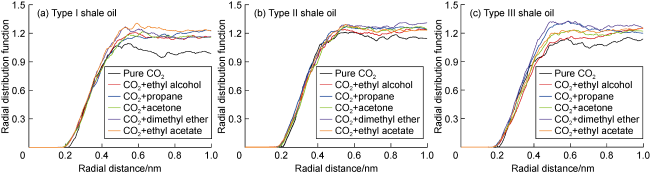
Fig. 8. Radial distribution function between shale oil and pure CO2 or CO2+cosolvent. |
2.3.3. Adsorption performance on walls
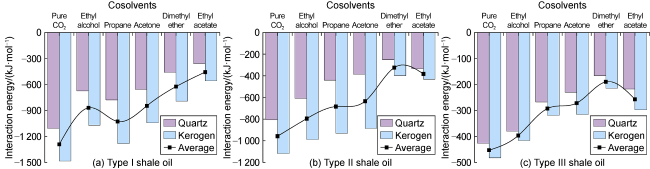
Fig. 9. Interaction energy between shale oil and quartz or kerogen wall under the influence of different cosolvents. |
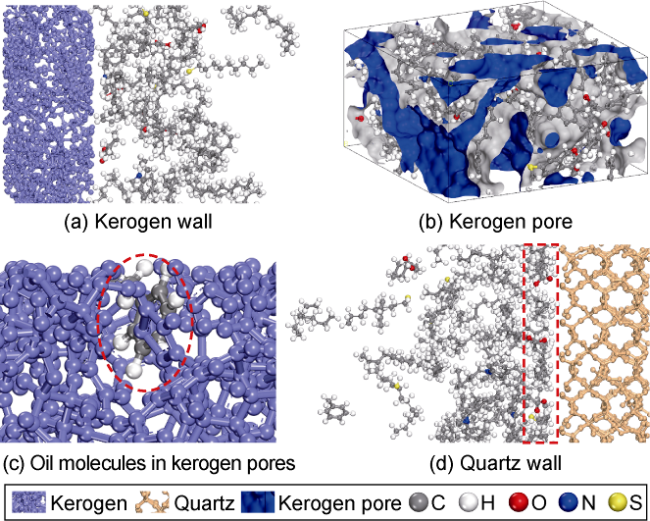
Fig. 10. Schematic diagram of oil molecule distribution on different walls and kerogen pores. |
3. Effect and stability of carbon storage
3.1. Effect of carbon storage
Under the influence of mass transfer, CO2 diffuses into oil phase in the process of CO2 flooding, and the interface between the two phases gradually becomes blurred. Eventually, the shale oil adsorbed on the rock wall is displaced by CO2 and produced, while CO2 is left underground. Fig. 11 shows the distribution characteristics of different types of shale oil and CO2 on kerogen wall after injecting CO2 with dimethyl ether. Strong interaction between oil molecules makes them easily aggregate when there are high content of aromatic hydrocarbons and non-hydrocarbon compounds in the shale oil (red dotted rectangle in Fig. 11a ). As a result, the diffusion channel of CO2 becomes complex and narrow, making it difficultly dissolve in the shale oil. The dipole-dipole force between oil molecules is reduced dramatically, while the dispersion force gradually becomes the primary force with the decreasing content of aromatic hydrocarbon and non-hydrocarbon. In this case, molecular aggregation in oil phase is reduced, which provides a good diffusion channel for CO2 (blue dotted rectangles in Fig. 11b and 11c ). The increase in saturated hydrocarbon can reduce the number of dissolved oil molecules in kerogen, resulting in reduced resistance to displacing shale oil and increased CO2 storage effect. Furthermore, the presence of CO2 molecules in kerogen (Fig. 11d ) indicates that shale oil dissolved in organic matter can be displaced by CO2. In addition, it is difficult for the CO2 molecules that appear in kerogen to diffuse and leak, so as to enhance the stability of carbon storage.
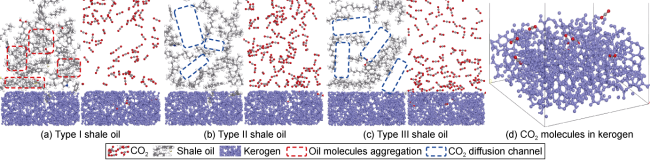
Fig. 11. Distribution of different types of shale oil and CO2 on kerogen wall. |
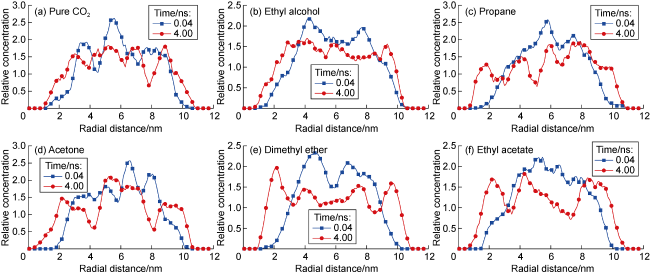
Fig. 12. Temporal and spatial evolution of CO2 relative concentration with the addition of cosolvents in Type III shale oil. |
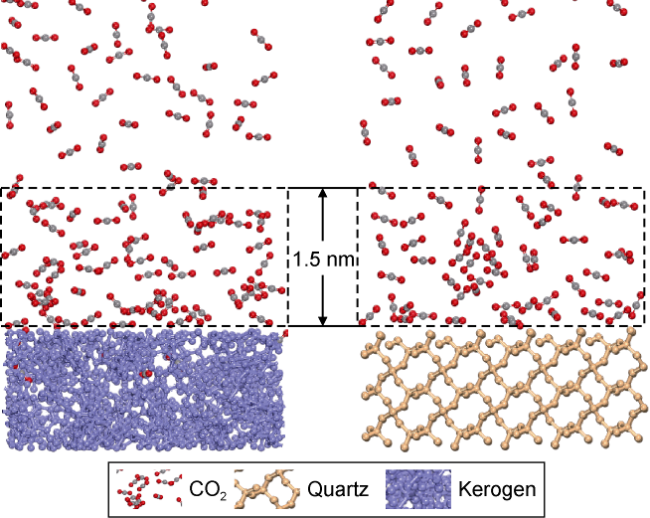
Fig. 13. Schematic diagrams of CO2 molecule distribution on quartz and kerogen walls. |
Table 3. Average change of relative concentration of CO2 within 1.5 nm from the wall |
| Wall | Average change of CO2 relative concentration | |||||
|---|---|---|---|---|---|---|
| Pure CO2 | Ethanol | Propane | Acetone | Dimethyl ether | Ethyl acetate | |
| Organic wall | 0.438 | 0.508 | 0.756 | 0.718 | 1.204 | 0.893 |
| Inorganic wall | 0.425 | 0.383 | 0.698 | 0.696 | 0.900 | 0.744 |
Note: positive change means the increase of CO2 relative concentration. |
3.2. Storage stability evaluation
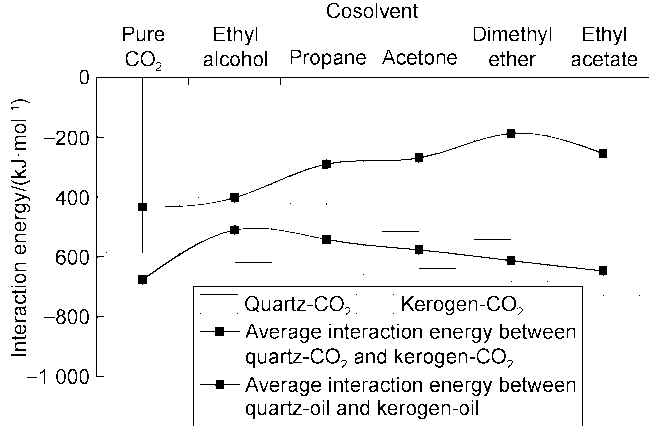
Cosolvents can facilitate the stripping of shale oil, driven by the competitive adsorption between CO2 and shale oil on quartz/kerogen wall. Fig. 14 shows the comparison of the interaction energy between quartz/kerogen wall and CO2/Type III shale oil. It should be noted that the total number of molecules in the displacing phase remains unchanged in the modeling process, so the addition of cosolvents implies a decrease in the number of CO2 molecules. This leads to a decrease of the interaction energy difference between wall-CO2 and wall-oil after the addition of ethanol. Therefore, the subsequent discussion no longer considers the case of injecting pure CO2. The black curve reflects the average quartz-CO2 and kerogen-CO2 interaction energy, and the red curve reflects the average quartz-oil and kerogen-oil interaction energy, under the influence of different cosolvents in Fig. 14 . The following results can be obtained: (1) The adsorption energy of CO2 on the wall is greater than that of shale oil in the presence of cosolvents. The greater the difference between two kinds of adsorption energy, the stronger the competitive adsorption is, and the stronger the ability of CO2 to displace shale oil molecules. This difference is the greatest when dimethyl ether is used as the cosolvent, followed by ethyl acetate. (2) The difference of interaction energy between wall-CO2 and wall-oil can be used to quantitatively evaluate competitive adsorption. The difference in interaction energy in Fig. 14 is the largest with the addition of dimethyl ether at 425.58 kJ/mol, followed by ethyl acetate at 393.22 kJ/mol. It can be concluded that the competitive adsorption between CO2 and Type III shale oil is the strongest with dimethyl ether. (3) The adsorption of CO2 on kerogen is stronger than that on quartz by comparing the adsorption energy of CO2 on quartz and kerogen walls. (4) It can be seen that the adsorption of CO2 on rock wall is the strongest when using ethyl acetate as a cosolvent by comparing the interaction energy between rock wall and CO2, and the average interaction energy is −650.31 kJ/mol. It indicates that CO2 storage with the addition of ethyl acetate is the most stable.
Fig. 14. Comparison of the interaction energy between the wall and CO2 or Type III shale oil. |
4. Conclusions
The attraction of quartz wall to shale oil increases with the degree of hydroxylation. The higher the quartz hydroxylation degree, the more difficult it is to recover the polar components in shale oil. The effect of nanopore size on shale oil displacement efficiency is also significant. The larger the pore size, the higher the displacement efficiency.
The closer the polarity of cosolvent molecules to that of shale oil, the more favorable it is for mutual solubility of CO2 and shale oil. The more non-polar components in shale oil, the less favorable it is for mutual solubility between CO2 and shale oil under the influence of the cosolvent with high polarity. Ethyl acetate is more effective in stripping shale oil with relatively strong polarity, while dimethyl ether is more effective in stripping shale oil with relatively low polarity.
CO2 is strongly adsorbed by kerogen with excellent adsorption capacity so that the CO2 inside the kerogen is difficult to diffuse and leak, which reflects the good stability of carbon storage. The highest CO2 storage rate can be achieved when dimethyl ether is used as a cosolvent, while the best storage stability can be obtained when using ethyl acetate as a cosolvent.