Characteristics of carbon isotopic composition of alkane gas in large gas fields in China

  • DAI Jinxing 1 ,
  • NI Yunyan , 2, * ,
  • GONG Deyu 1 ,
  • HUANG Shipeng 1 ,
  • LIU Quanyou 3 ,
  • HONG Feng 1 ,
  • ZHANG Yanling 1
Expand
  • 1. PetroChina Research Institute of Petroleum Exploration and Development, Beijing 100083, China
  • 2. China University of Petroleum (Beijing), Beijing 102249, China
  • 3. Peking University, Beijing 100871, China

Received date: 2023-12-01

  Revised date: 2024-02-29

  Online published: 2024-05-10

Supported by

National Natural Science Foundation of China(41472120)

General Project of National Natural Science Foundation of China(42272188)

Special Fund of PetroChina and New Energy Branch(2023YQX10101)

Petrochemical Joint Fund of Fund Committee(U20B6001)

Abstract

Exploration and development of large gas fields is an important way for a country to rapidly develop its natural gas industry. From 1991 to 2020, China discovered 68 new large gas fields, boosting its annual gas output to 1 925×108 m3 in 2020, making it the fourth largest gas-producing country in the world. Based on 1696 molecular components and carbon isotopic composition data of alkane gas in 70 large gas fields in China, the characteristics of carbon isotopic composition of alkane gas in large gas fields in China were obtained. The lightest and average values of δ13C1, δ13C2, δ13C3 and δ13C4 become heavier with increasing carbon number, while the heaviest values of δ13C1, δ13C2, δ13C3 and δ13C4 become lighter with increasing carbon number. The δ13C1 values of large gas fields in China range from -71.2‰ to -11.4‰ (specifically, from -71.2‰ to -56.4‰ for bacterial gas, from -54.4‰ to -21.6‰ for oil-related gas, from -49.3‰ to -18.9‰ for coal-derived gas, and from -35.6‰ to -11.4‰ for abiogenic gas). Based on these data, the δ13C1 chart of large gas fields in China was plotted. Moreover, the δ13C1 values of natural gas in China range from -107.1‰ to -8.9‰, specifically, from -107.1‰ to -55.1‰ for bacterial gas, from -54.4‰ to -21.6‰ for oil-related gas, from -49.3‰ to -13.3‰ for coal-derived gas, and from -36.2‰ to -8.9‰ for abiogenic gas. Based on these data, the δ13C1 chart of natural gas in China was plotted.

Cite this article

DAI Jinxing , NI Yunyan , GONG Deyu , HUANG Shipeng , LIU Quanyou , HONG Feng , ZHANG Yanling . Characteristics of carbon isotopic composition of alkane gas in large gas fields in China[J]. Petroleum Exploration and Development, 2024 , 51(2) : 251 -261 . DOI: 10.1016/S1876-3804(24)60021-2

Introduction

Exploration and development of large gas fields is an important way for a country to rapidly develop its natural gas industry. The reserves standards for large gas fields are variable by countries and scholars. In China, a gas field is considered “large” if its proved reserves are greater than 300×108 m3. By 1949, the cumulative proved reserves of natural gas in China were only 3.8×10⁸ m3 and the annual gas production was 0.11×10⁸ m3, making it a gas-poor country. Until 1990, China remained poor in gas for its cumulative proved reserves of only 7 045×108 m3 and annual gas production of 152×108 m3. At that time, only six large gas fields were discovered in the country [1], none of which had reserves exceeding 1 000×108 m3. In the following 30 years from 1991 to 2020, China discovered additional 68 large gas fields, which were mostly put into production to drive the gas production to 1 925×108 m3 by 2020, making it the fourth largest gas producer in the world. Not only the number of large gas fields significantly increased in the past 30 years, but also some extra-large gas fields with proved reserves larger than 5 000×108 m3 were discovered, such as Sulige gas field (20 665.55×10⁸ m3), Anyue gas field (12 626.47×10⁸ m3), and Kelasu gas field (8 266.48×10⁸ m3). These three large gas fields had a total gas production of 522.83×10⁸ m3 in 2020, accounting for 27.2% of China’s total in the year [2]. This indicates the significant role of large gas fields in the development of natural gas industry and their important contribution to achieving the "dual carbon" goals.
There are many examples of countries achieving rapid growth of the natural gas industry by exploring and developing large gas fields. In the early 1950s, the former Soviet Union (Russia) discovered natural gas reserves of less than 2 230×108 m3, with an annual gas production of only 57×108 m3, as a gas-poor country. However, from 1960 to 1990, due to the discovery and development of over 40 large gas fields, its natural gas reserves increased from 18 548×108 m3 to 453 069×108 m3. After the successive production of these large gas fields, the annual gas output of the Soviet Union surpassed that of the United States in 1983, becoming the world's largest gas producer [1]. Russia has 8 extra-large gas fields each with original recoverable reserves larger than 1×10¹² m3, ranking first in the world. The development of these extra-large gas fields has a significant impact on natural gas production of Russia and the world. The Urengoy and Yamburg gas fields had a total gas production of 3 407×108 m3 in 1999, leading the top two in the world at that time. They accounted for 58.8% and 14.4% of the total gas production in Russia and the world, respectively, for that year [3]. From 1966 to 1987, eight extra-large gas fields each with original recoverable reserves larger than 1×10¹² m3 were discovered in the West Siberian Basin. Among them, five were put into production from 1971 to 2012, and contributed a total of 154 603×108 m3 of gas by the end of 2021 (Table 1) [4], which was 3.83 times the world's total gas production (40 369×108 m3) in 2021, ensuring Russia as the world's first or second gas producer for nearly half a century. By the end of 2021, the Urengoy and Yamburg gas fields had total gas production of 69 741.58×10⁸ m3 and 41 197.92×10⁸ m3, respectively, registered as the first and second largest contributors to the world’s total natural gas production.
Table 1. Extra-large gas fields with original recoverable reserves larger than 1×10¹² m3 in the West Siberian Basin [4]
Gas field Year of discovery Original recoverable reserves/108 m3 Year of production Total gas production/108 m3 Cut-off year
Urengoy 1966 109 812.30 1978 69 741.58 2021
Yamburg 1969 58 867.30 1984 41 197.92 2021
Bovanenkov 1971 38 649.48 2012 6 670.55 2021
Zapoliar 1965 31 374.88 2001 18 026.29 2021
Medvezhye 1967 21 618.74 1971 18 966.92 2021
Harasavey 1974 12 455.00
Kruzenshtern 1976 11 768.53
Koivikkin 1987 14 843.38

1. Large gas fields and gas components in China

Based on the components of 1 696 gas samples from 70 large gas fields in nine basins (Tarim, Junggar, Qaidam, Sichuan, Ordos, Songliao, Ying-Qiong, Pearl River Mouth, and Bohai Bay) in China (Fig. 1) [2], a bar chart of gas components of large gas fields in China was plotted (Fig. 2). It is seen that the dominant gas component of large gas fields in China is alkane gas, including methane (max. 99.97% and avg. 88.88%), ethane (max. 13.15% and avg. 2.74%), propane (max. 6.76% and avg. 0.78%), and butane (max. 5.84% and avg. 0.37%). The non-hydrocarbon components include CO2 (avg. 3.71%), N2 (avg. 2.98%), and H2S (avg. 3.36%). As H2S almost presents only in carbonate reservoirs [5], it is found merely in 276 gas samples, while other components are confirmed in more than 1 481 gas samples. Analysis of the data in Fig. 2 reveals two patterns: (1) as the carbon number in the molecule increases, the average content of alkane gas decreases sequentially; and (2) the maximum content of alkane gas also shows a similar trend, with the maximum content of CH4 to C4H10 decreasing in sequence.
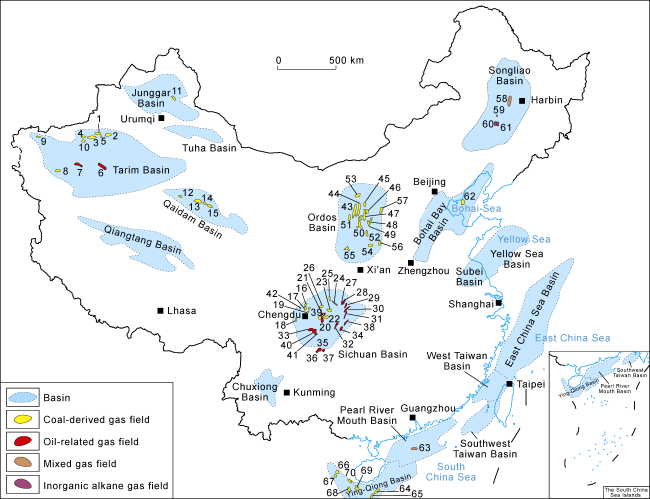
Fig. 1. Large gas fields and their distribution in China (excl. large CBM fields and two large gas fields in the East China Sea Basin). Tarim Basin (10 gas fields): 1-Kela 2, 2-Dina 2, 3-Kelasu, 4-Dabei, 5-Zhongqiu, 6-Tazhong 1, 7-Hetianhe, 8-Kekeya, 9-Akmomu, 10-Yudong; Junggar Basin (1 gas field): 11-Kelameili; Qaidam Basin (4 gas fields): 12-Dongping, 13-Tainan, 14-Sebei 1, 15-Sebei 2; Sichuan Basin (27 gas fields): 16-Xinchang, 17-Chengdu, 18-Qiongxi, 19-Luodai, 20-Anyue, 21-Moxi, 22-Hechuan, 23-Guangan, 24-Longgang, 25-Yuanba, 26-Bajiaochang, 27-Puguang, 28-Tieshanpo, 29-Dukouhe, 30-Luojiazhai, 31-Datianchi, 32-Wolonghe, 33-Weiyuan, 34-Fuling, 35-Changning, 36-Changning-Shangluo, 37-Taiyang, 38-Dachigan, 39-Zhongjiang, 40-Weiyuan shale gas field, 41-Weirong, 42-Chuanxi; Ordos Basin (15 gas fields): 43-Sulige, 44-Wushenqi, 45-Daniudi, 46-Shenmu, 47-Yulin, 48-Mizhi, 49-Zizhou, 50-Jingbian, 51-Liuyangbao, 52-Yan’an, 53-Dongsheng, 54-Yichuan, 55-Qingyang, 56-Daji, 57-Linxing; Songliao Basin (4 gas fields): 58-Xushen, 59-Longshen, 60-Changling I, 61-Songnan; Bohai Bay Basin (1 gas field): 62-Bozhong 19-6; Pearl River Mouth Basin (1 gas field): 63-Liwan 3-1; Ying-Qiong Basin (7 gas fields): 64-Lingshui 17-2, 65-Lingshui 25-1, 66-Dongfang 1-1, 67-Dongfang 13-2, 68-Ledong 22-1, 69-Ya 13-1, 70-Ledong 10-1.
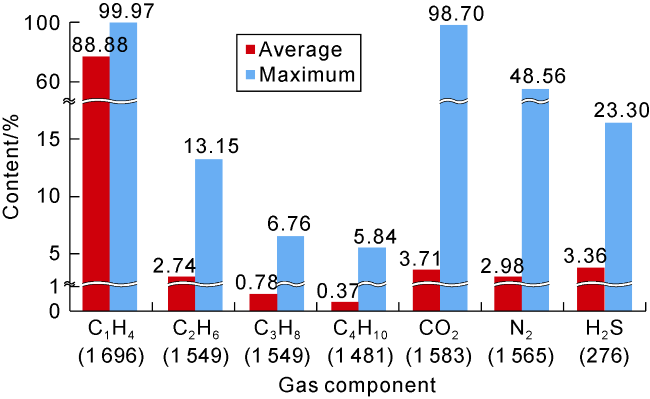
Fig. 2. Gas components of large gas fields in China (the values in parentheses represent the numbers of gas samples).

2. Carbon isotopic composition of alkane gas in large gas fields in China

According to the δ13C1−4 values of 1390 gas samples from large gas fields in China [2], a boxplot of δ13C1−4 was developed (Fig. 3). It can be seen that the δ13C1 value of large gas fields in China ranges from -71.2‰ to -11.4‰, with an average of -33.2‰. The minimum value (-71.2‰) is found in Well Tai 1-2 in the Tainan gas field of the Qaidam Basin, while the maximum value (-11.4‰) is in Well CS 104 in the Changling I gas field of the Songliao Basin (Table 2). The δ13C2 value ranges from -52.3‰ to -13.8‰, with an average of -26.5‰; the δ13C3 value ranges from -51.6‰ to -14.2‰, with an average of -24.9‰; and the δ13C4 value ranges from -34.4‰ to -16.0‰, with an average of -23.2‰. Fig. 3 shows two characteristics of carbon isotopic composition of alkane gas. Firstly, as the carbon number in the molecule increases, the minimum and average δ13C values of methane (CH4), ethane (C2H6), propane (C3H8), and butane (C4H10) increase, while the maximum δ13C values decreases. Secondly, the interval differences between the maximum and minimum values of methane, ethane, propane, and butane are 59.8‰, 38.5‰, 37.4‰, and 18.4‰, respectively, reflecting a decreasing trend.
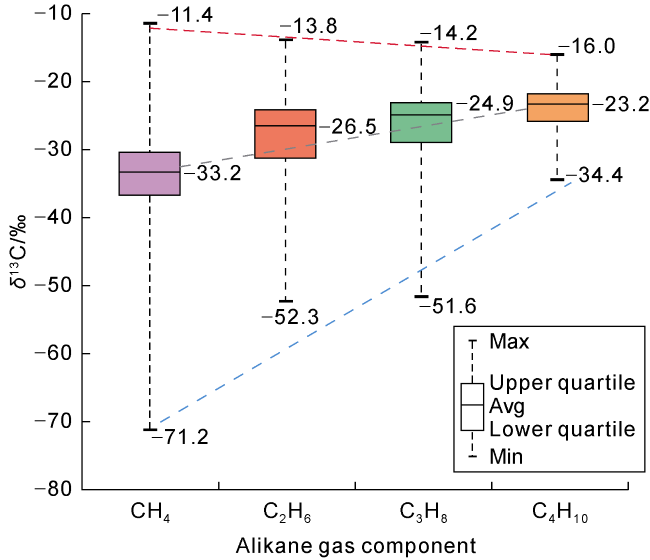
Fig. 3. δ13C1-4 values of large gas fields in China.
Table 2. Components and carbon isotopic compositions of the natural gas from large gas fields in China
Basin Gas field Well Layer Main components of natural gas/% δ13C value/‰ Gas type R/Ra
CH4 C2H6 C3H8 C4H10 CO2 N2 CH4 C2H6 C3H8 C4H10 CO2
Ordos Sulige E58 P2x 89.60 3.93 0.82 0.15 0.07 4.64 -31.9 -23.6 -23.4 Coal-
derived gas
Su172 P1s 94.12 3.02 0.50 0.07 0.06 2.08 -27.3 -23.0 -26.1
Tao5 P2x 90.90 4.69 0.83 0.23 0.76 2.10 -36.5 -23.2 -24.5 -22.3
Dongsheng J26 P2x 93.66 3.59 0.81 0.30 0.35 1.16 -32.0 -25.4 -24.8 -23.8 -9.9
J55 P1s 83.48 7.14 1.86 0.56 0.03 6.76 -36.2 -24.8 -26.4 -28.8
Wushenqi Zhao4 P2x 90.70 5.46 1.09 0.46 0.45 0.81 -31.3 -23.7 -23.0 -22.5
ZT1 O1m54−6 82.16 0.70 0.01 0.04 0.01 0.06 -37.5 -27.8 -24.3 -20.3
Daniudi DG3 O1m5 91.97 2.80 0.50 0.27 3.89 0.47 -40.1 -24.2 -22.8
D66-52 O1m5 93.34 3.49 0.79 0.31 1.56 0.38 -37.6 -29.8 -27.3
D66-38 O1m5 91.66 5.09 1.33 0.50 0.27 1.08 -40.3 -33.6 -28.9 Oil-
related gas
0.026
Yulin Yu 27-01 O1m51-2 95.00 1.34 0.21 0.06 3.26 0.12 -33.1 -30.8 -28.8 -20.0 -3.4
Yu 27-11 P1s2 92.47 4.24 0.91 0.33 1.64 0.24 -29.8 -25.2 -23.7 -22.8 -7.4 Coal-
derived gas
Shenmu Shen24 P1t -31.5 -25.0 -23.2
Shuang72 P1t -40.7 -25.6 -25.1 -25.8
Linxing LX-105-2D P2x 95.28 2.77 0.74 0.19 0 0.87 -30.3
LX-46 C2b 91.95 0.27 0 0 4.62 3.16 -46.5 -17.6
Zizhou Zhou28-43 P1s 90.44 5.42 1.54 0.65 -30.2 -22.7 -22.2 -20.2
Zhou16-19 P1s 91.53 1.16 0.39 -34.5 -24.3 -21.7 -21.7
Mizhi LC1 P2x -29.2 -22.4 -23.0
Mi3 P2x 87.31 6.61 1.98 0.85 0.01 2.09 -44.0 -34.7 -31.7 -32.5
Daji D6-2B P2sh7 98.85 0.54 0.04 0.01 0.56 0 -25.3 -29.3 -29.8
D2-6A-6 P1t 97.81 0.20 0.01 1.70 0.28 -29.3 -34.3 -32.9
Yichuan Yi8 P1s2 -31.0 -31.4
Yi32 C2b 99.19 0.26 0.02 0 0.43 0.04 -33.0
Yan’an Y175 C2b 96.49 0.62 0.05 2.24 0.59 -27.5 -33.4 -33.3
Sh37 C2b 96.60 0.42 0.03 2.73 0.22 -30.8 -37.1 -37.3 -2.1
Qingyang Long84 P1s1 87.50 1.42 0.18 2.96 7.81 -24.9 -28.7 -31.2
Long47 P1t 89.26 4.07 0.64 0.14 -33.2 -40.8 -39.1 0
Liuyangbao DB26 P1s2 92.89 1.61 0.24 0.03 4.22 0.99 -28.6 -24.2 -24.0
LP4T P1t2 96.71 1.60 0.23 0 0.09 0.77 -30.6 -25.3 -28.0
Jingbian G49-13 O1m51 93.31 0.70 0.07 0.01 5.55 0.31 -27.6 -32.7 -30.1 -27.7 -0.5 Oil-
related gas
Shaan2 O1m 92.11 3.45 0.42 0.28 0.31 3.31 -41.4 -31.0 -25.6 -23.5
Sichuan Anyuan MX11 Z2dn2 89.87 0.03 7.02 1.92 -32.0 -26.8
MX121 Z2dn2 94.03 0.08 4.56 0.53 -34.1 -31.9
MX206 —C 1l 95.37 0.09 2.96 0.58 -32.1 -31.9
MX31 —C 1l 95.67 0.11 2.66 0.75 -33.6 -31.5
Weiyuan Wei27 Z2d 85.85 0.17 0 4.70 7.81 -32.0 -31.2
Wei63 Z2d -32.8
Datianchi TD2 C2h1 -31.4 -35.6
TD93 C2h1 -35.1 -37.4 -34.5
Wolonghe Wo55 P3ch 95.32 1.09 0.26 0.16 0.11 2.26 -31.7 -30.6
Wo70 C2hl 97.06 0.82 0.10 0 1.46 0.56 -36.8 -33.4 -25.1 -28.5
Puguang P401-1 T1f1−3 83.95 0.05 0 7.35 2.84 -31.4 -31.6 -1.1
P105-2 T1f1−2 70.44 1.10 0.29 8.64 2.37 -35.6 -27.2
Tieshanpo P2 T1f 78.52 0.05 0.03 5.87 0.98 -29.5
P1 T1f 78.38 0.05 0.02 6.36 0.92 -30.1
Dukouhe P2 T1f 78.74 0.03 0.01 3.29 1.60 -29.5
WBQ1-2 J2s 94.05 3.51 0.86 0.22 0 1.20 -34.2 -29.1 -26.3 -25.4
Luojiazhai LJ7 T1f 81.37 0.07 0 0 6.74 1.34 -30.3 -29.4
HL8 P2ch 95.85 0.15 0 0 2.68 0.48 -33.6
Yuanba YL10 T3x3 98.04 0.62 0.04 0 1.01 0.29 -26.0 -22.9 -0.3 Coal-
derived gas
YB221 T3x3 94.40 2.02 0.25 0.06 2.10 1.09 -33.8 -20.7 -20.6 1.3
Longgang LG61 T1f 94.95 0.08 1.84 0.09 -27.4 -22.2 1.9
LG001-6 T1f 95.24 0.20 0.02 3.90 0.62 -37.8 -26.4 0.2
Chuanxi Yas1-3 T2l43 87.20 0.11 6.09 0.94 -30.6 -32.9 Oil-
related gas
YS-3 T2l43 88.13 0.12 1.44 5.79 1.44 -31.8 -32.6
Moxi MS1-1 T1j -31.4 -32.1
Mo64 T1j -42.5 -28.2 -25.3
Sichuan Xinchang XC134 J2s -32.7 -25.7 -23.6 -18.9 Coal-
derived gas
XC134-2 J2s 93.08 5.02 0.82 0.40 0.44 0.16 -36.7 -24.4 -23.4 -19.3 -11.3
Qiongxi QX14 T3x2 96.50 1.57 0.12 0.06 1.54 0.23 -30.5 -24.1 -23.8 -5.0
PL2 J2s 93.55 4.01 0.57 0.20 0.02 1.62 -39.2 -25.5 -21.9 -21.2
Sichuan Hechuan HC5 T3x2 88.75 5.25 0.98 0.47 0.19 3.79 -37.9 -24.9 -22.1 -21.6 Coal-
derived gas
HC1 T3x2 87.57 7.40 2.68 1.04 0.04 0.46 -42.8 -26.6 -22.7 -22.2
Guangan GA11 T3x6 -37.1 -27.4 -22.7 -23.6
GA14 T3x6 88.83 5.76 1.32 0.46 -42.0 -25.9 -21.7 -20.7
Bajiaochang J6 Jt4 -36.5 -26.0
J37 Jt4 -43.1 -32.9 -30.2 -29.3 Oil-
related gas
Chengdu MP46 J3p 94.60 3.05 0.68 0.27 0.03 1.22 -31.1 -25.4 -21.0 Coal-
derived gas
MP13 J3p 93.53 4.14 0.92 0.33 0 0.90 -33.5 -25.3 -19.4
Zhongjiang JS21-6HF J2s -30.4 -25.3 -22.7
JS24-3H J2s -38.6 -26.2 -22.9
Luodai L75 J3p 89.69 5.98 1.85 0.77 0 1.24 -32.5 -23.7 -20.9 -20.0
LS24D J3sn 92.43 4.03 0.95 0.23 0 1.81 -36.3 -23.6 -19.6 -21.0
Fuling
shale gas
JY2 O3w−S1l -22.7 -37.6 -38.8 Oil-
related gas
JY3 O3w−S1l -33.8 -38.6 -38.2
Changningshale gas Z104 S1l 99.25 0.52 0.01 0.07 -26.7 -31.7 -33.1 3.8
NH10-1 S1l 98.66 0.51 0.05 0.70 0.08 -29.8 -34.5 -36.2 -1.4
Changning- Shangluo
shale gas
SL08 S1l 97.18 0.63 2.19 -21.6 -30.6 -8.3
SL08H8 S1l 96.87 0.35 0.25 2.53 -32.0
Taiyang shale gas YS116H O3w−S1l -28.8 -33.9 -35.0 -18.7
Y103 O3w−S1l 97.09 0.79 0 0.09 -32.8 -36.6 -37.1 -16.3
Weiyuan shale gas W204H6-1 O3w−S1l 98.24 0.56 0.03 0.50 0.67 -34.3 -37.6 -41.8 -9.7 0.03
W201 O3w−S1l 99.09 0.48 0.42 0.01 -37.3 -38.2 -0.2
Weirong shale gas WY1 -28.7 -35.3
WY23-6HF 96.40 0.41 1.68 0.67 -36.6 -38.1 -41.4
Tarim Kelasu KS105 K1bs 95.94 0.47 0.03 0.01 2.36 1.14 -25.7 -13.8 Coal-
derived gas
BZ3 K1bs 86.64 6.53 1.65 0.36 0.26 3.11 -35.6 -25.1 -23.2 -22.9
Kela 2 KL201 K1bs 96.88 0.91 1.00 0 0 1.21 -27.3 -19.0 -19.5 -21.2 -18.6
KL2 K1bs -28.2 -18.9 -19.2 -20.9 -15.4
Dina 2 DN204 E1−2km 86.90 7.40 0.92 0.62 0.89 2.95 -34 -23.1 -20.8 -20.4 -12.4
DN2 N1j 87.93 7.25 1.40 0.59 0.81 1.55 -36.9 -21.3 -24.4 -24.7 -15.7
Dabei DB104 K1bs 95.60 0.19 0.01 0.01 1.67 2.02 -26.7 -19.2
DB1 K1bs 94.29 3.43 0.41 0.11 0.37 1.20 -33.1 -21.4
Zhongqiu ZQ101 90.93 4.73 1.00 0.39 0.76 1.70 -32.3 -20.3 -18.6 -20.3
ZQ1 -32.6 -22.3 -20.7 -20.6
Yudong YD5 E 89.15 5.51 1.14 0.48 0.11 2.98 -33.1 -22.5 -20.7 -20.9
YD1 E 89.95 5.51 1.14 0.46 0.10 2.18 -35.0 -22.5 -21.5 -22.6
Kekeya K8001 N1x8 87.34 6.40 2.28 1.22 0.07 1.84 -34.2 -25.7 -23.2 -23.2
K18 N1x 84.05 8.99 1.93 0.73 3.98 -38.5 -26.4 -25.1
Akmomu AK1 K2 -23.0 -20.2 -4.6
AK1 K2 -25.6 -21.9 -15.6
Tazhong I ZG2 O3l 89.79 1.39 0.30 0.24 1.24 6.74 -32.6 -30.0 -39.3 -29.3 -2.7 Oil-
related gas
TZ45 O3l 84.21 4.43 1.62 1.03 2.61 4.80 -54.4 -38.2 -32.0 -30.7
Hetianhe M8 O 75.71 0.51 0 0 14.03 9.75 -34.6 -38.1 -35.4 -31.6
M2 C 78.31 1.71 0.14 0 0.19 19.65 -39.6 -36.5 -30.8 -27.6 1.17
Junggar Kelameili DX26 C 88.89 4.49 1.29 1.58 2.75 0.09 -28.5 -25.6 -24.0 -5.1 Coal-
derived gas
0.06
D403 C 88.89 4.87 1.83 1.10 2.18 0.07 -31.3 -27.5 -24.6
Qaidam Tainan TS1 Q 50.07 0.80 0.12 4.84 35.07 -56.4 -32.3 -31.0 Biogas
T1-2 98.66 0.06 0 1.27 -71.2 -52.3 -35.1
Sebei1 S27 Q 99.93 0.04 0.03 -60.5 -10.6
S0-12 Q 99.89 0.10 0.01 -70.4 -44.7 -34.1
Sebei 2 SZ9 Q 99.31 0.69 -63.0
SS17 Q 99.62 0.14 0.03 0.15 0.06 -69.7 -42.4 -33.2 -3.2
Dongping P3H-6-1 Bedrock 73.82 0.96 0.19 0.11 0.01 24.08 -18.9 -24.3 Coal-
derived gas
N1-2-2 J 81.21 8.99 4.28 1.76 0.30 3.05 -38.0 -26.1 -24.1 -23.9
Songliao Xushen LT2 Base 93.46 2.90 0.38 0.14 0.06 2.00 -20.9 -27.7 -30.1 Mixed gas
XS19 K1yc 3.48 0.03 0 0 95.82 0.67 -35.6 -34.7 -4.6
Songliao Changling I CS104 K1yc -11.4 -23.0 -27.8 Mixed gas
CS1 K1yc -26.5 -29.6 -7.2
Songnan YD3HF K1d 75.13 1.32 0.08 0.02 16.67 6.73 -19.1 -27.9 -29.7 -8.8 2.21
YD4HF K1d 74.39 1.30 0.07 0.02 16.81 6.79 -25.1 -29.3 -32.4 -9.8 1.11
Longshen LS3 K1yc 78.65 12.00 3.78 1.42 1.23 2.50 -29.1 -25.7 -23.9 -24 0.7
LS1 K1sh -39.2 -27.9 -26.4 -25.6
Ying−
Qiong
Ya13−1 YC13-1-1 E3ls3 89.81 2.64 1.21 0.76 0.17 4.65 -34.4 Coal-
derived gas
YC13-1-6 E3ls3 82.96 4.80 1.81 0.88 8.33 0.26 -40 -24.9 -23.7 -23.8
Dongfang 1−1 DF1-1-7 N2ygh 35.84 1.28 0.15 0 56.89 5.30 -31.8 -23.7 -23.3 -23.6 -3.4
DF1-1-9 N2ygh 80.80 0.20 0 0 0.40 18.20 -40.5 -21.8 -18.6
Ledong 22−1 LD22-1-1 N2ygh1 13.44 0.54 0.03 0 80.42 5.29 -26.9 -22.0 -2.2
LD22-1-5 Qld2 84.27 0.96 0.23 0.05 0.71 13.32 -49.3 -23.5 -21.7 -20.8
Ledong 10−1 LD10-1-10 N1hl2 25.43 0.17 0.02 0 70.10 4.28 -29.0 -19.6 -1.8
LD10-1-5 N1hl2 41.31 1.55 0.24 0.02 54.26 2.59 -33.7 -27.2
Dongfang 13−2 DF13-2-2 N1hl1 84.28 1.46 0.83 0.39 2.27 10.65 -30.4 -26.0 -25.4 -25.7 -10.9
DF13-2-6 N1hl1 78.72 1.35 1.25 0.86 2.59 14.96 -39.0 -27.4 -28.0 -27.2 -10.4
Lingshui 17−2 LS17-2-1 N1hl 93.25 0.21 0.62 -36.8 -23.6 -22.2 -21.5
LS17-2-8 N1hl 85.18 4.63 1.82 0.94 0.22 5.09 -40.0 -25.9 -24.3 -24.0 -17.8
Lingshui 25−1 LS25-1-2 N1hl 78.74 4.65 1.30 0.59 9.26 1.05 -36.0 -25.6 -23.1 -22.5 -4.5
LS25-1-1 N1hl 87.31 4.70 1.63 0.76 2.83 1.58 -39.4 -25.4 -23.3 -22.6 -9.0
Pearl River Mouth Liwan 3−1 LW3-1-1 N1z 86.29 5.18 1.74 0.86 3.07 0.10 -36.6 -29.1 -27.4 -26.9 -6.1
LW3-1-2 N1z 87.41 5.67 1.61 0.57 3.13 1.41 -38.0 -29.0 -28.6 -29.5 -3.9
Bohai Bay Bozhong 19−6 O Ar 79.79 8.48 2.88 1.34 6.76 0.05 -37.0 -27.3 -26.6 -27.2
B Ar 77.78 8.22 2.78 1.28 9.19 0.12 -39.2 -25.8 -24.6 -24.1

Note: Only two wells with the maximum and minimum values of δ13C1 in each of 70 gas fields are selected. P2x—Lower Shihezi Formation of Permian; P1s—Shanxi Formation of Permian; O1m5—Member 5 of Majiagou Formation of Ordovician; P1t—Taiyuan Formation of Permian; C2b—Benxi Formation of Carboniferous; P2sh7—Member 7 of Upper Shihezi Formation of Permian; Z2dn2—Member 2 of Dengying Formation of Sinian; —C1l—Longwangmiao Formation of Cambrian; Z2d—Dengying Formation; C2h1—Member 1 of Huanglong Formation of Carboniferous; T1f1-3—Members 1-3 of Feixianguan Formation of Triassic; J2s—Shaximiao Formation of Jurassic; P2ch—Changxing Formation of Permian; T3x—Xujiahe Formation of Triassic; T2l—Leikoupo Formation of Triassic; T1j—Jialingjiang Formation of Triassic; Jt4—Member 4 of Ziliujing Formation of Jurassic; J3p—Penglaizhen Formation of Jurassic; J3sn—Suining Formation of Jurassic; O3w—Wufeng Formation of Ordovician; S1l—Longmaxi Formation of Silurian; K1bs—Bashijiqike Formation of Cretaceous; E1-2km—Kumugeliemu Group of Paleogene; E—Paleogene; N1x8—Member 8 of Xihefu Formation of Neogene; K2—Upper Cretaceous; O3l—Lianglitag Formation of Ordovician; O—Ordovician; C—Carboniferous; Q—Quaternary; J—Jurassic; K1yc—Yingcheng Formation of Cretaceous; K1d—Denglouku Formation of Cretaceous; K1sh—Shahezi Formation of Cretaceous; E3ls3—Lingshui Formation of Paleogene; N2ygh—Yinggehai Formation of Neogene; Qlld2—Member 2 of Ledong Formation of Quaternary; N1hl2—Member 2 of Huangliu Formation of Neogene; N1z—Zhujiang Formation of Neogene; Ar—Archaean.

The δ13C values of methane, ethane, propane, and butane become heavier as the carbon number in the molecule increases, i.e. δ13C1<δ13C2<δ13C3<δ13C4, called as the positive carbon isotope series, shown as the minimum value in Fig. 3. The δ13C values of biogenic methane, ethane, propane, and butane decrease as the carbon number in the molecule increases, i.e. δ13C1>δ13C2>δ13C3> δ13C4, called as the secondary negative carbon isotope series, shown as the maximum value in Fig. 3.
The two trends above are mainly related to changes in the formation temperature and diffusion rate of alkane gas, as well as changes in the diffusion rate of 13C molecules.
Alkane gas formed by coal-derived gas and shale gas (oil-related gas) at the stages of low maturity, moderate maturity, and high maturity presents positive carbon isotope series (δ13C1<δ13C2<δ13C3<δ13C4). In Fig. 3, the minimum value of δ13C1 is -71.2‰, indicating of biogas; the minimum values of δ13C2 and δ13C3 are -52.3‰ and -51.6‰, respectively, reflecting the characteristic of mature gas; the minimum value of δ13C4 is -34.4‰, suggesting mature gas or highly mature gas. All indicate that the minimum value of mature gas is formed in the range of low temperature to maturing temperature, so it is featured as δ13C1<δ13C2<δ13C3<δ13C4. However, when coal-derived gas and shale gas (oil-related gas) are formed in an over-mature environment, alkane gases exhibit the characteristics of secondary negative carbon isotope series (δ13C1>δ13C2>δ13C3>δ13C4). In Fig. 3, the maximum value of δ13C1 is -11.4‰, reflecting the characteristics of over-mature environment.
The diffusion of molecules is influenced by their relative molecular mass and size. Thus, the molecules with higher relative molecular mass diffuse slower than those with lower relative molecular mass. For alkane gas molecules, as the carbon number increases, the relative molecular mass and diameter also increase, resulting in a decreasing trend of diffusion rate as CH4, C2H6, C3H8, C4H10.
The CH4, C2H6, C3H8 and C4H10 present the following 12C and 13C fabric patterns:
CH412CH4, 13CH4
C2H612C12CH6, 12C13CH6, 13C13CH6
C3H812C12C12CH8, 12C12C13CH8, 12C13C13CH8, 13C13C13CH8
C4H1012C12C12C12CH10, 12C12C12C13CH10, 12C12C13C13CH10, 12C13C13C13CH10, 13C13C13C13CH10
As the mass of 12C is less than that of 13C, the mass of 12CH4 is less than that of 13CH4, making the former diffuse faster than the latter, and resulting in the fractionation of carbon isotopes in CH4 cluster and causing increased δ13C1 value in this cluster. According to Eq. (2), there are three 12C and 13C fabric patterns for the C2H6 cluster. Similarly, in terms of mass, 12C12CH6<12C13CH6<13C13CH6, thus corresponding to a descending order of diffusion rate. As a result, the C2H6 cluster produces a fractionation surface for carbon isotopes, which increases δ13C2 value of this cluster. According to Eqs. (3) and (4), the C3H8 and C4H10 clusters have 4 and 5 types of 12C and 13C fabric patterns, respectively. Due to the same diffusion and fractionation results as CH4 and C2H6 clusters, δ13C3 value and δ13C4 value increase.
However, due to the different 12C and 13C fabric patterns of the clusters represented by Eqs. (1)-(4), the diffusion body (source rock) has the weakening fractionation ability of CH4, C2H6, C3H8, C4H10, and with decreasing diffusion velocity in sequence. Under this dual effect, after a long time, the positive carbon isotope series (δ13C1<δ13C2< δ13C3<δ13C4) can be transformed into a secondary negative carbon isotope series (δ13C1>δ13C2>δ13C3>δ13C4).
This shows that in over-mature environment with high temperature, alkane gas molecules increase in relative molecular mass and diameter with increasing carbon number, resulting in a diffusion velocity of CH4>C2H6> C3H8>C4H10, and the fractionation ability of CH4>C2H6> C3H8>C4H10. As a result, the positive carbon isotope series evolve into a secondary negative carbon isotope series.

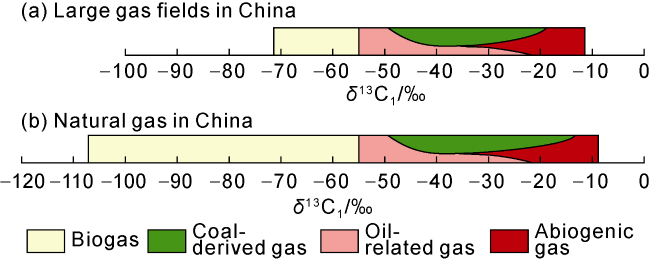
3. The δ13C1 values distribution of biogas, oil-related gas, coal-derived gas, and abiogenic gas in large gas fields in China

Based on the indicators for classifying gases proposed by many scholars [6-20], the 1 696 gas samples from the large gas fields in China were classified and then the distribution characteristics of δ13C1 values were clarified by gas types.

3.1. The δ13C1 value of biogas is between -71.2‰ and -56.4‰, with an interval value of 14.8‰

What is the δ13C1 threshold between biogas and thermogenic gas? Table 3 [21] summarizes the relevant values adopted by some scholars. It is indicated that there are three δ13C1 values (the lower limit in Table 3) for classifying biogas and thermogenic gas, i.e. -50‰, -55‰ and -60‰.
Table 3. Lower limit (maximum value) to upper limit (minimum value) of δ13C1 of biogas adopted by some scholars [21]
δ13C1/‰ Data source δ13C1/‰ Data source
-95 to -55 Alekseyev (1974) <-55 Wang et al. (1988)
-95 to -55 Bысоцкий (1979) <-55 Shen et al. (1991)
-75 to -55 Hunt (1979) -75 to -58 Fuex (1977)
-100 to -55 Stahl (1979) -80 to -58 Carey (1979)
<-55 Rice (1981) <-60 Jenden et al. (1986)
<-55 Zhang (1983) -85 to -60 Chen et al. (1989)
<-55 Zhang (1984) -90 to -50 Tiratsov (1979)
-55 to -90 Tissot (1984) -97 to -50 Эоръкий и др (1984)
<-55 Dai et al. (1986) <-64 Schoell (1980)
<-55 Grace (1986) -80 to -70 Donald (1983)
<-55 Bao et al. (1988)
The maximum δ13C1 value of biogas from large gas fields in China is -56.4‰ (Well TS1 in the Tainan gas field of the Qaidam Basin) (Table 2), which is slightly lighter than -55‰ in Table 3 by 1.4‰. The minimum δ13C1 value of oil-related gas from large gas fields in China is -54.4‰ (Well TZ45 in the TZ1 gas field of the Tarim Basin) (Table 2), which is heavier than -55‰ in Table 3 by only 0.6‰. Both values are close to -55‰. Accordingly, it is more appropriate to divide biogas and thermogenic gas by -55‰.
The minimum δ13C1 value of biogas from large gas fields in China is -71.2‰ (Well Tai 1-2 in the Tainan gas field) (Table 2). The maximum and minimum δ13C1 values of biogas were combined to prepare the δ13C1 scale of biogas from large gas fields in China (Fig. 4a). It is seen that the δ13C1 of biogas from large gas fields in China is in the minimum scale interval.
Fig. 4. δ13C1 scales of large gas fields and natural gas in China

3.2. The δ13C1 value of oil-related gas is between -54.4‰ and -21.6‰, with an interval value of 32.8‰

The minimum δ13C1 value of oil-related gas from large gas fields in China is -54.4‰, which occurs in Well TZ45 (Table 2) and Well ZG102 in the Tazhong I gas field [2]. The alkane gases in both wells exhibit positive carbon isotope series, indicating that these alkane gases are of the primary type. Therefore, the δ13C1 values have not been subjected to secondary transformation but maintain their original accuracy.
The maximum δ13C1 value of oil-related gas from large gas fields in China is -21.6‰, which is observed in Well SL08 in the Shangluo shale gas field of Changning block, the Sichuan Basin. It was previously considered that the maximum δ13C1 value of oil-related gas is lower than -30‰. Zhang et al. reported that the maximum and minimum δ13C1 values of oil-related gas are -30‰ and -46‰, respectively [15]. Zhang et al. indicated -36‰ and -52‰ [17], and Dai et al. underscored -55‰ and -30‰ (-55‰ and -40‰ for associated gas; -37‰ and -30‰ for pyrolysis gas) [22]. In the past 20 years, with more and more gas fields discovered in China, diverse gas types were recognized, and natural gas research was deepened. Therefore, the maximum δ13C1 value of oil-related gas climbed up. Six shale gas fields have been discovered in southern Sichuan Basin, with Ro ranging from 2.10% to 4.44% in the Wufeng Formation-Longmaxi Formation (source interval) [23], all of which are in the over-mature stage. In these gas fields, due to high temperatures, the carbon isotope composition of alkane gas is almost completely inverted and becomes a negative carbon isotopic composition series (δ13C1>δ13C2>δ13C3) [2430]. There are two types of negative carbon isotopic composition series: primary (the carbon isotope series of abiogenic alkane gas) and secondary (the carbon isotope series of biogenetic alkane gas). The latter type is the product of the shale with high TOC at high- temperature and over-mature stages [31], which is formed from positive carbon isotopic composition series (δ13C1<δ13C2<δ13C3< δ13C4) of primary biogenetic alkane gas by high-temperature modification. The carbons in CH4 can be composed of C12 and C13. At high temperatures, C12 is more likely and easily to be fractionated, resulting in heavier δ13C1. So, the δ13C1 value of secondary negative carbon isotope is heavier than that of positive carbon isotopes, which allows the δ13C1 value in Well SL08 in the Shangluo shale gas field in the Changning block to reach -21.6‰.
The δ13C1 values (-54.4‰ to -21.6‰) of oil-related gas from large gas fields in China were incorporated into the δ13C1 scale of large gas fields in China to obtain the δ13C1 scale of oil-related gas (Fig. 4a).

3.3. The δ13C1 value of coal-derived gas is between -49.3‰ and -18.9‰, with an interval value of 30.4‰

The minimum δ13C1 value of coal-derived gas from large gas fields in China is -49.3‰, which appears in Well LD22-1-5 in the Ledong 22-1 gas field of the Ying-Qiong Basin and is categorized as positive carbon isotopic composition series [2]. The maximum δ13C1 value of coal-derived gas from large gas fields in China is -18.9‰, which is found in Well P 3H-6-1 in the Dongping gas field of the Qaidam Basin (Table 2) and belongs to the negative carbon isotope series [2]. In the previous studies, the minimum and maximum δ13C1 values of coal-derived gas were believed to range from -42‰ to -26‰ according to Zhang et al. [15], from -36‰ to -31‰ according to Zhang et al. [17], and from -43‰ to -15‰ according to Dai et al. [22].
The δ13C1 values (-49.3‰ to -18.9‰) of coal-derived gases from large gas fields in China were incorporated into the δ13C1 scale of large gas fields in China to obtain the δ13C1 scale of coal-derived gas (Fig. 4a).

3.4. The δ13C1 value of abiogenic gas is between -35.6‰ and -11.4‰, with an interval value of 24.2‰

The minimum δ13C1 value of abiogenic gas from large gas fields in China is -35.6‰, which appears in Well XS1 in the Xushen gas field of the Songliao Basin (Table 2). There are two views on the genesis of alkane gas in the Xushen gas field: abiogenic gas [32-33]; and the mixture of abiogenic gas and coal-derived gas [2]. Although many scholars have proposed that there are three δ13C1 values (greater than -30‰, -25‰, -20‰) for the identification of abiogenic gas [34], indicating that the δ13C1 values of abiogenic gas are very heavy (all greater than -30‰), most δ13C1 values of abiogenic gas related to hot springs after the volcanic period in China are greater than -30‰, but there are also lighter values (-32.7‰ to -36.2‰) (Table 4). The δ13C1 value in Well XS19 is -35.6‰, which is between -32.7‰ and -36.2‰. Hence, -35.6‰ is an appropriate minimum δ13C1 value of abiogenic gas from large gas fields in China.
Table 4. The δ13C1 values of abiogenic gas related to hot springs after the volcanic period in China [34]
Sampling location Main components of gas/% δ13C/‰ Helium
isotope (R/Ra)
N2 CO2 CH4 He CH4 CO2
Tengchong City, Yunnan Province Xiaogunguo hot spring 0.31 99.09 0.500 0.014 -20.6 -1.2 3.37
Dagunguo hot spring 1.24 97.35 1.350 0.042 -19.5 -2.0 3.26
Zhenzhu hot spring 99.92 0.080 -21.2 -3.3 3.34
Huaitaijing hot spring 3.20 96.66 0.130 -21.0 -3.2 3.80
Zaotanghe (II) 2.54 96.81 0.345 0.005 -20.0 -1.9 2.86
Huangguaqing hot spring 0.63 98.51 0.860 -20.5 -2.3 4.44
Dieshuihe cold spring 3.09 96.82 0.010 0.016 -30.0 -1.3 4.49
Heshun Township mineral spring 2.15 97.81 0.010 0.009 -32.7 -5.8 3.36
Tianchi hot spring (1) in Changbai Mountain,
Jilin Province
0.65 98.62 0.640 0.002 -36.2 -6.0
Tianchi hot spring (3) in Changbai Mountain,
Jilin Province
99.64 0.029 0.010 -24.0 -5.8 1.19
Hot spring and river spring 1, Tuoba Town,
Ganzi County, Sichuan Province
2.72 93.00 3.640 0.602 -29.9 -2.9 3.50
The maximum δ13C1 value of abiogenic gas from large gas fields in China is -11.4‰, which appears in Well CS1 in the Changling I gas field of the Songliao Basin (Table 2, Table 5). The Changling I gas field and Songnan gas field are structurally located in the Harjin fault nose structure, the central uplift of the Changling Rift. The Changling I gas field belongs to the royalty of PetroChina, while the Songnan gas field belongs to the royalty of Sinopec. In fact, the two gas fields should be one, so the natural gas from the two fields should have similar origins (Table 5). In Table 4, the δ13C1, δ13CCO2 and R/Ra values range from -36.2‰ to -19.5‰ (mainly greater than -30‰), -6.0‰ to -1.2‰, and 1.19 to 4.49, respectively. In Table 5, the δ13C1, δ13CCO2 and R/Ra values range from -32.7‰ to -11.4‰ (mainly greater than -30‰), -8.8‰ to -3.6‰, and 2.21 to 5.46, respectively. δ13CCO2<-10‰ indicates biogenetic CO2; δ13CCO2>-9‰ indicates abiogenic CO2 in most cases, while δ13CCO2 between -10‰ and -9‰ suggests mixed biogenetic and abiogenic CO2; δ13CCO2≥-8‰ represents exclusively abiogenic CO2 [35]. Accordingly, CO2 in Tables 4 and 5 is biogenetic. The R/Ra value of crust-source helium is less than 0.05 [36-37], while that of mantle-source helium is usually greater than 5 [38]. When the R/Ra value is between 0.05 and 5.00, it is a mixed crustal- and mantle-source helium, which often occurs in rifted petroliferous basins, such as the Bohai Bay Basin and the Songliao Basin [39]. The R/Ra values in Table 5 have the feature of mixed crustal- and mantle-source helium. As mentioned above, the δ13C1 values (from -36.2‰ to -19.5‰) related to the post-volcanic period in Table 4 are abiogenic. In Table 5, the δ13C1 values (from -32.7‰ to -11.4‰) in the Changling I gas field and the Songnan gas field are heavier than those in Table 4, so they should also be abiogenic. The previous studies have shown that in the Songliao Basin, the alkane gas in negative carbon isotope series (δ13C1>δ13C2>δ13C3>δ13C4) with R/Ra>0.5 is abiogenic [34]. This also proves that alkane gas in the Changling I and Songnan large gas fields is abiogenic. It should be particularly pointed out that the confirmation of the natural gas from the Changling I and Songnan gas fields as abiogenic from the perspective of carbon isotopes and series of alkane gas, as well as δ13C CO2 and R/Ra values, is the first practice in China, but also possibly the first trial in the world, so it is meaningful.
Table 5. Components and isotopic compostions of natural gas from Changling I and Songnan gas fields of Songliao Basin
Gas field Well Major components of natural gas/% δ13C/‰ R/Ra
CH4 C2H6 C3H8 C4H10 CO2 N2 CH4 C2H6 C3H8 C4H10 CO2
Changling I CS1 71.40 1.79 0.11 0 22.56 4.14 -23.0 -26.3 -27.3 -34.0 -6.8 2.88
CS1-1 75.45 1.91 0.21 0 12.55 5.87 -22.2 -26.9 -27.0 -33.7 -7.5 2.91
CS2 1.57 0.01 0 0 97.45 0.71 -17.5 -26.2 -26.0 -3.6 2.94
CS12 -32.7 -37.4 -31.9 -29.5
C104 -11.4 -23.0 -27.8
CS6 0.40 0 0 0 98.70 0.90 -25.1 -29.6 -30.9 -6.3 5.46
Songnan YS1 71.72 1.22 0.05 20.74 -23.6 -26.5 -26.7 -33.2 -7.9
YD3HF 75.13 1.32 0.08 0.02 16.67 6.73 -19.1 -27.9 -29.7 -8.8 2.21
YD9HF 91.35 1.55 0.14 0.04 0.68 6.15 -23.7 -30.6 -33.1 -8.5 2.75
YP12 76.51 1.32 0.06 0 14.90 7.12 -22.9 -28.1 -28.1 -7.5 2.29
YP13 63.57 1.09 0.05 0 29.42 5.76 -25.0 -28.9 -7.3 2.47
YP2 57.29 0.98 0.05 0 35.47 6.02 -25.0 -28.6 -7.4 2.25
The δ13C1 values (-35.6‰ to -11.4‰) of abiogenic gas from large gas fields in China were incorporated into the δ13C1 scale of large gas fields in China to obtain the δ13C1 scale of abiogenic gas (Fig. 4a). It can be known that the δ13C1 scale of abiogenic gas is the heaviest part in Fig. 4a.

4. The δ13C1 values distribution of biogas, oil-related gas, coal-derived gas, and abiogenic gas in natural gas in China

The δ13C1 values of natural gas in China range from -107.1‰ to -8.9‰, containing the δ13C1 interval values of large gas fields in China. Unlike that all the methane in large gas fields in China is produced in gas wells, the methane in natural gas (excl. methane in inclusions) in China is produced in gas wells, but also in hot springs, rivers, marshes, hydrates, coal seams, etc.

4.1. The δ13C1 value of biogas in natural gas in China is between -107.1‰ and -55.1‰, with an interval value of 52.0‰

The minimum δ13C1 value of biogas is -107.1‰, which is found in shallow sediments of the Dongsha Islands [39]. The maximum δ13C1 value of biogas is -55.1‰, which appears in Well Bian 12-1 in the Jinhu Depression of the Subei Basin [40]. Based on the maximum and minimum δ13C1 values of biogas, the δ13C1 scale of biogas in natural gas in China was obtained (Fig. 4b).

4.2. The δ13C1 value of oil-related gas in natural gas in China is between -54.4‰ and -21.6‰, with an interval value of 32.8‰

So far, no maximum and minimum δ13C1 values of oil-related gas in natural gas in China heavier and lighter than those in large gas fields in China have been found. Therefore, the maximum and minimum δ13C1 values of oil-related gas in large gas fields in China are taken as the maximum and minimum δ13C1 values of oil-related gas in natural gas in China. Based on these values, the δ13C1 scale of oil-related gas was obtained (Fig. 4b).

4.3. The δ13C1 value of coal-derived gas in natural gas in China is between -49.3‰ and -13.3‰, with an interval value of 36.0‰

As no minimum δ13C1 value of coal-derived gas in natural gas in China that is lighter than the minimum δ13C1 value of coal-derived gas in large gas fields in China has been found, -49.3‰ is also used for it. The maximum δ13C1 value of coal-derived gas in natural gas in China is -13.3‰ currently, in the Yutianbao coalbed methane of the Nantong coalfield, Chongqing [41]. An even heavier δ13C1 value may be discovered in the future, because Russia has found that the maximum δ13C1 value of coalbed methane is up to -10‰ [42]. Based on the maximum and minimum δ13C1 values of coal-derived gas in natural gas in China, the δ13C1 scale of oil-related gas was obtained (Fig. 4b).

4.4. The δ13C1 value of abiogenic gas in natural gas in China is between -36.2‰ and -8.9‰, with an interval value of 27.3‰

The minimum δ13C1 value of abiogenic gas in natural gas in China is -36.2‰, which appears in the Tianchi hot spring (I) in Changbai Mountain, Jilin Province (Table 4). The maximum δ13C1 value is -8.9‰, which is in Chengtian radon spring in Taishun County, Zhejiang Province. Based on the maximum and minimum δ13C1 values of abiogenic gas in natural gas in China, the δ13C1 scale of abiogenic gas was obtained (Fig. 4b).

5. Connotation and characteristics of the δ13C1 values scale

Previous studies successfully used the δ13C1 values to identify the gas type (biogas, oil-related gas, coal-derived gas, or abiogenic gas) and obtain the Ro value and formation temperature of a gas, and also combined the δ13C1 values and the carbon isotopic combinations of alkane gas (δ13C1<δ13C2<δ13C3<δ13C4, δ13C1>δ13C2>δ13C3>δ13C4, δ13C1> δ13C2<δ13C3>δ13C4) to determine the genesis of alkane gas (primary, secondary, or abiogenic). However, there are no digital-domain studies on δ13C1 from the view of point and line with respect to the maximum, the minimum, or both. The δ13C1 values scale reflects the digital-domain study.
On the δ13C1 values scale, the intervals of δ13C1 values for biogas, oil-related gas, coal-derived gas and abiogenic gas are clearly divided. The interval with the minimum δ13C1 value is biogas; the interval with the maximum δ13C1 value is abiogenic methane; the intervals between them are oil-related gas and coal-derived gas. The scale interval of δ13C1 value for biogas has the lowest gas-forming temperature; that for abiogenic methane has the highest gas-forming temperature; the oil-related gas and coal-derived gas between the above two are formed at pyrolysis and cracking temperature. The gas-forming materials for biogas, oil-related gas and coal-derived gas are organic matters, while for abiogenic methane, they are abiogenic. Study and interpretation of the δ13C1 scale just begun, and more connotations and features can be launched in the future.

6. Conclusions

Based on the components and carbon isotopic composition of alkane gas of 1 696 gas samples from the 70 large gas fields in China, as well as the carbon isotopic composition of natural gas and related methane in China, the characteristics of carbon isotopic composition of alkane gas in the large gas fields and natural gas in China were obtained.
In the large gas fields in China, the minimum, average, and maximum values of δ13C1 are -71.2‰, -33.2‰ and -11.4‰, respectively; those of δ13C2 are -52.3‰, -26.5‰ and -3.8‰, respectively; those of δ13C3 are -51.6‰, -24.9‰ and -14.2‰, respectively; those of δ13C4 are -34.4‰, -23.2‰ and -16.0‰, respectively. Based on these data, it is found that (1) the minimum and average values of δ13C1, δ13C2, δ13C3 and δ13C4 become heavier as the carbon number in the molecule increases; and (2) the maximum values of δ13C1, δ13C2, δ13C3 and δ13C4 become lighter as the carbon number in the molecule increases.
The δ13C1 values in the large gas fields in China range from -71.2‰ to -11.4‰ (from -71.2‰ to -56.4‰ for biogas; from -54.4‰ to -21.6‰ for oil-related gas; from -49.3‰ to -18.9‰ for coal-derived gas; from -35.6‰ to -11.4‰ for abiogenic gas). Accordingly, the δ13C1 scale of large gas fields in China was obtained.
The δ13C1 values of natural gas in China range from -107.1‰ to -8.9‰ (from -107.1‰ to -55.1‰ for biogas; from -54.4‰ to -21.6‰ for oil-related gas; from -49.3‰ to -13.3‰ for coal-derived gas; from -36.2‰ to -8.9‰ for abiogenic gas). Accordingly, the δ13C1 scale of natural gas in China was obtained.
[1]
DAI Jinxing, CHEN Jianfa, ZHONG Ningning, et al. Large gas fields and their gas sources in China. Beijing: Science Press, 2003: 6-8.

[2]
DAI Jinxing, DONG Dazhong, HU Guoyi, et al. Large gas fields and gas sources in China. Beijing: Petroleum Industry Press, 2024.

[3]
DAI Jinxing. Enhance the studies on natural gas geology and find more large gas fields in china. Natural Gas Geoscience, 2003, 14(1): 3-14.

[4]
IHS ENERGY. West Siberian Basin. Houston: IHS Inc, 2023. [2023-12-02]. https://www.ihs.com/.

[5]
DAI Jinxing. Distribution, classification and origin of natural gas with hydrogen sulphide in china. Acta Sedimentologica Sinica, 1985, 3(4): 109-120.

[6]
DAI Jinxing. Identification of various types of alkane gases. Scientia Sinica (Chimica), 1992, 22(2): 185-193.

[7]
DAI Jinxing. Significance of the study on carbon isotopes of alkane gases. Natural Gas Industry, 2011, 31(12): 1-6.

[8]
DAI Jinxing. Coal-derived gas theory and its discrimination. Chinese Science Bulletin, 2018, 63(14): 1291-1305.

[9]
FU Jiamo, LIU Dehan, SHENG Guoying. Coal-generated hydrocarbon geochemistry. Beijing: Science Press, 1990: 103-113.

[10]
XU Yongchang, SHEN Ping, LIU Wenhui, et al. Theory and application of natural gas genesis. Beijing: Science Press, 1994: 344-375.

[11]
State Key Laboratory of Gas Geochemistry, Lanzhou Institute of Geology, Chinese Academy of Sciences. Collection of natural gas geochemistry. Beijing: Geological Publishing House, 2002: 496-499.

[12]
ZHANG Shuichang, HU Guoyi, LIU Shaobo, et al. Chinese natural gas formation and distribution. Beijing: Petroleum Industry Press, 2019: 140-172.

[13]
WEI Guoqi, LI Jian, YANG Wei, et al. Geology and exploration of onshore gas in China. Beijing: Science Press, 2014.

[14]
WANG Shiqian. Geo-chemical characteristics of Jurassic-Sinian gas in Sichuan Basin. Natural Gas Industry, 1994, 14(6): 1-5.

[15]
ZHANG Shiya, GAO Jianjun, JIANG Tairan. A new method of identifying natural gas types using methane and ethane carbon isotopes: Institute of Petroleum Geology, Ministry of Geology and Mineral Resources. Petroleum and natural gas symposium: Vol.1: Research on coal derived gas in China. Beijing: Geological Publishing House, 1988: 48-58.

[16]
LU Shuangfang, ZHANG Min. Petroleum geochemistry. Beijing: Petroleum Industry Press, 2008: 138-161.

[17]
ZHANG Houfu, FANG Chaoliang, GAO Xianzhi, et al. Petroleum Geology. Beijing: Petroleum Industry Press, 1999: 77-79.

[18]
STAHL W J, CAREY B D, Jr. Source-rock identification by isotope analyses of natural gases from fields in the Val Verde and Delaware basins, west Texas. Chemical Geology, 1975, 16(4): 257-267.

DOI

[19]
RICE D D, CLAYPOOL G E. Generation, accumulation, and resource potential of biogenic gas. AAPG Bulletin, 1981, 65(1): 5-25.

[20]
SCHOELL M. Genetic characterization of natural gases. AAPG Bulletin, 1983, 67(12): 2225-2238.

[21]
DAI Jinxing, CHEN Ying. Characteristics of carbon isotope of alkane components and identification markers of biogenic gases in Chine. Scientia Sinica (Chimica), 1993, 23(3): 303-310.

[22]
DAI Jinxing, PEI Xigu, QI Houfa.Natural gas geology in China (Vol.1). Beijing: Petroleum Industry Press, 1992: 65-87.

[23]
DAI Jinxing, DONG Dazhong, NI Yunyan, et al. Some essential geological and geochemical issues about shale gas research in China. Natural Gas Geoscience, 2020, 31(6): 745-760.

[24]
DAI J X, ZOU C N, LIAO S M, et al. Geochemistry of the extremely high thermal maturity Longmaxi shale gas, southern Sichuan Basin. Organic Geochemistry, 2014, 74: 3-12.

DOI

[25]
DAI J X, ZOU C N, DONG D Z, et al. Geochemical characteristics of marine and terrestrial shale gas in China. Marine and Petroleum Geology, 2016, 76: 444-463.

DOI

[26]
FENG Z Q, HAO F, DONG D Z, et al. Geochemical anomalies in the Lower Silurian shale gas from the Sichuan Basin, China: Insights from a Rayleigh-type fractionation model. Organic Geochemistry, 2020, 142: 103981.

DOI

[27]
NI Y Y, DONG D Z, YAO L M, et al. Hydrogen isotopic characteristics of shale gases. Journal of Asian Earth Sciences, 2023, 257: 105838.

DOI

[28]
NI Y Y, DONG D Z, YAO L M, et al. Geochemical characteristics and origin of shale gases from Sichuan Basin, China. Frontiers in Earth Science, 2022, 10: 861040.

DOI

[29]
LIU Q Y, JIN Z J, WANG X F, et al. Distinguishing kerogen and oil cracked shale gas using H, C-isotopic fractionation of alkane gases. Marine and Petroleum Geology, 2018, 91: 350-362.

DOI

[30]
GUO Tonglou. Discovery and characteristics of the Fuling shale gas field and its enlightenment and thinking. Earth Science Frontiers, 2016, 23(1): 29-43.

DOI

[31]
DAI Jinxing, NI Yunyan, HUANG Shipeng, et al. Origins of secondary negative carbon isotopic series in natural gas. Natural Gas Geoscience, 2016, 27(1): 1-7.

[32]
DAI Jinxing, LI Jian, LIU Dan. Giant coal derived gas fields and their gas sources in China. Beijing: Science Press, 2014: 306-320.

[33]
NI Yunyan, DAI Jinxing, ZHOU Qinghua, et al. Geochemical characteristics of abiogenic gas and its percentage in Xujiaweizi Fault Depression, Songliao Basin, NE China. Petroleum Exploration and Development, 2009, 36(1): 35-45.

DOI

[34]
DAI Jinxing, ZOU Caineng, ZHANG Shuichang, et al. Discrimination of abiogenic and biogenic alkane gases. SCIENCE CHINA Earth Sciences, 2008, 51(12): 1737-1749.

DOI

[35]
DAI Jinxing. Identification of various genetic natural gases. China Offshore Oil and Gas, 1992, 6(1): 11-19.

[36]
MAMYRIN B A, TOLSTIKHIN I N. Helium isotopes in nature. Amsterdam: Elsevier Scientific Publishing Company, 1983.

[37]
ANDREWS J N. The isotopic composition of radiogenic helium and its use to study groundwater movement in confined aquifers. Chemical Geology, 1985, 49(1/2/3): 339-351.

DOI

[38]
WHITE W M. Isotope geochemistry. Chichester: Wiley Blackwell, 2015: 436-438.

[39]
JIN Qinghuan, ZHANG Guangxue, YANG Muzhuang, et al. Introduction to natural gas hydrates resources. Beijing: Science Press, 2006: 4-6.

[40]
QI Houfa, GUAN Deshi, QIAN Yibo, et al. Conditions of bacterial gas reservoir formation in China. Beijing: Petroleum Industry Press, 1997: 230-268.

[41]
YING Yupu, WU Jun, LI Renwei, et al. The discovery of abnormal heavy carbon isotopic composition in China coal bed methane and its origin. Chinese Science Bulletin, 1990, 35(19): 1491-1493.

[42]
ALEXEEV F A. Methane. Moscow: Mineral Press, 1978: 230-236.

Outlines

/