

Introduction
The permeability, wettability and residual oil viscosity of waterflooding reservoirs gradually change after long- term water flooding, and especially during the high water cut period of medium-high permeability reservoirs, the time-varying phenomena of reservoir parameters are more apparent. The changes of rock wettability and oil viscosity in the process of waterflooding development have greater influence on waterflooding efficiency and remaining oil distribution [1]. There are many literatures on the time-varying laws of rock wettability and oil viscosity during long-term water flooding in medium-high permeability sandstone reservoirs [2⇓⇓⇓-6]. Among them, the researches on the time-varying of wettability mainly adopt the contact angle method, imbibition method (Amott), and centrifugation method (United States Bureau of Mines, USBM). The imbibition method and centrifugation method are both difficult and time-consuming when characterizing the changes in wettability of cores. The contact angle method not only damages the core, but also cannot reflect the overall wettability of the core but local of it.
The variation in oil viscosity is mainly characterized by the data of oil viscosity obtained from the interpretation of NMR logging data at different water cut stages. However, the viscosity of oil at different positions between injection and production wells exhibits heterogeneous distribution characteristics due to differences in flooding degree. The oil viscosity interpreted from logging data is an average value, not the value at different positions in the reservoir. It is unable to accurately characterize the time-varying laws of oil viscosity at different locations in the reservoir during long-term water flooding. At present, there have been no reports on the application of high multiple waterflooding experiments to analyze the time-varying law of oil viscosity. This is mainly because the volume of produced oil decreases with the increase of displacing water multiple, and the commonly used viscosity measurement method (rotation method) in the laboratory is difficult to effectively measure the oil viscosity.
Nuclear magnetic resonance technology (NMR) plays an important role in reservoir pore structure evaluation [7⇓⇓-10] and fluid analysis [11⇓⇓-14]. The nuclear magnetic resonance relaxation signal is only related to the hydrogen atoms in the formation, so that the T2 spectral response characteristics can reflect the pore and fluid characteristics unrelated to the formation lithology. Significant progress has been made in characterizing rock wettability and oil viscosity using NMR. Looyestijn et al. [15] defined the NMR wettability index based on hydrophilic and oleophilic surface areas, while Fleury et al. [16] established a formula for calculating the NMR wettability index based on nuclear magnetic resonance relaxation theory. Although this formula has been gradually improved with the development of NMR technology [17⇓⇓⇓-21], there are still problems: (1) T2 spectra need to be measured in four states of saturated oil, saturated water, irreducible water and residual oil; (2) The derivation of the wettability index formula assumes that the rock wettability remains unchanged during water flooding, which is inconsistent with reality; (3) Calculating the wettability index requires calculating the water oil surface relaxation ratio first, which is a complex process.
The viscosity of oil characterized by NMR is measured by placing the oil in a test tube [22⇓⇓-25], not the viscosity of oil in porous medium. However, when predicting the viscosity of oil in porous medium by NMR, it is assumed that the rock is completely water wet, and the time variation of rock wettability is not considered. In addition, it is assumed that the relaxation type of water and oil in the process of prediction are surface relaxation and bulk relaxation respectively. Under actual mixed wet conditions, however, the relaxation type of some oil attached to the pore surface in the core is surface relaxation, resulting in significant errors in the prediction of oil viscosity [26-27].
It can be seen that the current method of characterizing rock wettability and oil viscosity by NMR is difficult to meet the needs in researching the time-varying laws of rock wettability and oil viscosity during high multiple waterflooding process. Therefore, this paper analyzed the relationship between the oil viscosity and the geometric mean of T2 spectrum and established a simulated oil viscosity prediction model based on the geometric mean of T2 spectrum. In addition, it derived a new wettability index calculation formula based on NMR relaxation theory, achieving the quantitative characterization of the time-varying law of oil viscosity and rock wettability in high multiple waterflooding cores.
1. Design of NMR experiment
1.1. Materials
The experimental fluids include 26# white oil, kerosene, simulated formation water and manganese water. The viscosity of 26# white oil is 52.4 mPa·s, and the density is 0.847 g/cm3; the viscosity of kerosene is 1.56 mPa·s, and the density is 0.798 g/cm3; the salinity of simulated formation water (prepared with NaCl) is 9 000 mg/L; the mass concentration of MnCl2 in manganese water (prepared by simulated formation water) is 5 000 mg/L, and the density is 1.012 g/cm3. The cores used in the experiment are one Berey sandstone core and one natural outcrop sandstone core, numbered B600-1 and T600-1, respectively. Their physical parameters are shown in Table 1.
Table 1. Physical property parameters of experimental cores |
| Core No. | Length/ cm | Diameter/ cm | Permeability/ 10−3 μm2 | Porosity/ % |
|---|---|---|---|---|
| B600-1 | 5.01 | 2.51 | 639 | 20.7 |
| T600-1 | 4.98 | 2.53 | 667 | 18.2 |
1.2. Equipment
It includes BROOLFIELD viscometer (DVNext), high- temperature and high-pressure online flooding NMR imaging system (SPEC-RC035), and multi-functional core flooding device (from Chengdu Core Technology Company Ltd.).
1.3. Process
All routine fluid analysis tests, core flooding, and NMR analysis experiments in this paper were conducted under normal atmospheric temperature (25 °C).
Oil viscosity experiment. Prepare simulated oil with different mass ratios of white oil and kerosene, and then measure the viscosity of the simulated oil (Table 2 ). Use CPMG (Carr-Purcell-Meiboom-Gill) sequence to measure the NMR T2 spectrum of oil with different viscosities, and obtain the empirical relationship between oil viscosity and NMR T2 spectrum. The measurement parameters of NMR T2 spectrum are as follows. The main frequency is 15.14 MHz, the number of echoes is 4 096, the waiting time is 3 000 ms, the pulse interval is 0.3 ms, and the scanning frequency is 64 times.
Table 2. Composition ratio and viscosity data of simulated oil |
| No. | Mass ratio of white oil to kerosene | Viscosity/ (mPa·s) | No. | Mass ratio of white oil to kerosene | Viscosity/ (mPa·s) |
|---|---|---|---|---|---|
| 1 | 1:1 | 6.62 | 6 | 3:1 | 16.7 |
| 2 | 11:9 | 7.87 | 7 | 4:1 | 20.8 |
| 3 | 3:2 | 9.31 | 8 | 17:3 | 25.6 |
| 4 | 13:7 | 11.5 | 9 | 9:1 | 32.3 |
| 5 | 7:3 | 13.8 |
High multiple waterflooding NMR experiment. Referring to the industry standard GB/T28912-2012 [28], set the flooding speed to 1.0 mL/min. To accurately reflect the actual flooding degree of the reservoir, the maximum water displacing multiple was set according to Reference [5], increasing from the industry standard of 30 PV (pore volume multiple) to 2 000 PV. The experiment on the time-varying law of rock wettability and oil viscosity during high multiple waterflooding mainly considers the cumulative flooding effect of injected water, that is, the relationship of rock wettability and oil viscosity with displacing water multiple. The experimental steps are: (1) Measure the T2 spectrum of the core saturated with manganese water; (2) Use 3# simulated oil (density of 0.826 g/cm3) to displace the core saturated with manganese water until there is no water at the outlet, and establish irreducible water state; (3) Measure the T2 spectrum of the core in the irreducible water state, and scan and image the cross-section of the core; (4) Use manganese water to displace oil, close the inlet and outlet gate valves when the injection volume reaches 30, 300, 500, 700, 1 000, 1 300, 1 600, 2 000 PV, and measure and image the T2 spectrum of the core, while measuring the T2 spectrum of the produced liquid; (5) Record the displacement pressure difference and the volume of oil and water at the outlet during the flooding processes.
2. Dynamic production of high multiple waterflooding core
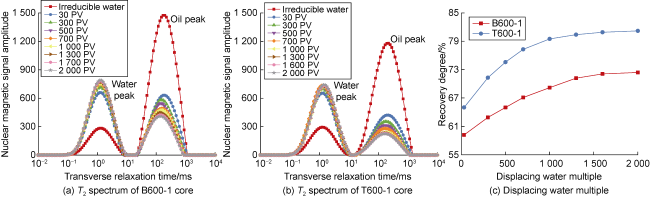
Fig. 1. T2 spectrum and the simulated oil recovery degree curves of cores at different displacing water multiples. |
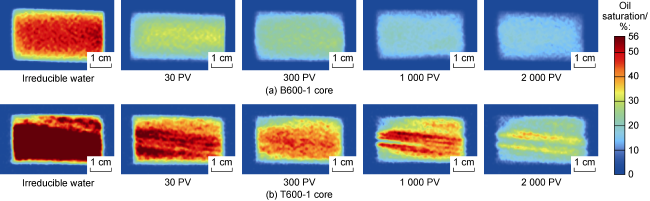
Fig. 2. NMR images of core at different displacing water multiples. |
3. Time-varying characteristics of oil viscosity in high multiple waterflooding
The geometric mean of T2 spectrum can characterize the change characteristics of T2 spectrum, and the extraction of the geometric mean can be done using the following formula [29]:
$T_{2,\text{g}}^{{}}={{\left( \prod\limits_{i=1}^{N}{T_{2,i}^{^{{{M}_{i}}}}} \right)}^{{1}/{M}\;}}$
${{\mu }_{\text{o}}}=8\ 613{{T}_{\text{bo,g}}}^{-1.237}$
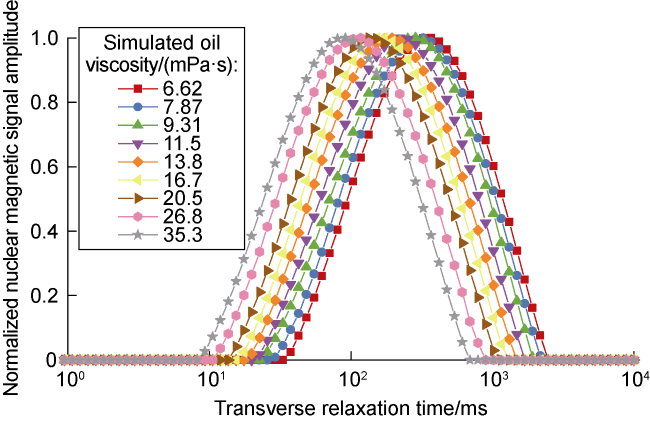
Fig. 3. T2 spectral curves of simulated oil with different viscosities. |
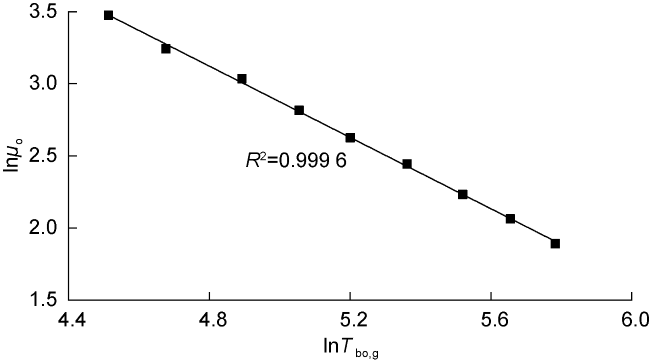
Fig. 4. Relationship between simulated oil viscosity and T2 spectral geometric mean. |
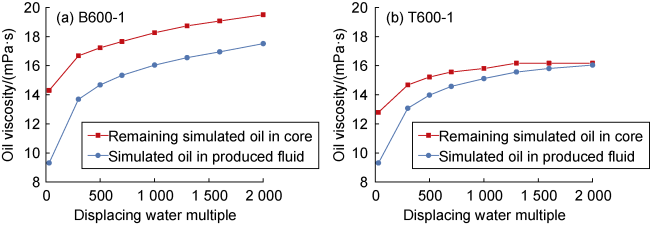
Fig. 5. Viscosity change curve of remaining simulated oil in core and simulated oil in produced fluid. |
4. Time-varying characteristics of rock wettability in high multiple waterflooding
4.1. The time-varying phenomenon of rock wettability in experiment
In actual experiments, the original T2 spectra of the core and produced liquid measured by NMR both have two peaks. Due to the separation of oil and water nuclear magnetic resonance signals, the water peak signal has no effect on the change of the oil peak. For the convenience of comparative analysis, only the oil peak signal is displayed. Fig. 6 shows the normalized T2 spectrum curves of oil in the cores and produced fluid under different displacing water multiples of two cores. Based on this, Eq. (1) is used to calculate the geometric mean value of T2 spectrum in Fig. 6 (Table 3 ). Through comparison, it is found that the geometric mean value of T2 spectrum of simulated oil in core is smaller than that in produced fluid, mainly because the bulk relaxation of simulated oil is basically the same whether it is in produced fluid or remaining in core. The relaxation type of simulated oil in produced fluid is bulk relaxation, while in addition to the bulk relaxation of simulated oil in core, there is a part of surface relaxation of simulated oil attached to pore surface in core. The difference between the two data indicates the existence of surface relaxation of simulated oil in the core and the surface relaxation changes with the increase of displacing water multiple, confirming the existence of wettability time-varying in the core. In the residual oil state after low multiple water flooding (displacing water multiple less than 30 PV), the two cores are not completely water wet and exhibit mixed wetting. As the displacing water multiple increases, the oil attached to the surface of the pores in the core is washed out by the flooding water for a long time, resulting in a decrease in the oleophilic surface area and a weakening of the surface relaxation of the oil in the core. The difference in the geometric mean of T2 spectrum of the oil in the core and the oil in the produced fluid becomes smaller. The water-wetting degree of the core increases with the increase of displacing water multiple.
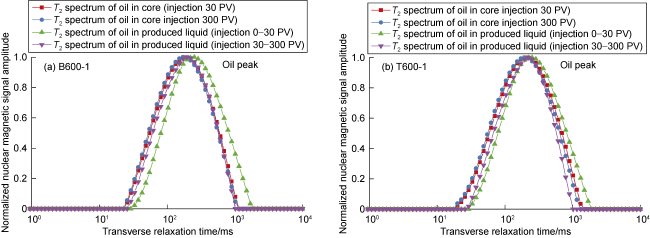
Fig. 6. Normalized T2 spectral curves of oil in core and produced liquid at different displacing water multiples. |
Table 3. T2 spectrum geometric mean value of oil in core and oil in produced liquid at different displacing water multiples |
| Core No. | Geometric mean value of T2 spectrum of oil in core/ms | Geometric mean value of T2 spectrum of oil in produced liquid/ms | Geometric mean difference value of T2 spectra of oil in core and produced liquid/ms | |||
|---|---|---|---|---|---|---|
| Injected by 30 PV | Injected by 300 PV | Injected by 0-30 PV | Injected by 30-300 PV | Injected by 30 PV | Injected by 300 PV | |
| B600-1 | 176.8 | 169.7 | 253.9 | 182.7 | 77.1 | 13.0 |
| T600-1 | 193.4 | 180.9 | 251.3 | 190.0 | 57.9 | 9.1 |
4.2. Time-varying characterization method for wettability
$\frac{1}{{{T}_{2}}}=\frac{1}{{{T}_{2\text{b}}}}+{{\rho }_{2}}\frac{A}{V}$
When there is a two-phase fluid of oil and water in the pores and the rock is mixed wet, the T2 of water and oil in the pores can be expressed as follows according to Eq. (3):
$\left\{ \begin{matrix} \frac{1}{{{T}_{2,\text{w}}}}=\frac{1}{{{T}_{2\text{b},\text{w}}}}+{{\rho }_{2,\text{w}}}\frac{{{A}_{\text{w}}}}{V{{S}_{\text{w}}}} \\ \frac{1}{{{T}_{2,\text{o}}}}=\frac{1}{{{T}_{2\text{b},\text{o}}}}+{{\rho }_{2,\text{o}}}\frac{{{A}_{\text{o}}}}{V{{S}_{\text{o}}}} \\\end{matrix} \right.$
Looyestijn et al. [15] demonstrated that the wettability of rocks can be quantitatively characterized by NMR wettability index:
${{I}_{w}}=\frac{{{A}_{w}}-{{A}_{\text{o}}}}{{{A}_{w}}+{{A}_{\text{o}}}}$
The range of NMR wettability index is [−1.0, 1.0], where −1.0 indicates completely oil wetting, 0 indicates neutral wetting, and 1.0 indicates completely water wetting.
Fleury et al. [16] used the peak relaxation time of cores in the states of saturated water, saturated oil, irreducible water and residual oil to calculate the NMR wettability index:
${{I}_{\text{w}}}=\ \frac{{{S}_{\text{w}}}\left[ \frac{1}{{{T}_{\text{w},\text{m}}}\left( {{S}_{\text{or}}} \right)}\ \ -\ \ \frac{1}{{{T}_{\text{bw,m}}}} \right]\ \ -\ \ {{C}_{\rho }}{{S}_{\text{o}}}\left[ \frac{1}{{{T}_{\text{o},\text{m}}}\left( {{S}_{\text{wc}}} \right)}\ \ -\ \ \frac{1}{{{T}_{\text{bo,m}}}} \right]}{{{S}_{\text{w}}}\left[ \frac{1}{{{T}_{\text{w},\text{m}}}\left( {{S}_{\text{or}}} \right)}\ \ -\ \ \frac{1}{T_{\text{bw,m}}^{{}}} \right]\ \ +\ \ {{C}_{\rho }}{{S}_{\text{o}}}\left[ \frac{1}{{{T}_{\text{o},\text{m}}}\left( {{S}_{\text{wc}}} \right)}\ \ -\ \ \frac{1}{{{T}_{\text{bo,m}}}} \right]}$
${{C}_{\rho }}=\frac{{{\rho }_{\text{2,w}}}}{{{\rho }_{\text{2,o}}}}=\frac{\frac{1}{{{T}_{\text{w},\text{m}}}\left( {{S}_{\operatorname{w}1}} \right)}-\frac{1}{{{T}_{\text{bw,m}}}}}{\frac{1}{{{T}_{\text{o},\text{m}}}\left( {{S}_{\text{o}1}} \right)}-\frac{1}{{{T}_{\text{bo,m}}}}}$
This method selects the T2 spectrum at extreme oil/water saturation to calculate the NMR wettability index, as the peak relaxation time of the main fluid at extreme fluid saturation is reliable, but this value is weakly dependent on the presence of another fluid.
In the high multiple waterflooding NMR experiment, manganese water is used for flooding. The difference between the T2 spectrum of the core saturated with manganese water and the bulk relaxation time of manganese water is very small (Fig. 7 ), and Tw,m and Tbw,m are quite close and easily affected by the concentration of manganese chloride. The surface relaxation ratio calculated via. Eq. (7) is close to 0. It indicates that when Fleury method is applied, the T2 spectrum of manganese water presents instable performance when it is used to analyze the water-oil surface relaxation ratio and the NMR wettability index. It indicates that the T2 spectrum of manganese water is not suitable for this wettability analysis method. In this experiment, the NMR signals of oil and water measured during the flooding are separated, and the T2 spectrum of the core saturated with oil is more different from the bulk relaxation time of oil, so rock wettability can be analyzed directly based on the T2 spectrum characteristics of oil.
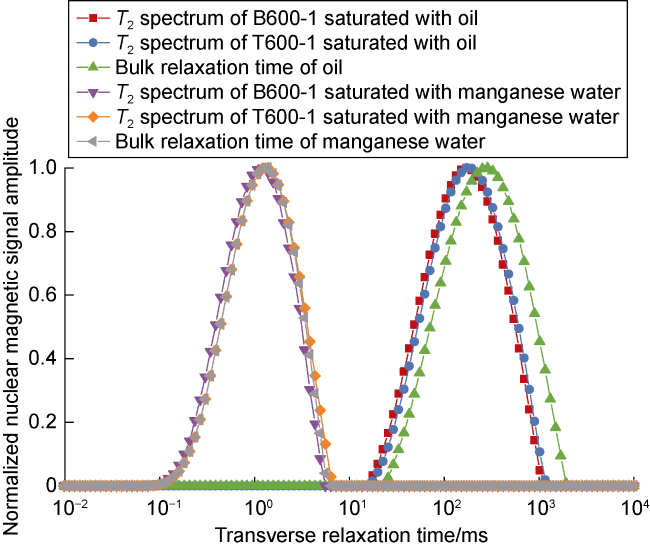
Fig. 7. Comparison of T2 spectrum of core saturated with manganese water and oil with the bulk relaxation of manganese water and oil. |
Based on the experimental characteristics of this article, we calculated the NMR wettability index using the geometric mean values of T2 spectra of saturated oil and oil in pores under different displacing water multiples. The geometric mean value of T2 spectrum of saturated oil in pores can be expressed as follows according to Eq. (3):
$\frac{1}{{{T}_{\text{o},\text{g}}}\left( {{S}_{\text{o1}}} \right)}=\frac{1}{{{T}_{\text{bo,g}}}\left( {{S}_{\text{o1}}} \right)}+{{\rho }_{\text{2,o}}}\frac{A}{V}$
According to Eq. (3), the T2 spectrum of oil in pores under different displacing water multiples during high multiple waterflooding processes can be expressed as follows:
$\frac{1}{{{T}_{\text{o},\text{g}}}\left( R \right)}=\frac{1}{{{T}_{bo,g}}\left( R \right)}+{{\rho }_{\text{2,o}}}\frac{{{A}_{\text{o}}}\left( R \right)}{V{{S}_{\text{o}}}\left( R \right)}$
The auxiliary equation is:
$A={{A}_{\text{w}}}\left( R \right)+{{A}_{\text{o}}}\left( R \right)$
The calculation formula for the NMR wettability index under different displacing water multiples can be obtained by combining Eqs. (8), (9) and (10) and substituting them into Eq. (5).
${{I}_{\text{w}}}\left( R \right)=\frac{\frac{1}{{{T}_{\text{o},\text{g}}}\left( {{S}_{o1}} \right)}\ -\ \frac{1}{{{T}_{\text{bo,g}}}\left( {{S}_{\text{o1}}} \right)}\ \ -\ \ 2{{S}_{\text{o}}}\left( R \right)\left[ \frac{1}{{{T}_{\text{o},\text{g}}}\left( R \right)}\ -\ \frac{1}{{{T}_{\text{bo,g}}}\left( R \right)} \right]}{\frac{1}{{{T}_{\text{o},\text{g}}}\left( {{S}_{\text{o1}}} \right)}\ -\ \frac{1}{{{T}_{\text{bo,g}}}\left( {{S}_{\text{o}1}} \right)}}$
4.3. Time-varying analysis of NMR wettability index
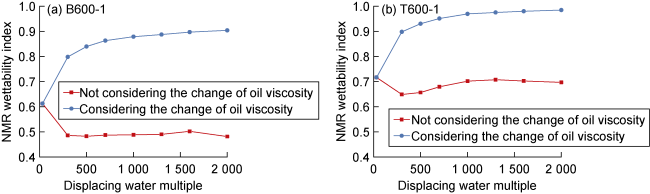
According to Eq. (11), the NMR wettability index is calculated. When the time-varying of oil viscosity is not considered, the geometric mean of the transverse bulk relaxation time of oil under different displacing water multiples is constant and equal to the geometric mean of the transverse bulk relaxation time of oil in the core saturated with oil. When considering the time-varying of oil viscosity, the geometric mean of the transverse bulk relaxation time of oil under different displacing water multiples is a variable, which can be calculated using the time-varying data of oil viscosity (Fig. 5 ) and the fitted formula of Eq. (2).
Fig. 8. Change of NMR wettability index at different displacing water multiples. |
The coring data of medium-high permeability sandstone reservoirs and the results of long-term indoor waterflooding experiments [1] indicate that after water injection, the oleophilic reservoirs change into hydrophilic mostly, while the hydrophilic reservoirs have stronger hydrophilicity. This is because during water injection process, the flooding of water flow increases the water saturation, and at the same time, the oil film on the oleophilic surface becomes thinner or is washed away, leading to the gradual increase of the hydrophilic surface area. And thus the wettability changes into hydrophilic or the hydrophilicity gets enhanced. Considering the simulated oil viscosity changes, the calculated NMR wettability index is more consistent with the tested Amott wettability index, which is more in line with the time-varying law of reservoir wettability and can better explain the mechanism of wettability changing towards hydrophilic after long-term waterflooding. It can be seen that there is a high correlation between the time-varying of oil viscosity and the time-varying of wettability, and the change of oil viscosity cannot be ignored.
5. Conclusions
The remaining oil viscosity in the core is positively correlated with the displacing water multiple. The remaining oil viscosity increases rapidly when the displacing water multiple is low, while it increases slowly when the displacing water multiple is high. The variation of remaining oil viscosity is related to the reservoir heterogeneity. The stronger the reservoir homogeneity, the higher the content of heavy components in the remaining oil and the higher the viscosity.
The reservoir wettability will change after water injection. The oil-wet reservoir will be changed to water-wet reservoir, and the water-wet reservoir will be more hydrophilic, whose degree of change will be enhanced with the increase of displacing water multiple.
There is a high correlation between the time-varying of oil viscosity and the time-varying of wettability, and the change of oil viscosity cannot be ignored. The NMR wettability index calculated by considering the change of oil viscosity is more consistent with the tested Amott wettability index, which is more consistent with the time-varying law of reservoir wettability.
Nomenclature
A—pore surface area, µm2;
Aw, Ao—pore area wetted by water and oil, µm2;
Aw(R), Ao(R)—pore area wetted by water and oil at different displacing water multiples, µm2;
Cρ—water-oil surface relaxation ratio, dimensionless;
i—index of the component in the T2 spectrum;
Iw—NMR wettability index, dimensionless;
Iw(R)—NMR wettability index at different displacing water multiples, dimensionless;
M—total amplitude of all T2 components, dimensionless;
Mi—amplitude of the ith T2 component, dimensionless;
N—total number of the components in the T2 spectrum;
R—displacing water multiple, dimensionless;
Sw, So—water and oil saturation, %;
So(R)—oil saturation at different displacing water multiples, %;
T2—transverse relaxation time of fluid, ms;
T2,i —transverse relaxation time of the ith component of T2 spectrum, ms;
T2,g—geometric mean value of the T2 spectrum, ms;
T2b—transverse bulk relaxation time of fluid, ms;
T2,w, T2,o—transverse relaxation time of water and oil, ms;
T2b,w, T2b,o—transverse bulk relaxation time of water and oil, ms;
Tw,m(Sor), To,m(Swc)—peak relaxation time of water and oil in remaining oil and irreducible water state, ms;
Tw,m(Sw1), To,m(So1)—peak relaxation time of water and oil in saturated water and saturated oil state, ms;
Tbo,m, Tbw,m—peak bulk relaxation time of oil and water, ms;
To,g(So1)—geometric mean of T2 spectrum of oil in core saturated with oil, ms;
Tbo,g—geometric mean of T2 spectrum of simulated oil, ms;
Tbo,g(So1)—geometric mean of transverse bulk relaxation time of oil in core saturated with oil, ms;
To,g(R)—geometric mean of T2 spectrum of oil at different displacing water multiples, ms;
Tbo,g(R)—geometric mean of transverse bulk relaxation time of oil at different displacing water multiples, ms;
V—pore volume, µm3;
µo—oil viscosity, mPa·s;
ρ2—transverse surface relaxation rate of rock, µm/ms;
ρ2,w, ρ2,o—transverse surface relaxation rate of water and oil to rock, µm/ms.