

Introduction
Tight/shale oil has attracted much attention as a hot spot in the global unconventional oil and gas exploration and development [1⇓-3]. China possesses abundant resources of tight/shale oil, playing a crucial role in the strategic objectives of increasing reserves and production in major oil regions [4-5]. The tight/shale oil reservoirs in China are primarily characterized by continental deposition, fea-turing highly complex micro- and nano-scale pore-throat structures, along with the development of multiscale natural fractures [6]. Currently, reservoir stimulation techniques, particularly large-scale hydraulic fracturing in horizontal wells, have been employed extensively, creating numerous artificial fractures and effectively facilitating the initial production of tight oil/shale oil. However, conventional water flooding may easily suffer water channeling along fractures, leading to a low recovery of the remaining oil within the matrix. Advanced development processes are urgently needed [7-8]. Field development practices have demonstrated that the combination of capillary pressure-driven imbibition with pressure differential displacement contributes to enhanced recovery [9]. It is crucial to improving the development effect of tight/shale oil by effectively exerting the imbibition and displacement between matrix and fracture to increase the producing degree of matrix, with consideration to the matrix-fracture coupling.
It has been indicated that the imbibition in the process of water flooding is mainly dynamic imbibition, that is, the wetting-phase fluid flows into the outside of the matrix (fracture) under the action of external force. Due to the joint effects of capillary pressure, gravity, and displacement pressure, the imbibition process is more complex and also sensitive to diverse factors [10-11]. Previous studies on dynamic imbibition mainly focused on the mechanism and theoretical model [12-13], the applicable reservoir types and microscopic influence mechanism [14⇓-16], and the kinetic characteristics and influencing factors[17⇓-19]. These studies mostly used conventional displacement devices, which cannot effectively measure the volume of crude oil displaced by imbibition, and may yield greater errors especially when the experiments are performed on tight/shale oil cores. Some scholars made basic research on the imbibition recovery of tight/shale oil through microfluidic model experiments and numerical simulation[20⇓⇓⇓-24]. Overall, the available efforts mostly deal with the qualitative evaluation on the influence of reservoir fluid properties on dynamic imbibition efficiency and the optimization of injection-production parameters. However, an investigation on the mechanism and influencing factors of dynamic imbibition in oil displacement at the microscopic pore scale has rarely been reported. Particularly, there is a lack of quantitative and visual research on the mechanism and dynamic features of pore throat fluid production at different development stages under the matrix-fracture coupling in tight/shale oil reservoirs.
Based on the seepage theory, this paper presents an online physical simulation method with the combination of dynamic displacement and imbibition by integrating two large-scale experimental systems (high temperature and high pressure NMR and CT scanning). First, the HTHP NMR experiment was performed to quantify the imbibition and displacement, clarify the mechanism of production from microscopic pores by dynamic imbibition in tight/shale oil reservoirs, and identify how different factors affect the dynamic imbibition effect. Then, the dynamic seepage process with fracturing-soaking-flowback-production integration was simulated to reveal the dynamic production features at different stages and quantify their contributions to enhanced oil recovery (EOR).
1. Experimental design
1.1. Online NMR experiment for quantitative evaluation on dynamic imbibition-displacement
In the process of water flooding in tight/shale oil reservoirs, the crude oil in small pores and on wall surfaces of large pores is mainly discharged under the action of capillary pressure, while the crude oil in the middle of large pores and the fractures is displaced at designated displacement pressure. In this study, an online NMR physical simulation experiment was designed to quantitatively evaluate the imbibition-displacement process in water flooding. The experiment was performed on cores, and NMR test was conducted at key points in the experiment to obtain the NMR spectra under different conditions. The T2 value can characterize the production and distribution of fluid in pores at different scales [11,25]. In this study, the NMR spectrum was segmented into two regions by a T2 cut-off value. The left region represents imbibition recovery (small pores), and the right region represents displacement recovery (large pores). The production by each recovery process (imbibition or displacement) was calculated, and then the contributions of imbibition and displacement in the process of water flooding were quantified. A number of studies have proved that the pore throat distribution obtained by NMR test is highly correlated with the pore throat distribution measured by high-pressure mercury injection (HPMI) test [8,11]. In this study, the pore throat radius curve obtained by high-pressure mercury injection test and T2 spectrum were plotted in the same logarithmic coordinate system (Fig. 1 ). Thus, the conversion coefficient (C) in Eq. (1) is determined to be 0.02 μm/ms.
$r=C{{T}_{2}}$
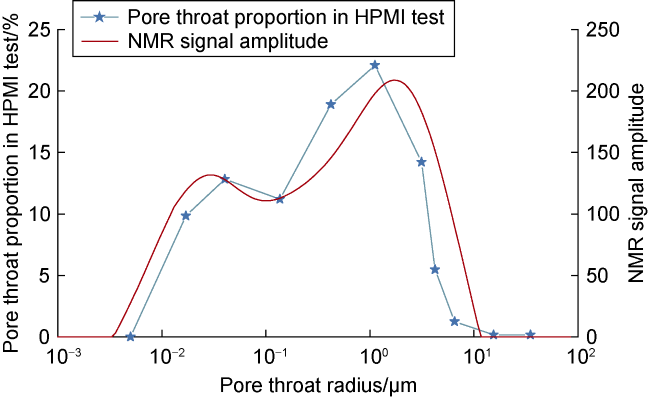
Fig. 1. Comparison of pore throat radius obtained by HPMI test and NMR test on cores. |
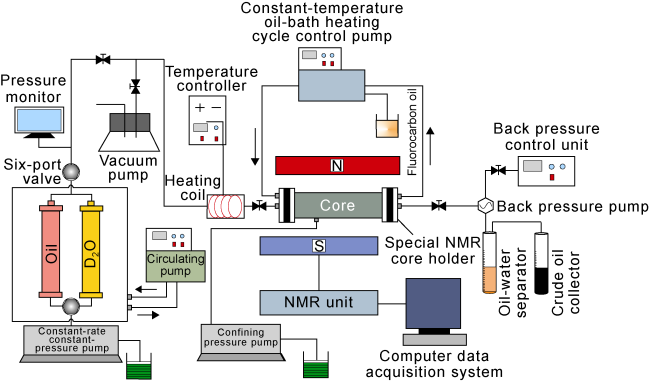
Fig. 2. Online NMR experimental system for dynamic imbibition during water flooding. |
According to the above method, five tight glutenite samples (Z1-Z5) of Baikouquan Formation in Mahu Sag and two shale samples (Y1, Y2) of Lucaogou Formation in Jimsar Sag of Junggar Basin were selected for online NMR experiment to analyze the influencing factors of dynamic imbibition during water flooding. The core physical parameters are shown in Table 1. To simulate the dynamic imbibition process under the matrix-fracture coupling, the samples Z1-Z5 and Y2 were fractured before the experiment, with creature length as 2/3 of the core length. The fractured cores were cleaned and then put into the heat-shrinkable casing for backup.
Table 1. Core parameters of online NMR experiment on dynamic imbibition during water flooding |
| Core | Diameter/ cm | Length/ cm | Porosity/ % | Permeability/ 10-3 μm2 | Injected medium | Influencing factor |
|---|---|---|---|---|---|---|
| Z1 | 2.501 | 6.782 | 11.7 | 0.217 | D2O | Displacement pressure |
| Z2 | 2.496 | 6.795 | 12.3 | 0.215 | D2O | |
| Z3 | 2.504 | 6.812 | 11.5 | 0.213 | D2O | |
| Z4 | 2.491 | 6.719 | 10.2 | 0.145 | D2O | Permeability |
| Z5 | 2.501 | 6.693 | 13.4 | 0.271 | D2O | |
| Y1 | 2.498 | 6.877 | 10.5 | 0.121 | D2O | Fracture |
| Y2 | 2.495 | 6.853 | 11.6 | 0.657 | D2O |
The experiment was implemented in the following steps:
(1) Prepare the simulated oil with a viscosity of 8.3 mPa·s under formation conditions. Wash the rock sample with oil and salt, and then dry and weigh it. Put the dried core into a non-magnetic holder, and measure the wet weight of the core after vacuuming, pressurizing and being saturated with heavy water (D2O).
(2) Increase the temperature of the experimental system to 75 °C, and displace the water-saturated core with the simulated oil until no water is produced at the core outlet, which means that the core is fully saturated with oil. Then, perform aging-treatment on the core, and measure its NMR spectrum in the oil-saturated state.
(3) Set the confining pressure as 3 MPa higher than the pressure at the inlet, and inject the heavy water into the sample by a high-pressure pump. Perform the NMR test at different displacement times (0.2, 0.5, 2.0, 10.0, 24.0, 48.0, 120.0, and 192.0 h). Meanwhile, record accurately the parameters such as injection volume, displaced fluid volume, and pressure by various sensors. Complete the experiment when the T2 spectrum line does not change, and complete the NMR spectrum test in the final state of water flooding. The difference between the NMR spectra in the oil-saturated state before the experiment and the final state after the experiment is the volume of produced oil. The left side of the T2 cutoff value represents the fluid produced from the small pores by imbibition, and the right side represents the fluid displaced from the macropores and fractures by water flooding. Then, quantitatively evaluate the contributions of different oil recovery mechanisms (displacement + imbibition).
(4) Replace the core and repeat steps (1) to (3) to analyze the influences of displacement pressure (3, 10 and 15 MPa), permeability (0.145×10⁻³, 0.215×10⁻³ and 0.271×10⁻³ μm2), core type (matrix-type and fracture-type) and other factors on different oil recovery mechanisms.
1.2. Experiment for evaluation on fracturing-soaking- flowback-production integrated dynamic development
Based on the above-mentioned online NMR experimental system, a representative tight glutenite sample of Baikouquan Formation in Mahu Sag (Z6) and a shale sample of Lucaogou Formation in Jimsar Sag (Y3) were selected for dynamic seepage physical simulation experiment to mimic the underground fluid seepage in tight/shale oil reservoirs, so as to determine the dynamic development characteristics in different stages. Moreover, one tight glutenite sample (Z7) and one shale sample (Y4), which are parallel parameters with similar porosity and permeability in the same well area, were selected for online CT scanning experiment on dynamic seepage to obtain the distribution of fluid saturation along the core in different stages. The change of oil saturation in different stages was calculated by Eq. (2) to quantify the contribution to oil recovery. Before the experiment, each core was fractured (with the fracture length as 2/3 of the core length) and then cleaned for later use. The core parameters are shown in Table 2.
${{S}_{\text{o}}}=\frac{C{{T}_{\text{dry}}}-C{{T}_{\text{x}}}}{C{{T}_{\text{wet}}}-C{{T}_{\text{dry}}}}\times \frac{C{{T}_{\text{water}}}-C{{T}_{\text{air}}}}{C{{T}_{\text{water}}}-C{{T}_{\text{oil}}}}\times \text{100%}\!\!\!\!\text{ }$
Table 2. Core parameters of fracturing-soaking-flowback- production integrated dynamic development experiment |
| Core | Diameter/ cm | Length/ cm | Porosity/ % | Permeability/ 10-3 μm2 | Core type |
|---|---|---|---|---|---|
| Z6 | 2.498 | 6.695 | 13.8 | 0.219 | Glutenite |
| Z7 | 2.501 | 6.783 | 12.9 | 0.213 | Glutenite |
| Y3 | 2.497 | 6.861 | 13.6 | 0.217 | Shale |
| Y4 | 2.503 | 6.792 | 13.4 | 0.215 | Shale |
In this study, the independently developed online CT scanning core displacement experimental system (Fig. 3 ) was employed to design the online CT scanning experiment on dynamic seepage in the fracturing-soaking- flowback-production integrated process. The LIGHTSPEED 8-slice spiral CT scanner (General Electric Company) was used for scanning, and the CT image processing software CCTAS was used for data processing. The QUZIE5200 pump was selected as the injection pump, and the confining pressure was accurately controlled by the ISCO pump.
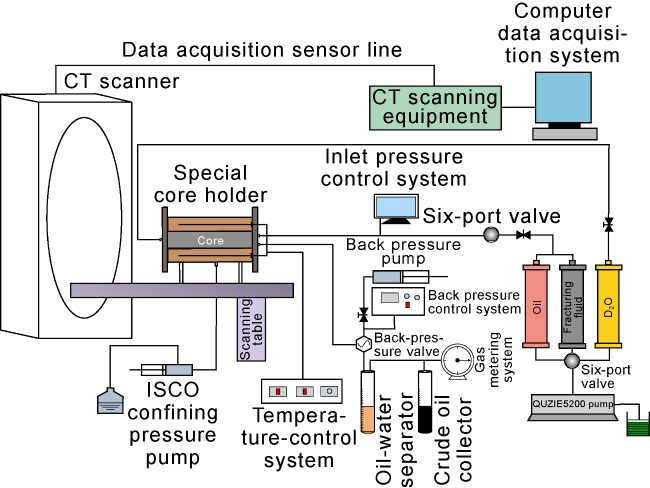
Fig. 3. Online CT scanning experimental system for dynamic seepage in the fracking-soaking-flowback-production integrated process. |
The experiment was implemented in the following steps:
(1) Wash the core with oil and salt, and then dry it. Place the dried core in a non-magnetic holder, and weigh its wet weight after vacuuming, pressurizing and being saturated with heavy water.
(2) Increase the temperature of the experimental system to 75 °C, and displace the core with the simulated oil until no water was produced at the outlet. Perform aging treatment on the core, and measure the T2 spectrum in the oil-saturated state.
(3) Inject the prepared hydrogen-free fracturing fluid into the rock sample from the inlet end of the holder by a high-pressure pump to simulate the fracturing process, and perform the NMR test at different fracturing times.
(4) Close the valve at the outlet end of the core holder, and close the valve at the inlet end of the core holder after the injection pressure was increased to a stable system pressure of 15 MPa. Perform the NMR test at the soaking time of 12 h and 24 h, and analyze the change of oil-water distribution in the microscopic pores during the soaking.
(5) Open the valve at the inlet end, and reduce gradually the injection pressure to 10, 5, 2, and 0 MPa. After each pressure point was stabilized, measure the T2 spectrum to analyze the oil-water production and change during the flowback process.
(6) After the pressure at the inlet and outlet ends of the core was stabilized, inject through the outlet end with heavy water at an injection pressure of 10 MPa to simulate the water flooding of distant water injection wells. Perform the NMR test at the time of 2, 12, 24, 48, 96, and 144 h, and stop the experiment when the NMR spectrum does not change.
(7) Replace the core, and repeat steps (1) to (6) to analyze the dynamic seepage characteristics of different rock samples.
(8) Select the samples Z7 and Y4, wash them with oil and salt, and then dry them. Put the dried samples into the CT holder, and perform online CT scanning experiments on the samples according to steps (1) to (6).
(9) Load the CT scan data into the CT image processing software to obtain the oil-water saturation images at different stages.
2. Characteristics and influencing factors of microscopic pore production by dynamic imbibition during water flooding
2.1. Characteristics of microscopic pore production by dynamic imbibition during water flooding
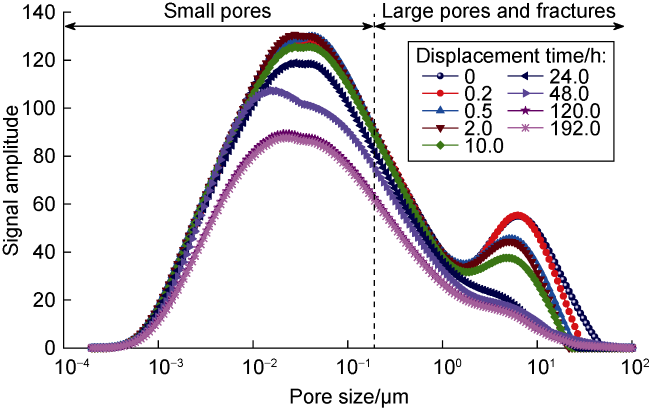
Fig. 4. NMR T2 spectrum of Z4 from experiment on dynamic imbibition during water flooding. |
According to the NMR T2 spectrum in Fig. 4 , the variation of oil recovery with displacement time for different pores can be determined (Fig. 5 ). It can be seen that the characteristics of oil production are different for pores. In general, the process of dynamic imbibition during water flooding can be divided into three stages. In Stage I (0-24 h), strong displacement and weak imbibition are present. Because the fracture has higher conductivity and lower seepage resistance, water first enters the fracture to expel the oil in the fracture by displacement. Secondly, due to the pressure difference between the fracture and the matrix, oil and water produce a cross-flow between the matrix and the fracture. Under the action of displacement (viscous force) and imbibition (capillary pressure), water can be imbibed into the large pores and some small pores around the fracture, so that the crude oil in the pores can be effectively discharged. In this stage, displacement and forward imbibition are the main recovery mechanisms (Fig. 6a ), and the recovery of large pores increases rapidly, which in turn drives the total recovery to increase rapidly. In Stage II (24-120 h), weak displacement and strong imbibition are dominant. The pressure drop is gradually transmitted to small pores, accompanied by the decrease of the pressure difference between pores, the decrease of the swept pore diameter, and the increase of the capillary pressure, which leads to the decrease of the displacement effect and the decrease in increase amplitude of the recovery from large pores and fractures. At the same time, the residual water phase in the large pores and fractures enters the small pores of the matrix through imbibition, so that the oil film on the pore wall is stripped and discharged. When the water film occupies the main space of the small pores, the crude oil in the middle of the small pores can be produced, and the discharged oil migrates to the outlet end through the large pores or fractures. This stage is dominated by the reverse imbibition recovery from small pores (Fig. 6b ), with the recovery mainly contributed by the continuous increased oil production from small pores. In Stage III (120-192 h), weak displacement and weak imbibition prevail. The capillary pressure and gravity of oil and water in the small pores of the matrix reach a dynamic balance, and the increment of recovery from small pores and large pores gradually slows down, and the recovery tends to be stable. It should be noted that the oil-water seepage between the core matrix and the fracture is a slow process, which takes a long time to achieve a real dynamic balance.
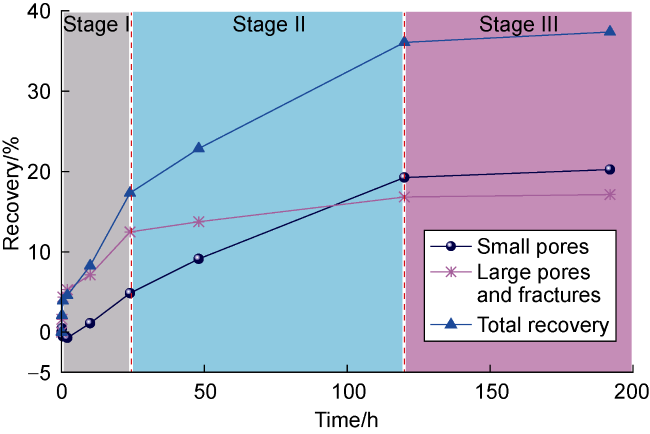
Fig. 5. Recovery vs. displacement time for Z4 under different stages. |
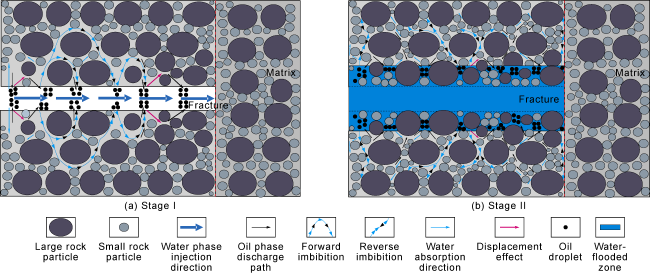
Fig. 6. Schematic fluid migration in different stages with dynamic imbibition during water flooding for Z4. |
2.2. Influencing factors of EOR by dynamic imbibition during water flooding
According to the NMR T2 spectrum before and after the online NMR experiment, combined with Eq. (3), the contribution and recovery under different recovery mechanisms (displacement + imbibition) were quantified. In this study, the influences of displacement pressure, permeability and fracture on the oil production from microscopic pores in the dynamic imbibition process and the contribution of each recovery mechanism to the recovery were analyzed. The relevant calculation results are shown in Table 3.
$R=\frac{{{S}_{1}}-{{S}_{2}}}{{{S}_{1}}}\times 100\%$
Table 3. Results of online NMR experiment under different influencing factors |
| Influencing factor | Core | Recovery/ % | Recovery under different recovery mechanisms/% | ||
|---|---|---|---|---|---|
| Imbibition | Displacement | Displacement | |||
| Displacement pressure | Z1 | 34.68 | 29.92 | 7.76 | 7.76 |
| Z2 | 40.47 | 10.57 | 29.90 | 29.90 | |
| Z3 | 36.35 | 6.82 | 29.53 | 29.53 | |
| Permeability | Z4 | 37.36 | 20.24 | 17.12 | 17.12 |
| Z5 | 45.20 | 24.91 | 20.29 | 20.29 | |
| Fracture | Y1 | 34.06 | 25.95 | 8.11 | 8.11 |
| Y2 | 38.18 | 8.42 | 29.76 | 29.76 | |
2.2.1. Displacement pressure
Displacement pressure is a key factor in the dynamic imbibition process. Foreign studies have shown that the displacement is considered unstable when the displacement pressure is greater than the critical value, leading to a low recovery, and it is stable when the displacement pressure is less than the critical value, corresponding to a high recovery [26]. Z1, Z2, and Z3 samples in Table 1 were selected for dynamic imbibition experiments at different displacement pressures. As shown in Fig. 7 , the T2 spectrum peak decreases with the displacement time, indicating that the crude oil in the core can be effectively produced under a certain pressure difference. The permeability levels of Z1, Z2, and Z3 samples are basically the same. The recovery of Z1 at 3 MPa, Z2 at 10 MPa, and Z3 at 15 MPa is 34.68%, 40.47%, and 36.35%, respectively (Table 3 ). With the increase of the displacement pressure, the recovery increases and then decreases, indicating that a higher displacement pressure is not certainly better in the dynamic imbibition experiment, and there is an optimal value range. It can be seen from Fig. 8 that the imbibition recovery decreases from 29.92% to 6.82% with the increase of the displacement pressure, while the displacement recovery increases and then decreases slowly with the increase of the displacement pressure. When the displacement pressure is small, the viscous force is small, the core imbibition process is close to a spontaneous imbibition, and the water can slowly spread to the small pores in the matrix. The imbibition process occurs in the area with balanced capillary pressure and viscous force. In this period, the main oil drainage mechanism is the imbibition at capillary pressure in small pores. However, the low pressure makes the viscous force difficult to overcome the capillary pressure of most small pore throats, leading to an invalid displacement. Moreover, the volume of water injected in the same time period is limited, which cannot guarantee the high efficiency of imbibition, resulting in a lower total recovery. When the displacement pressure rises to 10 MPa, the viscous force increases with the rising displacement pressure. Under the action of imbibition at capillary pressure and displacement at viscous force, the crude oil imbibed into large pores or fractures can be quickly displaced by the viscous force, thus resulting in a high total recovery. When the displacement pressure further rises to 15 MPa, the viscous force becomes dominant in oil drainage. However, the water in the fracture is discharged before it undergoes imbibition and exchange with the crude oil in the matrix. The matrix imbibition is limited and the imbibition effect is poor. Meanwhile, the displacement pressure is high and the viscous force is large. When the viscous force is greater than the capillary pressure, a fingering phenomenon occurs, the breakthrough time reduces sharply, and the oil-water front becomes unstable, which may cause serious water channeling, resulting in a low recovery at high injection pressure.
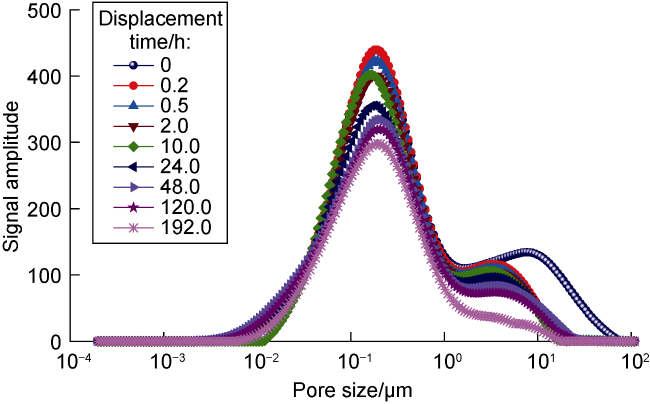
Fig. 7. NMR T2 spectrum of Z2 at displacement pressure of 10 MPa. |
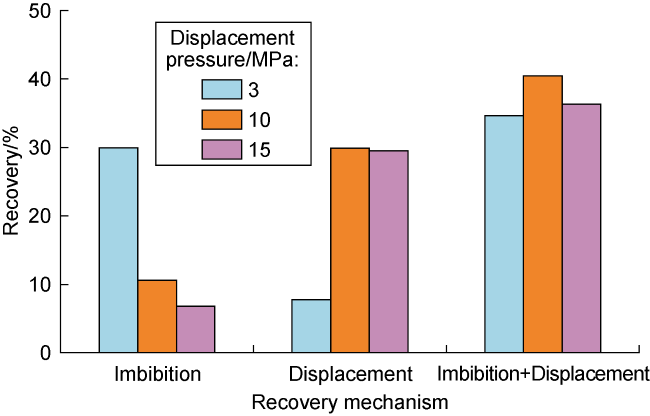
Fig. 8. Recovery under different displacement pressures and recovery mechanisms. |
Therefore, the displacement pressure in field water flooding should be selected with two considerations. First, the displacement pressure should be higher than the lower limit of displacement pressure in efficient and stable displacement, that is, the viscous force is ensured to effectively overcome the capillary pressure of most small pore throats, allowing it to enter the small pores to replace the crude oil therein, so that the oil production rate is maintained and the recovery from matrix is improved effectively. Second, the displacement pressure should be lower than the upper limit of displacement pressure in efficient and stable displacement, so that the displacement effect can be maximized, the oil-water sweep area and imbibition efficiency be improved, and the recovery from fractures and large pores be enhanced, while water channeling be avoided. Furthermore, the field injection pressure should be determined properly depending on reservoir physical properties, fracture development, and fluid properties.
2.2.2. Permeability
The permeability of tight/shale oil reservoirs is low, and the permeability has a great impact on dynamic imbibition. Fig. 9 compares the NMR T2 spectra of Z5 (permeability 0.271×10⁻³ μm2) and Z4 (permeability 0.145×10⁻³ μm2). It can be seen that the signal amplitude of crude oil in small pores, large pores and fractures of Z5 decreases more than that of Z4. As shown in Table 3 , the imbibition recovery and displacement recovery of Z5 are 24.91% and 20.29% respectively, 4.67 and 3.17 percentage points more than that of Z4. The ultimate recovery of Z4 and Z5 is 45.20% and 37.36%, respectively, indicating that the displacement recovery and imbibition recovery increase with the increase of permeability. This is believed to be controlled by the microscopic mechanical mechanism and physical properties of the reservoir.
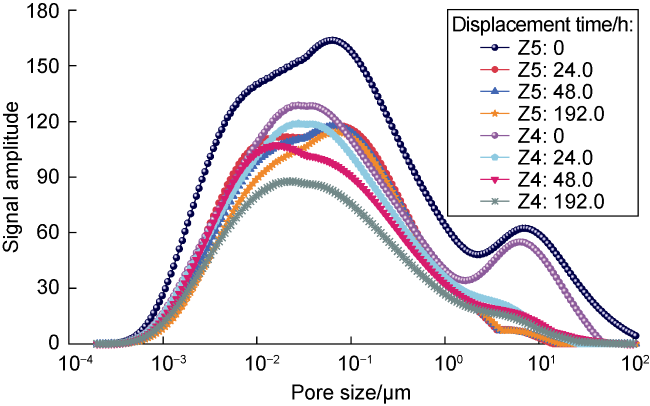
Fig. 9. Comparison of NMR T2 spectra of Z4 and Z5. |
The dynamic imbibition during water flooding mainly includes two processes:
(1) The injected water is imbibed into the core. This process is determined by the capillary pressure of the reservoir. At the same wettability level, the lower the permeability, the smaller the capillary radius is. In this case, a higher capillary pressure can bring a larger imbibition distance.
(2) The crude oil is displaced and discharged. This process is mainly controlled by the single-phase oil start- up pressure induced by the viscous resistance on the pore wall and the relative seepage resistance between the oil and water phases. These resistances are mainly related to permeability. The higher the permeability, the larger the pore throat radius and the better the pore throat connectivity, which can effectively reduce the probability of sticking and breaking during oil droplet displacement, and the smaller the resistance to injected water entering small pores and the resistance to oil discharge, so that the crude oil in pore throats of various scales can be produced to a higher degree. In addition, Fig. 10 shows that the lower the core permeability, the longer the imbibition equilibrium time required, the lower the recovery, and that the higher the permeability, the higher the imbibition efficiency and the recovery.
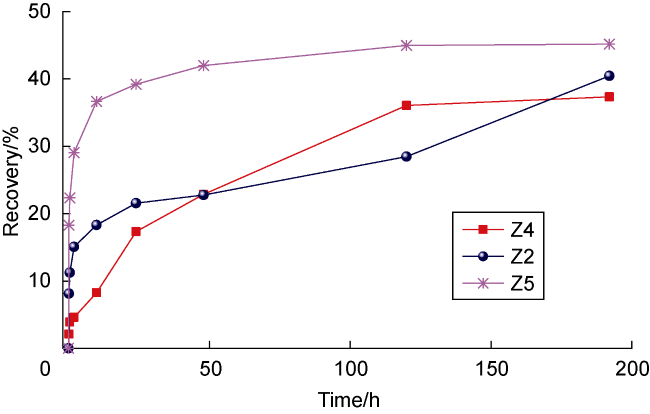
Fig. 10. Recovery variation of Z2, Z4 and Z5 with displacement time. |
It is known that the Bond number, as it is defined (the ratio of gravity to capillary pressure), increases with the increase of permeability. The larger the Bond number is, the stronger the gravity effect is, and the greater the imbibition oil production power is. However, when the permeability increases to a certain level, the change of the seepage resistance is smaller, and the increase of the imbibition power is also smaller, resulting in the slow increase of recovery under high permeability [14]. Fig. 10 also shows that the recovery increase of cores with different permeabilities during dynamic imbibition is steep and then slows down, that is, the recovery rate declines gradually in the late stage of imbibition. Accordingly, the dynamic imbibition process of cores with different permeabilities can be divided into high-speed imbibition and low-speed imbibition stages. For high-permeability cores, oil is mainly discharged in the high-speed imbibition stage, while the oil yield in the low-speed imbibition stage is very small and appears earlier. The analysis shows that the seepage resistance of high-permeability samples is small: in the early stage of imbibition, the capillary pressure is high to provide a large imbibition power, leading to a high recovery; in the late stage of imbibition, the capillary pressure declines rapidly with the increase of the matrix water saturation, resulting in an early onset of the low-speed imbibition stage. In contrast, low-permeability cores require a longer imbibition time to obtain higher recovery. Therefore, the permeability-increasing treatments such as fracturing are adopted practically to greatly improve the seepage capacity of the reservoirs, and water flooding is believed to enhance the development performance significantly.
2.2.3. Fracture
Tight/shale oil reservoirs are mostly developed by horizontal well staged fracturing to create complex fractures, which have a great influence on dynamic imbibition. Fig. 11 shows the NMR T2 spectra of two cores (Y1, a tight matrix-type core with a permeability of 0.121×10⁻³ μm2, and Y2, a fracture-type core with a permeability of 0.657×10⁻³ μm2, as shown in Table 1 ). It can be seen that the T2 spectrum of the matrix-type core is mainly monomodal, reflecting the prevalence of nano-scale small pores, with some large pores, and the T2 spectrum of the fracture-type core is trimodal, with the T2 spectral peak appearing at the pore size greater than 13 μm, in addition to the spectral peaks of small pores and large pores, and also the signal amplitude decreasing with the dynamic imbibition time. Thus, the pores with sizes greater than 13 μm are defined as fractures. For the fracture-type core, at the displacement time of 0.2 h, the T2 spectrum line at the fracture falls significantly, and the T2 spectrum line at the small pores of the matrix moves down slightly. With the displacement time, the T2 spectrum lines at the matrix and the large pores lower gradually and shift to the right, indicating that the crude oil in the matrix gradually migrates to the fracture under the action of water, and the matrix supplies oil to the fracture. In Table 3 , the imbibition recovery and displacement recovery are 8.42% and 29.76%, respectively, for the fracture-type core, and 25.95% and 8.11%, respectively, for the matrix-type core. The ultimate total recoveries of the two cores are 38.18% and 34.06%, respectively, indicating that the core after fracturing enables water to more easily enter the micro- to nano-scale small pores of the matrix to replace the crude oil therein, thus leading to a high total recovery.
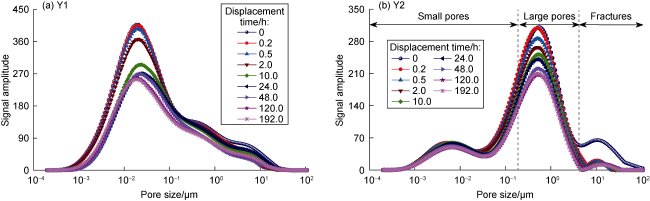
Fig. 11. NMR T2 spectra of matrix-type and fracture-type cores. |
In essence, the internal seepage capacity of the core after fracturing is better. In the early stage of water injection, the crude oil in the fractures and the large pores around the fractures can be produced by displacement. In the late stage, the fractures can not only increase the imbibition contact area between the matrix and water, but also reduce the oil-water seepage resistance and promote the oil-water exchange between the matrix fractures. These features finally contribute the high total recovery. In field practices, the reservoir stimulation treatments such as large-scale volume fracturing and the mechanism of oil drainage by dynamic imbibition between matrix fractures can be combined to effectively improve the recovery.
3. Dynamic features of fracturing-soaking-flowback-production integrated development
3.1. Performance at different stages
Clarifying the behaviors between matrix and fractures at different stages is important for practical reservoir development. In this study, the results of online NMR experiments of cores Z6 (glutenite) and Y3 (shale) in Table 2 are taken as examples to analyze the dynamic features of microscopic pores in the reservoirs under the matrix-fracture coupling during the lifecycle of fracturing-soaking-flowback-production integrated development and the contribution to recovery at different stages
3.1.1. Fracturing stage
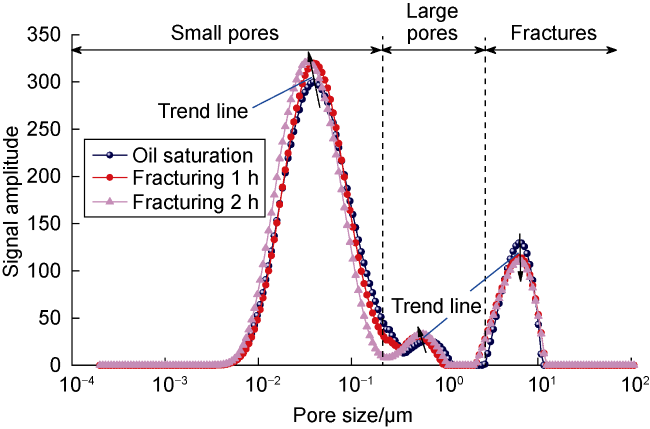
Fig. 12. NMR T2 spectrum and migration trend of crude oil in pores in fracturing stage. |
3.1.2. Soaking stage
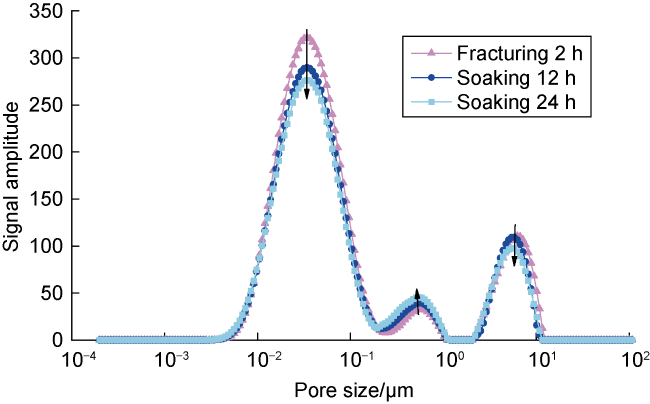
Fig. 13. NMR T2 spectrum and migration trend of crude oil in pores during soaking stage. |
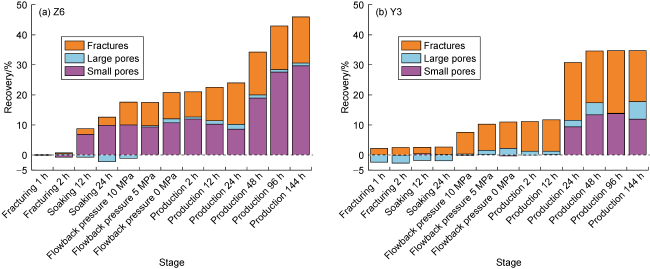
Fig. 14. Oil recovery in pores at different stages. |
3.1.3. Flowback stage
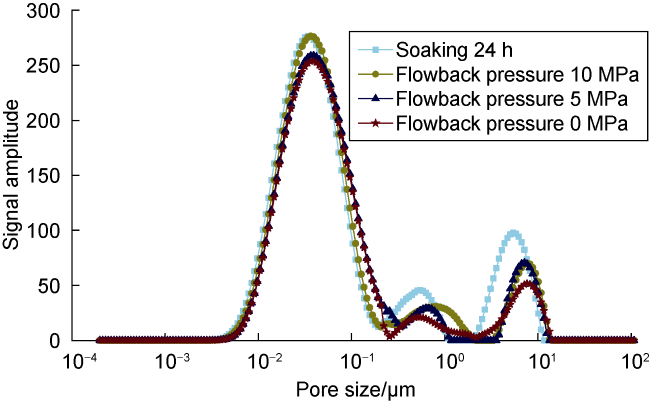
Fig. 15. NMR T2 spectrum and migration trend of crude oil in pores in flowback stage. |
3.1.4. Production stage
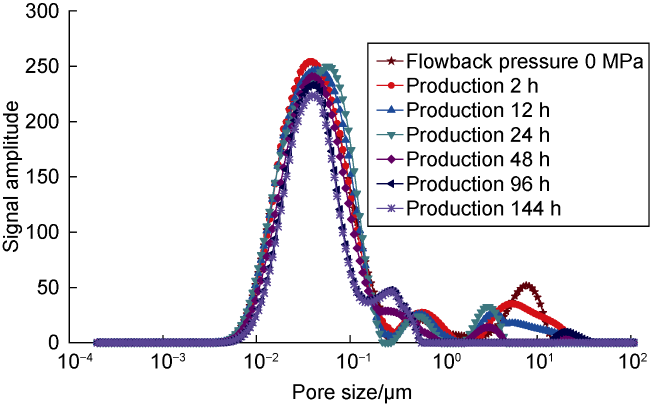
Fig. 16. NMR T2 spectrum and migration trend of crude oil in pores in production stage. |
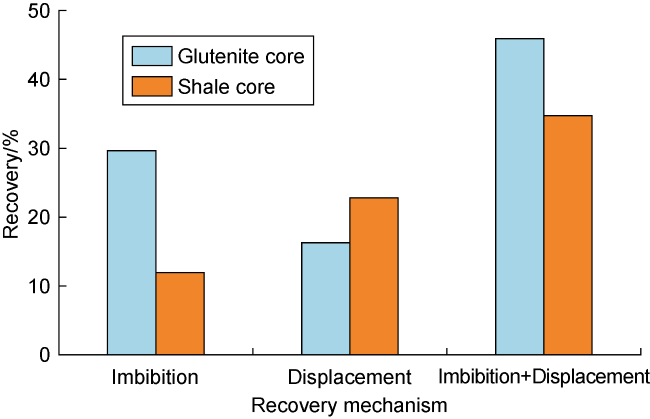
Fig. 17. Recovery under different recovery mechanisms. |
3.2. Recovery contribution at different stages
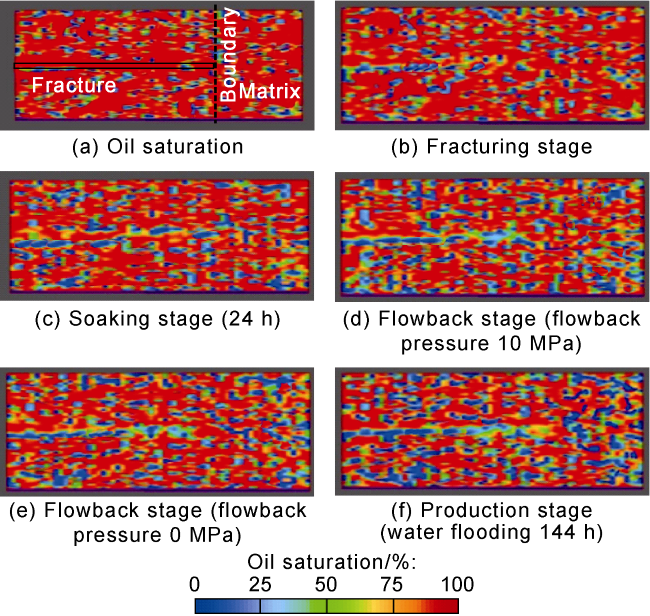
Fig. 18. CT scan images of oil saturation field of Z7 at different stages. |
4. Conclusions
The seepage of tight/shale reservoirs can be divided into three stages: strong displacement and weak imbibition as oil produced rapidly by displacement from large pores and fractures; weak displacement and strong imbibition as oil produced slowly by reverse imbibition from small pores; and weak displacement and weak imbibition at dynamic equilibrium.
The greater the displacement pressure, the higher the displacement recovery, and the lower the imbibition recovery. However, if the displacement pressure is too high, the injected water is easy to break through the front, which will reduce the recovery. The higher the permeability, the higher the imbibition and displacement recoveries, the shorter the duration of imbibition balance, and the higher the ultimate recovery is. Fractures can effectively increase the imbibition contact area between matrix and water, reduce the oil-water seepage resistance, promote the oil-water displacement between matrix and fracture, and improve the oil displacement rate and recovery of the matrix.
Soaking after fracturing is beneficial to the imbibition replacement and energy enhancement/storage of the fluid. Also, the effective use of the carrying of the flowback fluid and the displacement in the production stage is crucial to enhancing oil recovery.
Nomenclature
C—conversion coefficient, μm/ms;
CTair—CT value of air;
CTdry—CT value of the fault plane in a dry core;
CToil—CT value of oil;
CTwater—CT value of water;
CTwet—CT value of the fault plane in a wet core;
CTx—CT value of core fault plane at a time point during displacement;
r—pore throat radius, μm;
R—recovery, %;
S1—T2 spectrum area in oil-saturation state, m2;
S2—T2 spectral area at the end of imbibition, m2;
So—oil saturation, %;
T2—transverse relaxation time, ms.