

Introduction
China possesses a vast potential in high-H2S natural gas resources, with the total geological reserves exceeding 1×10¹² m3, primarily distributed in gas fields such as Puguang, Yuanba and Luojiazhai in the Sichuan Basin [1⇓⇓-4]. Compared to the conventional natural gas, sulfur deposition is a key factor restricting the efficient development of high-H2S natural gas. During the development of high- H2S gas fields, as the pressure decreases, the elemental sulfur dissolved in natural gas exhibits a reduced solubility and precipitates in solid or liquid form (when the reservoir temperature exceeds 119.7 °C, elemental sulfur precipitates in liquid form), then deposits in the reservoir. This phenomenon leads to the blockage of gas flow channels and increase in flow resistance, which finally impacts the recovery factor of gas field [5⇓-7]. The Puguang gas field, the largest marine uncompartmentalized high-H2S gas field of China, is characterized by strong reservoir heterogeneity, with reservoir depth ranging from 4 800 m to 6 000 m, an average formation temperature of 128 °C, and an average mass fraction of H2S of 15%. As the reservoir pressure declines with the exploitation, the elemental sulfur dissolved in high-H2S gas precipitates in liquid form, leading to sulfur plugging in some wellbores. Previous studies have found that the sulfur saturation in the near-wellbore area is relatively high, making it difficult for liquid sulfur to flow after precipitation [2]. Liquid sulfur may be adsorbed and deposited to affect the flow channels in reservoirs, but the mechanism of damage caused by liquid sulfur to the reservoir remains unclear. The reservoir types of high-H2S gas fields in the Sichuan Basin are diverse, and the flow mechanisms of multiphase fluid (gas-water-sulfur) within reservoirs are complex. The applicability of the same development model is poor, necessitating a clear understanding of the characteristics and mechanisms of changes in reservoir properties under the influence of sulfur deposition and adsorption in different types of reservoirs.
Liquid sulfur deposition and its damage to reservoirs are usually investigated by theoretical modeling and laboratory experiments. In respect of theoretical modeling, scholars have established sulfur solubility models [7⇓⇓⇓⇓⇓-13] and sulfur migration and deposition models [14-15] based on thermodynamic and kinetic theories, to elucidate the effects of temperature, pressure, fluid composition and bound water saturation on the dissolution, precipitation and deposition of elemental sulfur. Laboratory experiments can offer more intuitive and realistic insights into the impact of sulfur deposition on reservoirs, which are indispensable parameters for theoretical models. However, due to the harsh conditions of in-situ high temperature and pressure and the extreme toxicity of H2S, experimental conditions are stringent and dangerous. Consequently, research on liquid sulfur deposition damage is relatively limited, primarily focusing on gas-liquid sulfur relative permeability curves and wettability. Zhang et al. [16⇓-18] determined the gas-liquid sulfur relative permeability curves, revealing a high critical flow saturation of liquid sulfur, a narrow region of gas-liquid sulfur co-permeation, and limited flow capability of liquid sulfur. From the perspective of rock wettability by liquid sulfur, Mahmoud [19] found that at 150 °C, with increasing adsorption and deposition of liquid sulfur, the contact angle of rocks shifted towards a more gas-wet state, thereby reducing the gas production efficiency. Furthermore, systematic studies on the deposition and adsorption behaviors of liquid sulfur are rarely reported. Visual and quantitative researches on the effects of liquid sulfur on reservoir pore structure and physical properties are urgently needed.
To determine the impact of liquid sulfur deposition and adsorption on reservoirs, this study is based on high-temperature and high-pressure (HTHP) core displacement experiments with liquid sulfur. Cores taken from different types of reservoirs in three steady states (original, after sulfur injection, and after gas flooding) were finely quantitatively characterized to reveal the differences and reservoir damages of liquid sulfur deposition and adsorption. The techniques of nuclear magnetic resonance (NMR) T2 spectrum and imaging and X-ray computer tomography (CT) of full-diameter cores were combined to investigate how liquid sulfur deposition affects the pore size distribution, pore connectivity and heterogeneity. Basic physical property tests were conducted to quantify the damage of liquid sulfur deposition on reservoir porosity and permeability. Furthermore, field emission scanning electron microscopy (FESEM) imaging and energy spectrum analysis were integrated to determine the micromorphlogy and reservoir damage mechanism of liquid sulfur deposition and adsorption, aiming to provide a theoretical basis for maintaining high and stable production of high-H2S gas reservoirs.
1. Samples and methods
1.1. Samples
The experimental cores were taken from the Triassic Feixianguan Formation of the Puguang gas field. The reservoirs are dominated by dolomite, with porosity of 0.26%-28.86% (averaging 8.65%) and permeability of (0.01-3 554.10)×10−3 μm2 (averaging 26.3×10⁻³ μm2). The Feixianguan Formation reservoirs exhibit strong heterogeneity. Therefore, representative cores of different reservoir types were selected. Based on a large number of core cast thin sections and physical property data from wells PG1, PG2, PG5, PG6, PG9, PG102-1, PG104-1, PG302-1 and PG304-1, the reservoirs were classified into Type I, Type II and Type III (Fig. 1 ), with intergranular pores, intergranular-intragranular pores, and intragranular pores as the main reservoir spaces respectively. The three representative dolomite cores selected in this study correspond to Type I, Type II, and Type III reservoirs, with basic core parameters shown in Table 1.
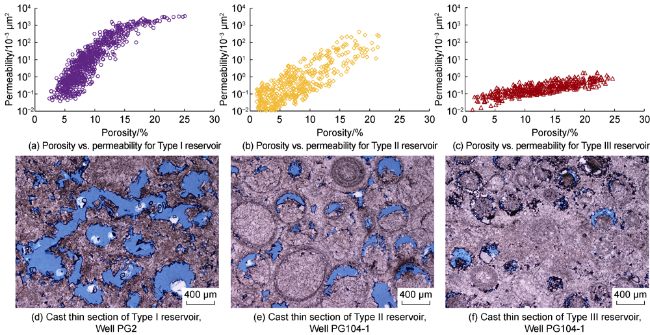
Fig. 1. Reservoir characteristics of Feixianguan Formation reservoirs in Puguang gas field. |
Table 1. Basic parameters of core samples |
| Sample No. | Well | Diameter/mm | Length/mm | Sampling depth/m | Porosity/% | Permeability/10-3 μm2 | Reservoir type |
|---|---|---|---|---|---|---|---|
| 1 | PG-2 | 25.27 | 60.60 | 5 089.47-5 089.58 | 22.63 | 2 155.28 | Type I |
| 2 | PG104-1 | 25.29 | 59.70 | 5 792.05-5 792.15 | 16.10 | 15.51 | Type II |
| 3 | PG104-1 | 25.30 | 59.99 | 5 705.26-5 705.35 | 12.54 | 0.57 | Type III |
The experimental gas sample was prepared according to the actual gas composition of the Puguang gas field, including CH4 (75%), H2S (15%) and CO2 (10%). The experimental water was simulated formation water of the Puguang gas field, containing CaCl2. The sulfur sample used in the experiment was high-purity sulfur powder with a purity of 99.999 86%.
1.2. Methods
Based on HTHP liquid sulfur core displacement experiments, the basic reservoir properties in different states (original, after sulfur injection, and after gas flooding) during liquid sulfur deposition and adsorption were determined. Combining NMR T2 spectrum and imaging, X-ray CT of full-diameter core and FESEM imaging, the reservoir pore structure and physical properties were visualized and quantitatively characterized. The experimental steps are as follows: (1) Determine the porosity and permeability of the original core, and perform micro-CT scanning of the core; then, saturate the core with simulated formation water after vacuumizing, and conduct NMR T2 spectrum measurement and imaging. (2) Inject liquid sulfur, using the experimental setup in Fig. 2 at the temperature of 140 °C, the back pressure of 18 MPa and the confining pressure of 20 MPa, into the water-saturated core at a rate of 0.1 mL/min to establish core bound water, until the injected liquid sulfur volume reaches 5 PV (pore volume) and the core mass no longer changes, and repeat Step (1) for core characterization. (3) Inject the gas sample, under the same conditions in Step (2), into the core at a rate of 0.1 mL/min until no liquid sulfur appears at the outlet, and repeat Step (1) for core characterization. (4) Conduct FESEM imaging and energy spectrum analysis on the cores after the experiment. The measured NMR relaxation signal corresponds to the hydrogen atom signal in the simulated formation water saturated in the core in different states, and 128 scans were performed. The full-diameter core X-ray CT was conducted using the Geoscan 200 scanner, with a resolution of 56 μm. After the CT data volume was obtained, image denoising was performed using the median filtering method, followed by threshold segmentation to extract pore structures. Subsequently, quantitative calculation, connectivity analysis, and pore network model establishment were completed to achieve three-dimensional visualization and quantitative analysis of the reservoir rock samples.
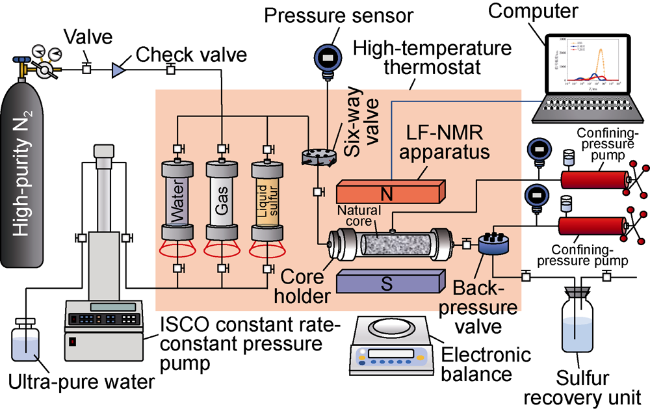
Fig. 2. Schematic diagram of setup in HTHP liquid sulfur core displacement experiment. |
1.3. Multifractal theory based on NMR T2 spectrum
To clarify the influence of liquid sulfur deposition and adsorption on pore structure heterogeneity, the multifractal calculation was conducted using the box-counting dimension method based on the NMR T2 spectrum. The range of the cumulative normalized T2 spectrum distribution is considered as a data set of length L. L is covered by a series of boxes with the same length (ε), where N(ε) is the number of boxes required to fully cover L. The probability mass function of the ith box can be defined as:
${{P}_{i}}\left( \varepsilon \right)=\frac{{{N}_{i}}\left( \varepsilon \right)}{{{N}_{\text{t}}}}$
The above probability mass function is used to quantitatively characterize the distribution characteristics of NMR signal amplitudes in each box, which is related to the box length as follows [20]:
${{P}_{i}}\left( \varepsilon \right)\sim {{\varepsilon }^{{{\alpha }_{i}}}}$
where αi is the Lipschitz-Hölder singularity index, which reflects the local singularity intensity of Pi(ε).
When the Lipschitz-Hölder singularity index is identical for all boxes, the number of boxes is denoted as Nα(ε), which can also be represented as:
${{N}_{\alpha }}\left( \varepsilon \right)\propto {{\varepsilon }^{-f\left( \alpha \right)}}$
f(α) is the dimension of the fractal subset labeled by α. The curve composed of α and f(α) is called a multifractal singularity spectrum, which can be used to characterize the heterogeneous distribution characteristics of signal amplitudes on fractal structures.
The values of α(q) and f(α) can be obtained by Eqs. (4) and (5) [21]:
$\alpha \left( q \right)\propto \frac{\left[ \sum\limits_{i=1}^{N\left( \varepsilon \right)}{{{U}_{i}}\left( q\text{,}\varepsilon \right)\ln {{P}_{i}}\left( \varepsilon \right)} \right]}{\ln \varepsilon }$
$f\left( \alpha \right)\propto \frac{\left[ \sum\limits_{i=1}^{N\left( \varepsilon \right)}{{{U}_{i}}\left( q\text{,}\varepsilon \right)\ln {{U}_{i}}\left( q\text{,}\varepsilon \right)} \right]}{\ln \varepsilon }$
where
${{U}_{i}}\left( q\text{,}\varepsilon \right)=\frac{{{P}_{i\text{,}q}}\left( \varepsilon \right)}{\sum\limits_{i=1}^{N\left( \varepsilon \right)}{{{P}_{i\text{,}q}}\left( \varepsilon \right)}}$
q, the order of statistical moment, which is taken as integers within [−10, 10] in this work. When q>0, it represents high-density area of pore distribution.
In addition, u(q, ε) represents the partition function, used to demonstrate the accuracy of multifractal calculations, and the partition function for q can be expressed as:
$u\left( q\text{,}\varepsilon \right)=\sum\limits_{i=1}^{N\left( \varepsilon \right)}{{{P}_{i\text{,}q}}\left( \varepsilon \right)}\propto {{\varepsilon }^{\tau \left( q \right)}}$
τ(q) is the mass scaling function of order q, which can be calculated by Eq. (8) [22]:
$\tau \left( q \right)=-\underset{\varepsilon \to 0}{\mathop{\lim }}\,\frac{\sum\limits_{i=1}^{N\left( \varepsilon \right)}{{{P}_{i\text{,}q}}\left( \varepsilon \right)}}{\ln \varepsilon }$
The relationship between the generalized fractal dimension (Dq) and q can be expressed as:
${{D}_{q}}=\frac{\tau \left( q \right)}{q-1}$
In multifractal analysis, Dq and q have a nonlinear relationship, forming a generalized fractal dimension spectrum. The most commonly used generalized fractal dimensions are capacity dimension (D0), information dimension (D1) and correlation dimension (D2) [22]. D0 reflects global characteristics; D1 evaluates the disorder of pore distribution, where a larger D1 value indicates smaller fluctuations in local pore structure distribution and more uniform distribution of pore structures in each pore size interval; D2 can characterize the spatial autocorrelation degree of measure.
In addition, to maintain the continuity of the Dq function, when q=1, the calculation is carried out using L'Hôpital rule [23]:
${{D}_{1}}=\underset{\varepsilon \to 0}{\mathop{\lim }}\,\frac{\sum\limits_{i=1}^{N\left( \varepsilon \right)}{{{P}_{i}}\left( \varepsilon \right)\ln {{P}_{i}}\left( \varepsilon \right)}}{\ln \varepsilon }$
The Hurst index can reflect positive autocorrelation or spatial long-distance changes, and it is calculated as follows:
$H=\frac{{{D}_{2}}\text{+}1}{2}$
2. Pore size distribution and pore connectivity
2.1. Pore size distribution
The NMR T2 spectrum can reflect information about the core’s pore structure, where the transverse relaxation time is proportional to the pore radius [24⇓-26]. The T2 spectra of the three core samples in their original state all exhibit three peaks, with the third peak being dominant (Fig. 3 ), indicating that the pore types are mainly large pores, with medium and small pores, and overall heterogeneity is strong. The transverse relaxation time of the third peak for Sample 1, Sample 2, and Sample 3 is 810, 380 and 320 ms, respectively, with signal amplitude decreasing successively. This reflects that the main pore radii of the three samples decrease successively, corresponding to the pore structure characteristics of three types of reservoirs (Fig. 1 ).
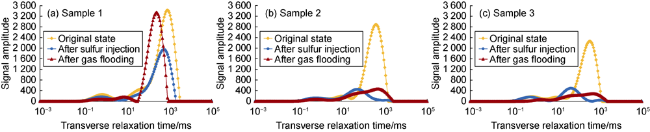
Fig. 3. NMR T2 spectra of core samples before and after displacement. |
For Sample 1 with the best pore structure (Fig. 3a ), after sulfur injection, it exhibits an overall bimodal feature, with the third peak shifting downwards to the left, the second peak basically disappearing, and the first peak shifting downwards, resulting in a decrease in the spectrum area, indicating a reduction in overall pore radius and pore volume. After gas flooding, it still shows a bimodal feature, with the first peak disappearing, the second peak shifting to the left, and the transverse relaxation time of the third peak decreasing from around 810 ms to about 260 ms. However, compared with the original state, the spectrum area slightly decreases after sulfur injection-gas flooding, indicating a slight decrease in pore volume. This is because, on one hand, liquid sulfur deposition mainly blocks some small pore throats, and on the other hand, a small amount of adsorption deposits on the walls of large pores, leading to an increase in the number of medium pores and a slight decrease in overall pore volume. Comparing the characteristics of T2 spectrum changes before and after gas flooding, it is found that the spectrum area increases, and the signal of the third peak enhances, indicating that liquid sulfur in large pores is more easily carried away by gas, hence the overall pore volume increases compared to that after sulfur injection.
For samples 2 and 3 with relatively poor pore structures (Fig. 3b , 3c ), after sulfur injection, they exhibit an overall bimodal feature, with the third peak shifting significantly downwards to the left. The spectrum area decreases by 70% to 75%, indicating a significant reduction in pore radius and pore volume. Compared to Sample 1, the changes are more pronounced, indicating that liquid sulfur deposition has a greater impact on the pore structure of samples with poorer physical characteristics. After gas flooding, they still maintain a bimodal feature, with the first peak shifting downwards to the right and the third peak shifting downwards, indicating that after gas flooding, liquid sulfur deposition directly blocks small pore throats and deposits or adsorbs in some large and medium pores, resulting in a decrease in the number of large and medium pores and a more significant deterioration in overall pore structure. The decrease in the third peak significantly affects the spectrum area, indicating that sulfur deposition and adsorption in large pores is the main reason for the decrease in pore volume. The spectrum areas of samples 2 and 3 after gas flooding are 30% and 25% of that in original state, respectively. For Sample 3 with the poorest physical properties, the effect of liquid sulfur deposition and adsorption on overall pore size distribution and pore volume is more significant. Additionally, there is little change in the spectrum area before and after gas flooding, while the third peak shifts to the right, indicating that gas flooding has little effect on the overall pore volume and pore size distribution of the core. It only carries liquid sulfur away from large pores without significant impact on small pores, indicating that liquid sulfur is more likely to deposit and adsorb in small pores.
Based on the CT data volume, the pore structure was quantitatively analyzed, and the pore size distribution of three core samples were delineated (Fig. 4 ). It is important to note that the resolution of the micro-CT scanning experiment for full-diameter cores was 56 μm, which cannot identify the pores smaller than this scale, thus the analysis mainly focused on the distribution and variations of medium and large pores. After sulfur injection-gas flooding, for Sample 1, the number of pores with diameters above 2 000 μm decreased, while the number of pores with diameters below 400 μm increased. The pores contributing the most to the pore volume were still concentrated in the range of 1 000-1 400 μm. The number of such pores did not change significantly, indicating that although there was a reduction in large pores and an increase in medium pores due to sulfur deposition and adsorption, the impact on the overall pore structure and primary fluid channels was minimal. For Sample 2, after sulfur injection-gas flooding, the number of pores with diameters above 1 500 μm significantly decreased or disappeared, while the number of pores with diameters below 400 μm increased. The loss of pore volume mainly came from pores with diameters above 1 500 μm. The pores contributing the most to the pore volume also decreased from 800-1 000 μm to 400-600 μm, indicating that liquid sulfur deposition had a greater impact on the pore structure of Sample 2, resulting in a reduction in overall pore diameter and pore volume. Similarly, for Sample 3, after sulfur injection-gas flooding, the number of pores with diameters above 1 000 μm sharply decreased or disappeared, while the number of pores with diameters below 600 μm significantly increased. The pores contributing the most to the pore volume decreased from 800-1 000 μm to 400-600 μm. The loss of pore volume mainly came from pores with diameters above 1 000 μm. The overall reduction in pore diameter and pore volume due to liquid sulfur adsorption and deposition was more pronounced in Sample 3. Therefore, for samples 2 and 3 with poorer physical properties, the loss of pore volume mainly came from medium to large pores. A comprehensive analysis of the NMR T2 spectra and pore size distribution results from CT scanning experiment indicates that the two results are generally consistent. Liquid sulfur deposition and adsorption has a greater impact on types II and III reservoirs with smaller original pore diameters and poorer pore structures.
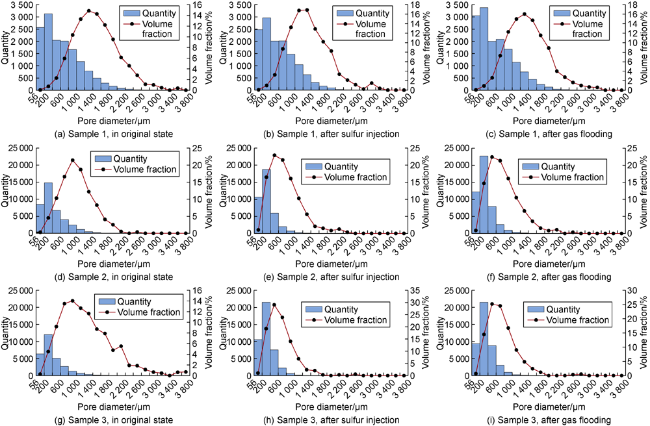
Fig. 4. Pore size distribution of core samples before and after displacement. |
Since there is currently no universally recognized pore classification scheme for carbonate rocks, and no specific formula for converting pore size in NMR experiments for carbonate rocks, accurate NMR pore size distribution data cannot be obtained. This paper only quantitatively compares the pore size distribution within the accuracy range of the CT scanning experiment. Subsequent research will rely on NMR experiments for precise calculation of the full pore size distribution in carbonate rocks to achieve a more accurate quantitative study of the effect of liquid sulfur deposition on pore size.
2.2. Pore connectivity
Through NMR imaging experiments, the characteristics of the cores in original state, after sulfur injection, and after gas flooding can be intuitively obtained. The results are shown in Table 2 , including the overall profile of the samples and three cross-sectional images at four equal sections of the samples in each state. For Sample 1 with better physical properties, in original state, the image signal is strong, indicating good connectivity. After sulfur injection, the overall signal deteriorates, with discontinuous internal signals and increased heterogeneity. Despite the slightly weaker overall signal of the core after gas flooding compared to the original state, the core remains relatively homogeneous with good connectivity, indicating minimal impact of liquid sulfur deposition and adsorption on reservoirs with good physical properties like Sample 1. Conversely, for samples 2 and 3 with poorer physical properties in the original state, the intermediate signals in the core are relatively strong, while the signals around are weaker. After sulfur injection, the internal signals of the core basically disappear, showing an overall non-connected state. Even after gas flooding, only signals around the periphery appear, and the core interior remains essentially non-connected, indicating severe influence of liquid sulfur deposition and blockage on the connectivity of pores in types II and III reservoirs with poor physical properties. Furthermore, compared to after sulfur injection, the overall connectivity of Sample 1 with better physical properties improves significantly after gas flooding, while samples 2 and 3 with poorer physical properties still maintain a non-connected state internally after gas flooding.
Table 2. NMR imaging results of core samples in different states |
| Sample No. | Displacement status | NMR imaging results | ||||
|---|---|---|---|---|---|---|
| Overall cross-section | Cross-section 1 | Cross-section 2 | Cross-section 3 | Color scale | ||
| 1 | Original state | 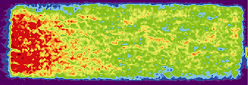 | 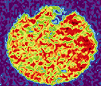 | 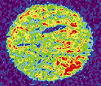 | 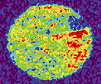 |  |
| After sulfur injection | 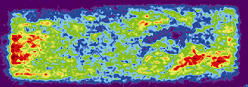 | 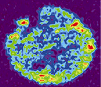 | 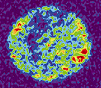 | 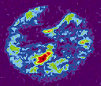 | ||
| After gas flooding | 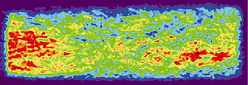 | 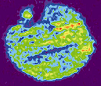 | 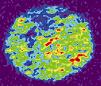 | 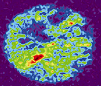 | ||
| 2 | Original state | 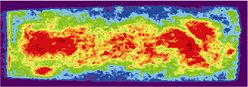 | 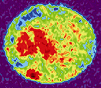 | 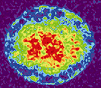 | 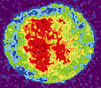 | 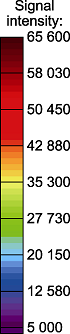 |
| After sulfur injection |  | 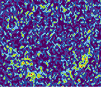 |  | 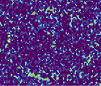 | ||
| After gas flooding | 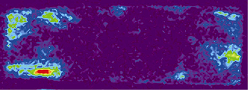 |  | 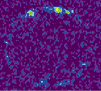 | 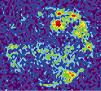 | ||
| 3 | Original state | 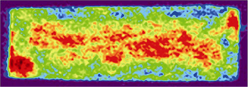 | 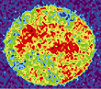 | 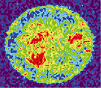 | 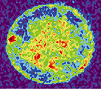 |  |
| After sulfur injection | 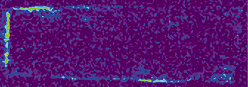 | 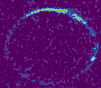 | 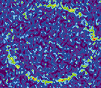 | 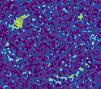 | ||
| After gas flooding | 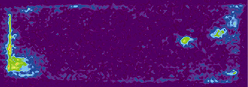 |  | 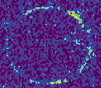 | 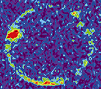 | ||
Figs. 5 to 7 show the 3D pore models and pore network models of three core samples established using Avizo. The original pores of Sample 1 are well-developed with good overall connectivity and relatively few non-connected pores (Fig. 5 ). After sulfur injection and gas flooding, the number of non-connected pores increases, but that of the overall connected pores shows no significant change, indicating minimal impact of liquid sulfur deposition on the connected large pores and dominant flow channels. Compared to the state after sulfur injection, the connectivity improves after gas flooding with fewer non-connected pores, suggesting weaker adsorption and deposition capacity of liquid sulfur in large pores, making it more susceptible to be carried away by gas flow.
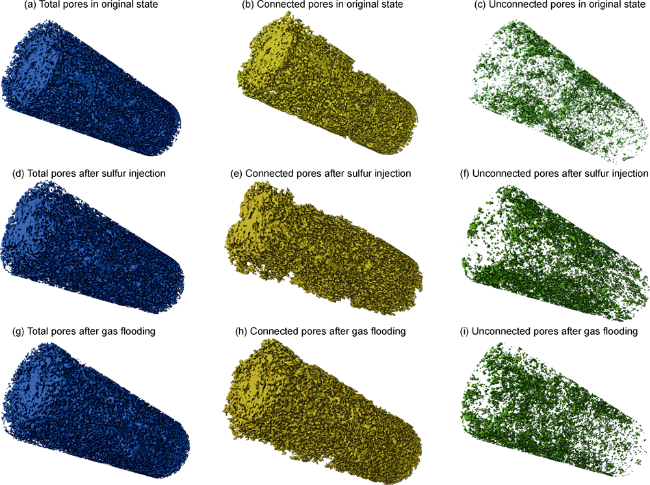
Fig. 5. Changes in connectivity before and after displacement of Sample 1 through CT scanning. |
For Sample 2 with poorer physical properties (Fig. 6 ), the original connectivity is worse than that of Sample 1, with a wider distribution of non-connected pores. After sulfur injection, there are virtually no connected pores, necessitating the establishment of an overall pore network model to observe local connectivity features. From the pore network models in the XZ and YZ directions, most of the pore throats exist at both ends of the rock sample, with almost no pore throats in the middle serving as connecting pathways. The overall core remains non-connected, indicating greater damage inflicted by liquid sulfur deposition on cores with poorer physical properties. After gas flooding, local connectivity remains at both ends of the core, with a slight increase in the number of pore throats in the middle, but overall connectivity is still not achieved.
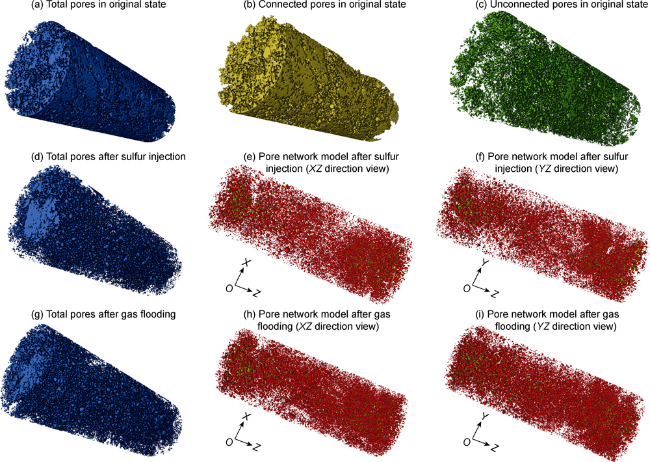
Fig. 6. Changes in connectivity before and after displacement of Sample 2 through CT scanning (in the pore network model, red represents pores, and green represents pore-throats). |
Sample 3 exhibits the poorest physical properties (Fig. 7 ). In the original state, the connectivity is relatively good at both ends and in the center of the core, but with dominant non-connected pores. After sulfur injection, the overall pores become discrete, and even after gas flooding, the space remains unopened, with locally connected pore networks still concentrated at the relatively connected ends of the original core, indicating that the stronger the pore connectivity, the less likely liquid sulfur is to deposit and adsorb.
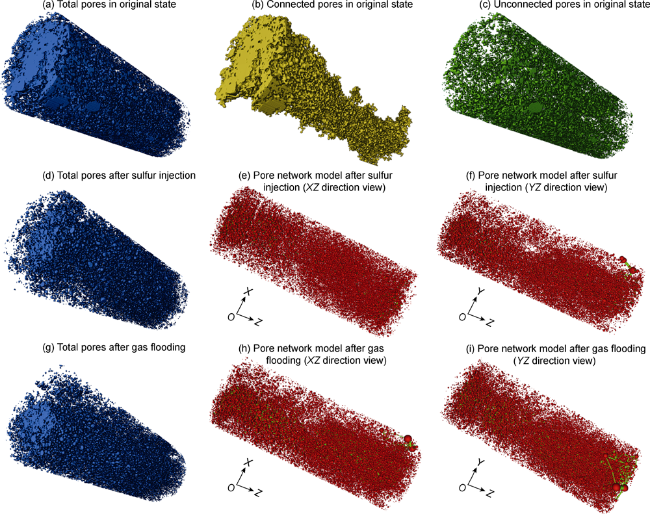
Fig. 7. Changes in connectivity before and after displacement of Sample 3 through CT scanning (in the pore network model, red represents pores, and green represents pore-throats). |
These results align perfectly with the NMR imaging results. Overall, poorer pore connectivity correlates with poorer physical properties, making liquid sulfur deposition and adsorption more likely, resulting in greater damage to the reservoir.
3. Heterogeneity of pore structure
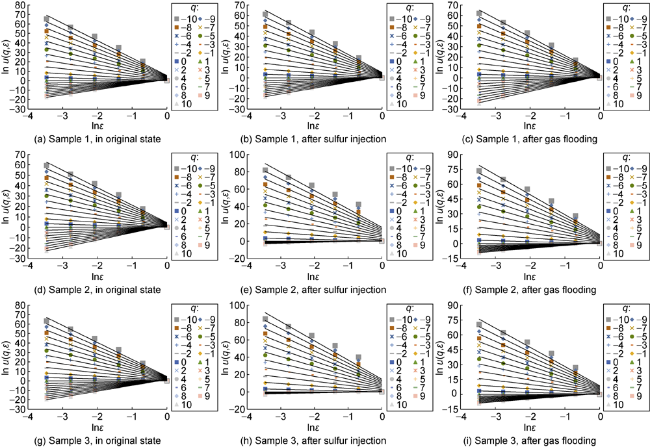
Fig. 8. Relationship between the partition function and the order for samples in different states. |
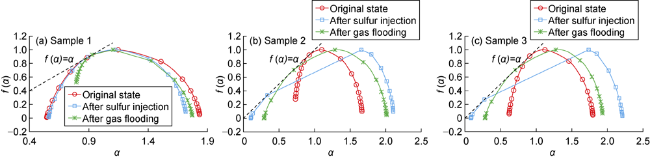
Fig. 9. Multifractal singularity spectrum α-f(α) under different states. |
Table 3. Parameters for multifractal analysis |
| Sample No. | Displacement state | D0 | D1 | D2 | H | D10− to D10+ | α0 | Δα |
|---|---|---|---|---|---|---|---|---|
| 1 | Original | 1.000 0 | 0.885 3 | 0.809 1 | 0.904 5 | 1.065 2 | 0.670 9 | 0.394 3 |
| After sulfur injection | 1.000 0 | 0.896 4 | 0.823 4 | 0.911 7 | 0.946 0 | 0.568 6 | 0.377 3 | |
| After gas flooding | 1.000 0 | 0.927 8 | 0.893 8 | 0.946 9 | 0.789 9 | 0.613 7 | 0.176 2 | |
| 2 | Original | 1.000 0 | 0.924 6 | 0.884 2 | 0.942 1 | 0.741 9 | 0.523 7 | 0.218 2 |
| After sulfur injection | 1.000 0 | 0.335 8 | 0.192 3 | 0.596 2 | 1.808 0 | 0.924 4 | 0.883 7 | |
| After gas flooding | 1.000 0 | 0.707 9 | 0.516 3 | 0.758 1 | 1.509 9 | 0.833 4 | 0.676 5 | |
| 3 | Original | 1.000 0 | 0.908 8 | 0.852 7 | 0.926 4 | 0.952 6 | 0.635 5 | 0.317 1 |
| After sulfur injection | 1.000 0 | 0.272 3 | 0.151 9 | 0.576 0 | 1.920 1 | 1.012 3 | 0.907 8 | |
| After gas flooding | 1.000 0 | 0.703 7 | 0.502 5 | 0.751 2 | 1.449 1 | 0.761 1 | 0.688 0 |
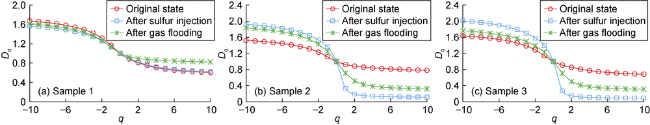
Fig. 10. Generalized fractal dimension spectrum q-Dq under different states. |
4. Impact of liquid sulfur deposition on reservoir properties
To clarify the influence of liquid sulfur deposition and adsorption on the macroscopic properties of the reservoir, porosity and permeability tests were conducted on core samples in original state, after sulfur injection, and after gas flooding. Porosity was characterized using gas logging experiments and CT data calculations. The results, as shown in Table 4 , reveal a close agreement between the two methods for determining porosity. After liquid sulfur deposition and adsorption, both porosity and permeability of different types of core samples showed a decreasing trend. For Sample 1, the porosity decreased by 15% and the permeability decreased by 16% after sulfur injection-gas flooding, indicating relatively minor damage. For samples 2 and 3 with poorer physical properties, the porosity decreased by 40% to 50%, and the permeability decreased by over 90% after sulfur injection-gas flooding, indicating severe damage. This suggests that the worse the initial physical properties, the greater the damage caused by liquid sulfur deposition and adsorption. Furthermore, comparing the physical properties after gas flooding and sulfur injection, it is observed that the permeability of Sample 1 recovered by 34% after gas flooding, while the permeability recovery of samples 2 and 3 was less than 0.2%, indicating that the worse the initial physical properties, the easier the adsorption and deposition of liquid sulfur will occur, resulting in greater damage to the reservoir.
Table 4. Physical properties of cores before and after displacement |
| Sample No. | Displacement state | Porosity/% | Gas logging permeability/ 10−3 μm2 | |
|---|---|---|---|---|
| Gas logging | CT calculation | |||
| 1 | Original | 22.63 | 21.21 | 2 155.280 00 |
| After sulfur injection | 16.75 | 14.66 | 1 075.580 00 | |
| After gas flooding | 19.10 | 18.12 | 1 807.690 00 | |
| 2 | Original | 16.10 | 15.18 | 15.510 00 |
| After sulfur injection | 6.57 | 5.54 | 0.001 70 | |
| After gas flooding | 8.01 | 7.58 | 0.004 80 | |
| 3 | Original | 12.54 | 11.96 | 0.570 00 |
| After sulfur injection | 6.31 | 5.30 | 0.000 51 | |
| After gas flooding | 7.67 | 7.15 | 0.001 20 | |
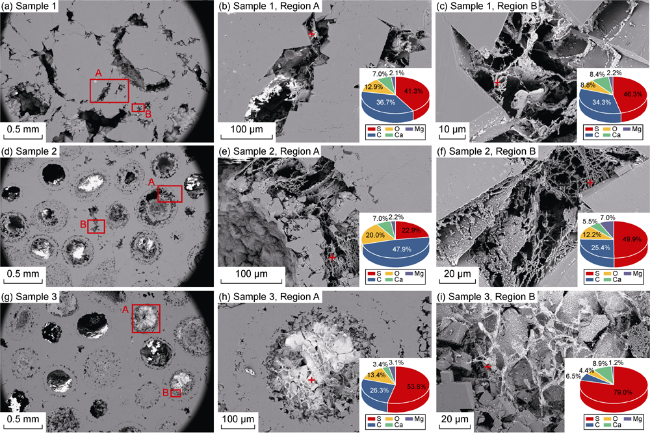
The fundamental reason for the change in macroscopic reservoir properties of high-H2S gas reservoirs is the alteration in rock micro-pore structure caused by liquid sulfur deposition and adsorption. Through quantitative characterization of reservoirs under the influence of liquid sulfur deposition, it is found that the poorer the pore structure and physical properties of the reservoir, the easier the deposition and adsorption of liquid sulfur will occur, which will have a greater impact on the pore size distribution, connectivity, and heterogeneity of the reservoir, thereby causing greater damage to the physical properties. According to the FSEM imaging and energy spectrum analysis on core samples after sulfur injection-gas flooding (Fig. 11 ), in Sample 1 representing intergranular pore-type reservoirs, with larger and well- connected pores, sulfur flows easily during displacement. Therefore, sulfur is mainly adsorbed and deposited in the form of floccules or cobwebs on the surfaces of large pore throats or within small pore throats, causing blockage of a small number of small pores, and dividing or shrinking large pores to medium pores. As a result, the overall pore volume decreases, but the deposit density is low, so the main fluid channels are not affected significantly. Thus, liquid sulfur deposition and adsorption have less impact on the physical properties of Type I reservoirs with relatively good properties. For Sample 2 representing intragranular-intergranular pore-type reservoirs, due to relatively poor connectivity of intragranular pores and smaller and fewer intergranular pores, sulfur is partially adsorbed and deposited in the form of retinitis within the intragranular pores, reducing the porosity, while the rest is deposited in the form of layered sheet or cobweb within intergranular pores, with a relatively high density, blocking the main fluid channels and deteriorating overall connectivity. Consequently, this leads to a sharp decrease in reservoir permeability. For Sample 3 representing intragranular pore-type reservoirs, with initially poor pore structure and poor overall connectivity, sulfur is adsorbed and deposited in the form of retinitis within intragranular pores. As a result, it is difficult to flow and presents as relatively dense deposit, thus reducing the pore size, increasing the degree of pore distribution discreteness, and causing greater damage to the reservoir.
Fig. 11. FESEM images of cores with liquid sulfur deposition and adsorption. |
To achieve long-term and stable production in high- H2S gas reservoirs, it is necessary to further characterize reservoir types and clarify the microscopic mechanisms of sulfur deposition damage to reservoirs, which will facilitate the refined production allocation under the influence of sulfur deposition. Additionally, zonal sulfur-controlling measures should be developed. For Type I reservoirs with relatively good physical properties, where sulfur adsorption and deposition is weak, considering the gas-carrying effect during development, the gas production rate can be increased properly to establish a high-rate production system. For types II and III reservoirs with poorer physical properties, green and efficient sulfur solubilizers can be developed to dissolve blockages in low-permeability reservoirs caused by deposition; on the other hand, acid fracturing is implemented to improve near-wellbore reservoir permeability and reduce sulfur deposition and adsorption, thereby increasing the recovery rate of high-H2S gas reservoirs. In the future, deeper research is required on the fundamental reasons for sulfur deposition differences caused by pore differences in reservoirs and corresponding methods for plugging removal, focusing on aspects such as fine classification of reservoir pores, kinetics mechanisms of microscopic sulfur deposition, and macroscopic laboratory experiments for plugging removal, in order to develop rational sulfur control strategies.
5. Conclusions
Core samples from three types of reservoirs exhibit a trimodal feature of NMR T2 spectrum in the original state and a bimodal feature after sulfur injection-gas flooding. For samples 2 and 3 with poorer pore structures, the third peak noticeably shifts downwards, indicating a significant reduction in medium to large pores and pore volume. The loss of pore volume in core samples induced by liquid sulfur deposition and adsorption primarily originates from medium to large pores. Liquid sulfur exhibits stronger deposition and adsorption capability in smaller pore spaces, leading to easier blockage of smaller pore throats. Consequently, the damage to reservoirs is greater for those with smaller original pore sizes and poorer pore structures.
Based on the visualization results from NMR imaging and CT reconstruction models, it is observed that the poorer the original reservoir pore structure and connectivity, the easier the deposition and adsorption of liquid sulfur will occur, leading to poorer pore connectivity. Furthermore, the pore structures of high-H2S carbonate gas reservoirs exhibit multifractal characteristics. The worse the pore structure, the greater the change in internal pore distribution caused by liquid sulfur deposition and adsorption, and the stronger the heterogeneity.
The changes in rock micro-pore size distribution, pore connectivity, and heterogeneity induced by liquid sulfur deposition and adsorption are the fundamental causes of the alteration in macroscopic physical properties of high-H2S gas reservoirs. After sulfur injection-gas flooding, the porosity and permeability of Sample 1 with relatively good properties decrease by 15% and 16%, respectively; the porosity and permeability of samples 2 and 3 with poorer properties decrease by 40%-50% and over 90%, respectively, indicating severe damage. This highlights that the poorer the initial physical properties, the greater the damage caused by liquid sulfur deposition and adsorption.
Liquid sulfur is deposited and adsorbed in various pore spaces in forms of floccules, cobwebs or retinitis, causing changes in reservoir pore structure and physical properties. It is necessary to further characterize reservoir types and clarify the microscopic mechanisms of sulfur deposition damage to reservoirs, in order to make zonal sulfur-controlling measures.
Nomenclature
D0—capacity dimension;
D1—information dimension;
D2—correlation dimension;
D10−-D10+—width of the generalized fractal dimension spectrum;
Dq—generalized fractal dimension;
f(α)—dimension of fractal subset labeled by α;
H—Hurst index.
L—length of the dataset;
N(ε)—number of boxes needed to completely cover L;
Nα(ε)—number of boxes when the Lipschitz-Hölder singular index values are equal;
Ni(ε)—amplitude of NMR signal in the ith box;
Nt—total amplitude of NMR signal;
Pi(ε)—probability mass function of the ith box;
q—statistical moment order;
T2—transverse relaxation time, ms;
u(q, ε)—partition function;
Ui(q, ε)—proportion of the probability mass function of the ith box;
α—Lipschitz-Hölder singularity index;
α0—singularity index when q=0;
Δα—width of the multifractal singular spectrum;
ε—box length;
τ(q)—mass scaling function of order q.