

Introduction
China is rich in unconventional oil and gas resources such as shale oil and gas, which has become the main contributor of newly proven reserves in recent years [1]. Accelerating the development and utilization of unconventional oil and gas resources is an important guarantee to enhance national energy security. Reservoir stimulation is the key technology to improve the recovery of unconventional oil and gas reserves [2-3], while the effective support of artificial fracture network in reservoir stimulation is the key to creating the oil and gas flow channel with high conductivity. The efficient transportation and placement of proppant within the artificial fracture is fundamental to enhance the fracture support effect [4].
In order to predict the distribution of proppant in fractures, the artificial fractures generated by fracturing were initially assumed to be straight fractures with smooth wall surfaces (also called straight smooth fractures). This assumption simplifies the problem by portraying the basic morphological characteristics of hydraulic fractures and is most widely used in proppant transport studies. Based on this assumption, many scholars analyzed the interaction between proppant particles and fluid in smooth fractures [5], studied the influences of fluid flow pattern, injection velocity, perforation position, fracture width, proppant particle size, proppant density, proppant concentration, and complex fracture network [6⇓⇓-9], revealed the characteristics of the proppant transport behaviors and mechanisms [10-11], and established the prediction model of proppant placement distance and sand dune height [12-13].
Although the results of the fracture simplification have a certain guiding effect on proppant selection and pumping parameter optimization in reservoir stimulation, they cannot reflect the real situation of proppant transport in fractured artificial fractures, which is not conducive to the accurate judgment and regulation of proppant pumping. In recent years, the simulation and experimental researches on the transport of proppant in fractures with rough wall surfaces (also called rough fractures) have become increasingly attractive in the industry. Relevant studies show that the settling velocity and migration direction of proppant particles in rough fractures are more complex, with stronger fluctuations and jumps in the transverse and longitudinal directions[14⇓-16]. Rough fracture walls lead to a high degree of uncertainty in proppant transport behavior [17-18] and affect the flow path of sand-carrying fluid [19-20]. Proppants do not advance uniformly when transported within tortuous rough fractures [21], and particle size has a large impact on how they are transported within rough fractures [22].
However, there is limited research on proppant transport and placement within rough fractures. Previous studies mostly used algorithmic programs to generate rough fractures for simulation [13,15,23], which differ from the tortuous rough artificial fractures generated by reservoir stimulation. In experiments, restricted by the technology, small-scale rough fracture models are usually adopted, or on the smooth surface [19,24⇓ -26]. These procedures cannot fully reflect the proppant transport behaviors and placement characteristics within actual rough fractures created by hydraulic fracturing.
In order to further describe the proppant transport behaviors in tortuous rough fractures generated during reservoir fracturing, this paper adopts the casting process to reconstruct the fracture surface of hydraulically fractured large-size tight sandstone outcrop in three-dimensional manner, builds a visual rough fracture model reflecting the characteristics of the real rough wall surface, and proposes a large-scale experimental setup for visualizing the proppant transport in rough fractures. Based on this setup, the typical behaviors and internal mechanisms of proppant transport in tortuous rough fractures were systematically investigated, and the influences of fracture inclination, fracture width and fracturing fluid viscosity on the transport and placement of proppant in rough fractures were analyzed. The results of the study provide deeper understanding on the behavior and mechanism of proppant transport in rough fractures created by reservoir fracturing, and also theoretical support for the optimization of proppant pumping parameters.
1. Experimental setup and schemes
1.1. Experimental setup
In order to more accurately restore the proppant transport behaviors in rough fractures created in reservoir fracturing, large-size outcrops of tight sandstone in the Ordos Basin were selected for splitting and fracturing to obtain tensile fractures with the same type and similar characteristics as those of hydraulic fractures. Fig. 1a and 1b give the rough fracture surface of the split rock sample and the height images of the fracture wall surface at different locations obtained by scanning with a high-precision 3D laser scanner, respectively. The fractal dimension of the fracture surface was calculated to be 2.27 using the cubic covering method. Then based on the fracture and using silicone, resin and other materials, the casting process was used on both sidewalls of split fracture to obtain a large visual rough fracture model with the morphological characteristics of the real fracture wall surface. The front and side views of the model are given in Fig. 1c , where the tortuous and rough characteristics of the fracture are remarkable.

Fig. 1. Rough fracture model reflecting the morphological characteristics of the real fracture surface. |
The dimensions of experimental fracture model and field hydraulic fracture usually remain geometrically similar in length and height, and identical in width [12]. In previous studies, when designing experimental setups to simulate proppant transport with reference to hydraulic fracture dimensions, the ratio of the length to the height of the fracture was usually set to be greater than or equal to 2 [7]. In this paper, the rough fracture model was designed with a length of 1 000 mm, a height of 500 mm, and an adjustable width within 1-5 mm, to satisfy the requirement of geometric similarity. Moreover, the experimental fracture model was set with the same Reynolds number of the fluid as in actual hydraulic fracture, and much greater length and height than the width, so that the observed flow pattern of sand-carrying fluid could be kinematically and dynamically similar to the situation of actual fracture [27]. In addition, unconventional oil and gas reservoirs are characterized by low to ultra-low permeability, and the rate of fracturing fluid loss in the fracture is low, so the rough fracture model does not consider the fluid loss on the sidewalls.
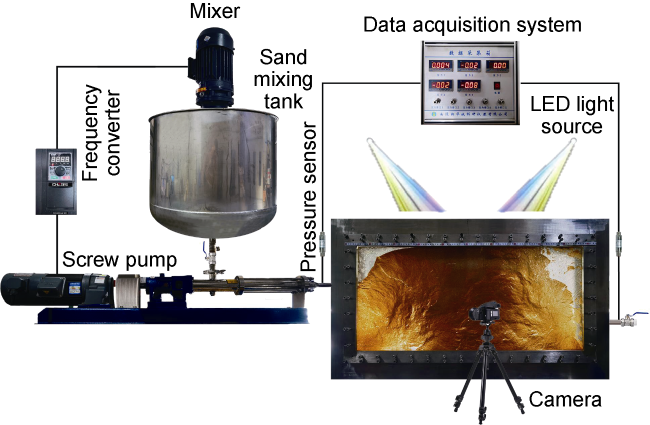
Fig. 2. Experimental setup for visualizing proppant transport in rough fracture. |
1.2. Experimental scheme
In order to study the typical transport characteristics of proppant in rough fractures formed in reservoir fracturing, the fracturing materials and construction parameters commonly used in field operations were selected for experimental scheme design.
Guanidine gum is a popular thickening agent for fracturing fluids in field fracturing operations because of its excellent viscosity increasing and sand-carrying performance. In this study, three fracturing fluids were prepared using tap water and guanidine gum with guanidine gum mass fractions of 0.25%, 0.30% and 0.35%, respectively, and no other additives were used to ensure the transmittance of the experimental working fluids. Since the length and height of the fracture in the model were scaled down proportionally and the width of the fracture was close to the actual one, 425/212 μm (40/70 mesh) quartz sand commonly used in the field was selected as the proppant in the experiment. The selected proppant has the particle size of 212-425 μm, the apparent density of 2.64 g/cm3, the roundness and sphericity of 0.7. The sand ratio in the experiment was 10%.
As mentioned before, in addition to the geometrical similarity between the fracture model and the actual hydraulic fracture in size, the kinetic similarity between the experimental working fluid pumping and the fracturing fluid flow in the actual fracture also needs to be satisfied. Since the flow of fracturing fluid in the fracture is mainly affected by the viscous force, the Reynolds similarity criterion is chosen for the kinetic similarity calculation, and the calculation formula is as follows:
$\frac{{{\rho }_{\text{s}}}{{v}_{\text{s}}}{{d}_{\text{s}}}}{{{\mu }_{\text{s}}}}=\frac{{{\rho }_{\text{m}}}{{v}_{\text{m}}}{{d}_{\text{m}}}}{{{\mu }_{\text{m}}}}$
Since the fracture model width is close to the actual fracture width, and the density of the three fracturing fluids prepared is around 1.01 g/cm3, which is close to the density of guanidine gum fracturing fluid actually used in the field, the following equation can be obtained from Eq. (1):
${{v}_{\text{m}}}=\frac{{{\mu }_{\text{m}}}{{v}_{\text{s}}}}{{{\mu }_{\text{s}}}}$
For guanidine gum fracturing fluids used in unconventional oil and gas reservoir stimulation, they can meet sand-carrying requirements generally when their viscosities exceed 80 mPa·s [28]. In addition, the average flow velocity of fracturing fluid in the hydraulic fracture is mostly lower than 0.25 m/s [29]. Therefore, the fracturing fluid viscosity of 80 mPa·s and the fluid velocity within the fracture of 0.2 m/s were chosen as the reference parameters in actual operations. Taking the fracturing fluid with guanidine gum mass fraction of 0.3% as an example, the viscosity of this fracturing fluid was measured to be 12 mPa·s at room temperature, and the average fluid velocity within the fracture in the experiment was 0.03 m/s from Eq. (2). Then, based on the width and height of the fracture, the pumping rate in the experiment was determined. The experimental parameters obtained according to the similarity criterion are shown in Table 1.
Table 1. Experimental schemes |
| Case | Angle between fracture and vertical direction/(°) | Fracture width/mm | Mass fraction of guanidine gum/% | Fluid viscosity/ (mPa·s) | Pumping rate/ (L·min-1) | Sand ratio/% |
|---|---|---|---|---|---|---|
| 1 | 0 | 2.0 | 0.30 | 12 | 1.80 | 10 |
| 2 | 10 | 2.0 | 0.30 | 12 | 1.80 | 10 |
| 3 | 20 | 2.0 | 0.30 | 12 | 1.80 | 10 |
| 4 | 0 | 1.5 | 0.30 | 12 | 1.35 | 10 |
| 5 | 0 | 3.0 | 0.30 | 12 | 2.70 | 10 |
| 6 | 0 | 2.0 | 0.25 | 5 | 1.80 | 10 |
| 7 | 0 | 2.0 | 0.35 | 19 | 1.80 | 10 |
2. Results and analysis
2.1. Characterization of proppant transport in rough fracture
In order to reveal the typical characteristics and intrinsic mechanism of proppant transport in rough fracture, Case 1 with an average fracture width of 2 mm was selected for analysis. The process of proppant transport and placement in Case 1 is shown in Fig. 3. In straight smooth fractures, the proppant pumped into the fracture usually moves forward in uniform suspension in the fluid before settling under gravity to form a flat sand dune at the bottom of the fracture [11,13]. As can be seen from Fig. 3 , the flow pattern of sand-carrying fluid in rough fracture at the early stage of injection (1-3 min) shows streaks, indicating that the proppant suspended in the fracture is not uniformly distributed, which is due to the complex width variation of the rough fracture. Essentially, the proppant particles tend to migrate along the specific dominant flow paths. With the continuous pumping of sand-carrying fluid, the sand dune accumulating in the fracture grows until its height reaches a relative equilibrium state. Unlike the sand dune accumulating in straight smooth fracture, the sand dune in rough fracture is irregular morphologically and with scattered unfilled zones in the center.
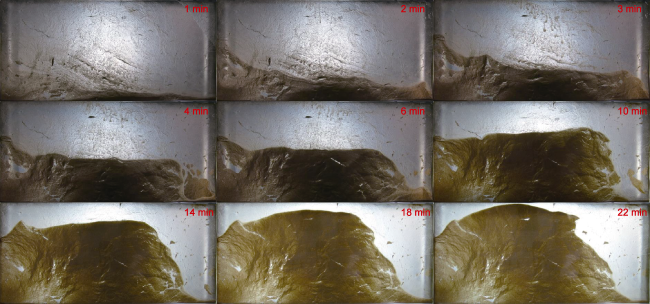
Fig. 3. Process of proppant transport and placement in rough fracture. |
The fracture surface morphology has an impact on the fluid flow and the motion behavior of particles in rock fractures. Some typical features of the sand-carrying fluid flow in rough fracture are given in Fig. 4. It can be seen that the fluid flow in rough fracture is more complex, in contrast to the regular and orderly flow in straight smooth fracture. As shown in Fig. 4a , the sand-carrying fluid presents various flow behaviors, such as channeling, reverse flow, and bypass flow, after entering the rough fracture. The fluid flow in the fracture is closely related to the shape of the flow channel, and the spatial structure and width distribution of the fracture flow channel are affected by the roughness of the fracture surface. Thus, the sand-carrying fluid shows complex and variable flow behaviors in the rough hydraulic fracture.

Fig. 4. Characteristics of sand-carrying fluid flow in rough fracture. |
During the flow of the sand-carrying fluid, the proppant may bridge and accumulate in some areas of the rough fracture, forming various shapes of proppant clusters (Fig. 4b ), which restricts the flow of the sand-carrying fluid. Fig. 5 gives the flow field distribution in the region around proppant cluster when the sand-carrying fluid flows through. It can be seen that the fracture wall surface roughness significantly affects the fluid flow in the fracture, and the built-up proppant clusters cause the fluid bypassing, which alters the proppant’s state of motion and ultimately results in unfilled zones in the sand dune (Fig. 4c ).

Fig. 5. Flow field distribution around the proppant cluster. |
Observation of the experimental images shows that the occurrence of bridging and the formation of unfilled zones when the proppant is transported in a rough fracture is the most obvious feature that distinguishes it from its transport and placement behaviors in a straight smooth fracture. The roughness of the fracture surface has the most direct impact on the geometry of the flow channel [30]. Taking the fracture with an average width of 2 mm in the experiment as an example, a schematic diagram of the fracture width variation is provided in Fig. 6. For a smooth fracture, local width reduction occurs at the location where the flow channel becomes tortuous, with a greater reduction at a location with increased tortuosity, which causes bridging of the proppant (Fig. 6a ). Given the same channel shape, the effective width of the rough fracture at the tortuous position is smaller than that of the smooth fracture (Fig. 6b ), increasing the possibility of bridging during the proppant transport. Due to the effect of roughness, the hydraulic aperture of the fracture is usually lower than the mechanical aperture [31]. According to the boundary layer theory, it is known that when the sand-carrying fluid flows through the turning of the flow channel, as shown in Fig. 7 , there is a favorable pressure gradient at the point S1, and the pressure force acting on the fluid particle is in the same direction as the flow direction. After the fluid passes through the point S2, the pressure gradient is positive, and the pressure force acting on the fluid particle is opposite to the flow direction. Under the dual effect of the reverse pressure gradient and viscous resistance, fracturing fluid separation begins to occur at the point S3, thus causing flow loss, which is not conducive to the transport of proppant. Therefore, the proppant is more prone to generate bridging and buildup at the tortuous location in the rough fracture.
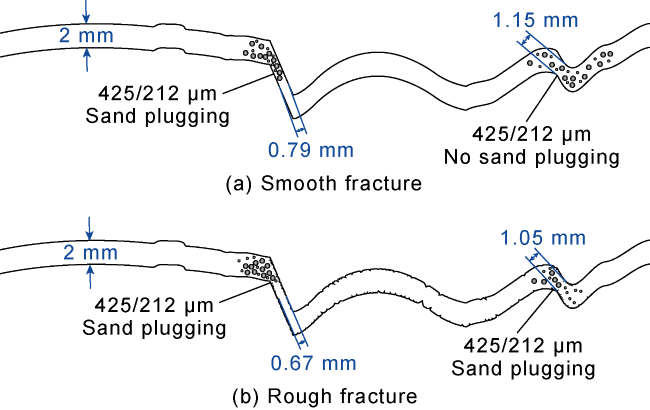
Fig. 6. Schematic diagram of the variation of fracture width in hydraulic fracture. |

Fig. 7. Schematic flow separation at the turning of rough fracture. |
The above analysis indicates that, unlike the simplified straight smooth fracture, the inherent surface roughness characteristics of the hydraulic fracture will bring about changes in the shape of flow channel and flow pattern, resulting in complex fluid flow and proppant bridging buildup, which in turn will impact the motion behavior of the proppant and the placement pattern of the sand dune, and ultimately affect the filling effect of the artificial fracture.
2.2. Influence of fracture inclination
In the reservoir stimulation, reservoir geological features (e.g. stress distribution, natural fractures and beddings) may cause the extension trajectory of hydraulic fracture to deflect in the vertical direction, forming inclined fractures. In Case 1, Case 2 and Case 3, three fractures with different angles to the vertical direction, i.e. 0°, 10° and 20°, were set to study the transport and placement of proppant in inclined hydraulic fractures. Fig. 8 shows the experimental proppant transport and placement process in fractures with different degrees of inclination. It can be observed that the inclination of the fracture has a noticeable impact on the proppant transport behavior and the sand dune distribution pattern. Compared to a vertical fracture, proppant is transported over longer distance and placed in a larger area in an inclined fracture under the same injection time. Essentially, the inclination of the fracture in the direction of gravity enhances the particle-wall contact (collision, friction, etc.) (Fig. 9 ), and the effect of this contact on particle settling becomes more pronounced in rough fractures, which leads to a reduction in the rate of proppant settling and increases the proppant transport distance and distribution range.
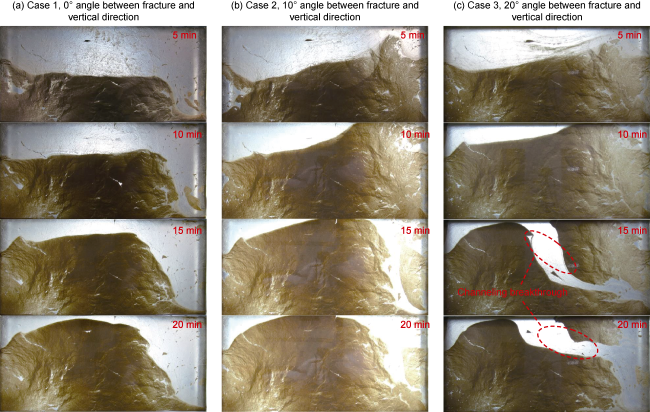
Fig. 8. Transport and placement process of proppant in fractures with different inclination degrees. |
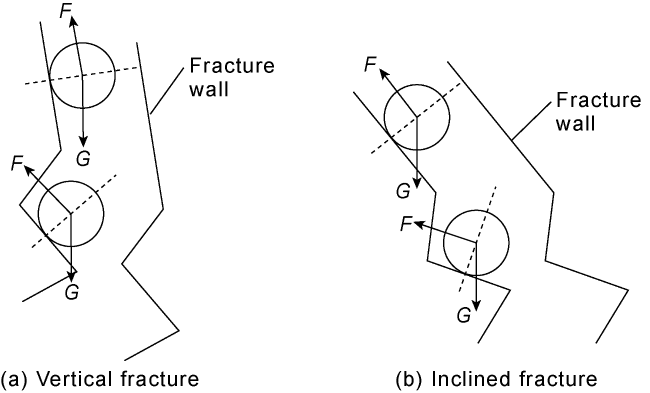
Fig. 9. Schematic proppant settlement inside vertical and inclined rough fractures. |
It is also observed in Fig. 8 that as the fracture inclination increases, the sand dunes placed in the fracture are more prone to breakthrough and form a new proppant transport channel. However, such phenomenon did not occur in the experiments on proppant transport inside smooth inclined fractures carried out by Chun et al. [32]. This suggests that the fracture wall surface roughness affects the flow path of sand-carrying fluid, but also controls the stability of proppant placement.
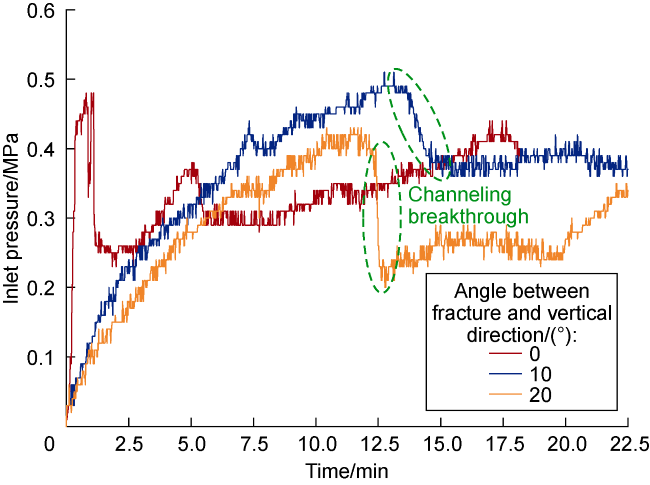
Fig. 10. Variation of pumping pressure with time at different fracture inclination degrees. |
The proppant placement rate in the fracture can be obtained by calculating the ratio of the projected area of the front view of the sand dune in the fracture to the projected area of the front view of the fracture model. Fig. 11 illustrates the variation of proppant placement rate with time at different fracture inclination degrees. It can be seen that the proppant placement rate increases and then becomes gentle with the time. Both the rate and efficiency of proppant placement in the fracture are positively correlated with the inclination of the fracture. The placement rate in 10° and 20° inclined fractures increases by 14.69 and 22.16 percentage points, respectively, in comparison with that in the vertical fracture. In addition, the placement rate in the 20° inclined fracture decreases to some extent after 10 min of pumping, which can be attributed to partial proppant carrying-out of the fracture model along with the significant channeling breakthrough of the sand dune in the fracture, as evidenced in combination with Fig. 8 and Fig. 10. The proppant has a higher placement rate and also is able to reach a smooth state more quickly in inclined rough fractures, suggesting that inclined fractures created during reservoir stimulation are more readily propped.
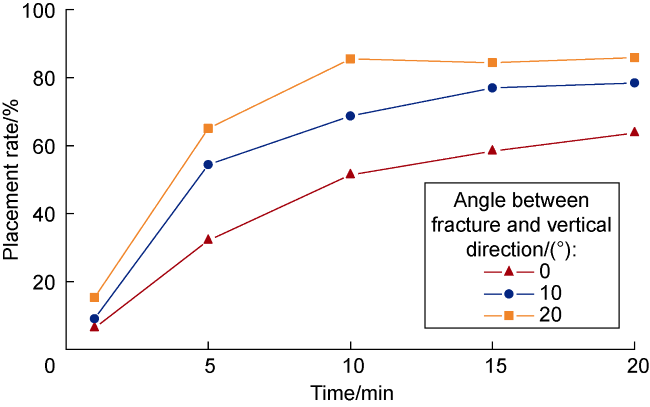
Fig. 11. Variation of placement rate with time at different fracture inclination degrees. |
2.3. Influence of fracture width
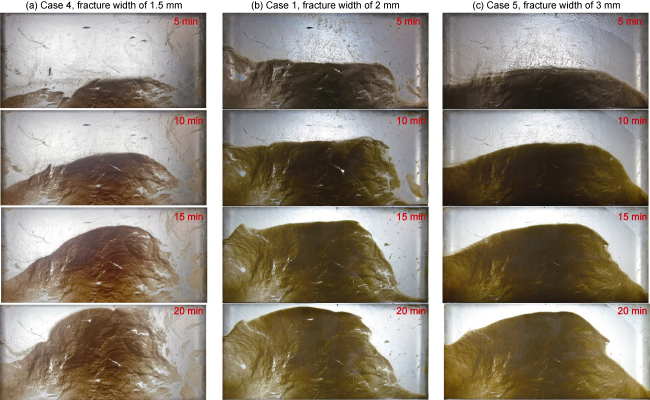
Fig. 12. Transport and placement process of proppant at different fracture widths. |
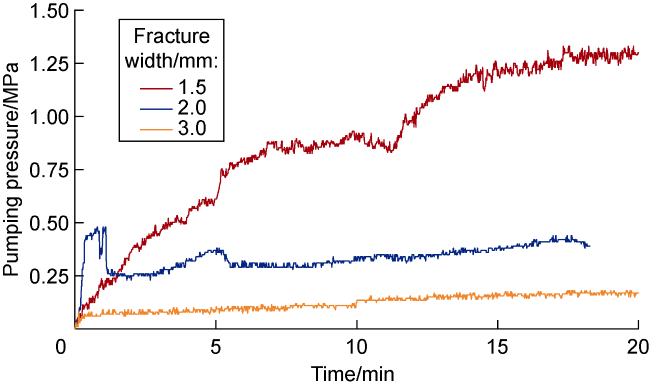
Fig. 13. Variation of pumping pressure with time at different fracture widths. |
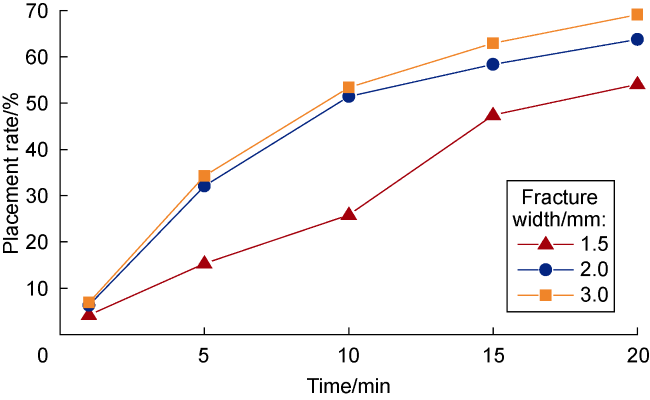
Fig. 14. Variation of placement rate with time at different fracture widths. |
In reservoir stimulation, the main fractures created are commonly large in width, while the opened natural fractures or bedding-induced branch fractures are small in width. The analysis of the pumping pressure curve indicates that improper proppant size may lead to pumping overpressure, which may damage the injection pipes and equipment to various extents and may negatively affect the placement rate of the proppant in the fracture, which is not conducive to the effective propping of for the artificial fracture. Therefore, it is crucial to choose an appropriate proppant size when pumping. Considering the influence of the ratio of proppant particle size to fracture width on the placement of sand dunes in the fracture, it can be considered to first pump small-size proppant to support the branch fracture with small width, and then the proppant with appropriate size to fill the main fracture, so that the branch fractures can be motivated to maximize the stimulated reservoir volume.
2.4. Influence of fluid viscosity
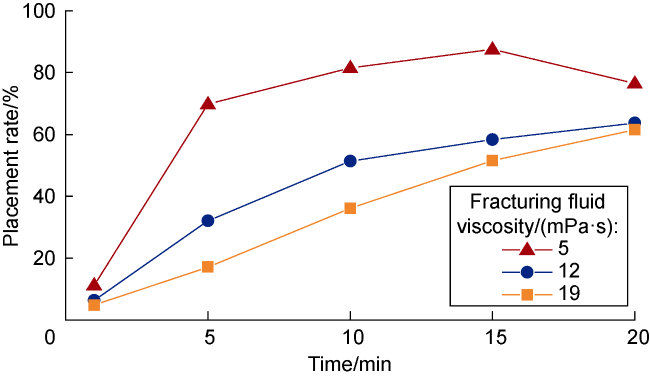
Adding thickener to adjust the viscosity of fracturing fluid is the main way to improve the sand-carrying capacity of the fracturing fluid. In Case 6, Case 1 and Case 7, fracturing fluids with viscosities of 5, 12, 19 mPa·s were prepared by adding 0.25%, 0.30% and 0.35% guanidine gum, respectively, to study the proppant transport and placement in rough fracture at different fracturing fluid viscosities. Fig. 15 shows the proppant transport and placement process at different fracturing fluid viscosities. It can be seen that, in Case 6 where a low fracturing fluid viscosity (5 mPa·s) is used, the injected proppant prefers to accumulate at the inlet and can be placed throughout the fracture at the early stage of injection. In studies related to proppant transport in straight smooth fractures, the placement of proppant throughout the fracture was rare even when a low-viscosity fracturing fluid was pumped at low velocity, and there was always a flow channel at some height between the top of the sand dune and the top of the fracture [12-13]. This paper suggests that in the actual transport of proppant, the fracture roughness may cause a complete plugging of fracture channel in the near-wellbore zone, which will lead to sand plugging. In addition, in the experiment with a fracturing fluid viscosity of 5 mPa·s, after the proppant completely plugged the fracture channel, the pumping pressure increased greatly. When the pumping pressure exceeded a certain value, the sand dune broke through, and then the pumping pressure decreased sharply (Fig. 16 ), which formed the dominant flow channel for the sand-carrying fluid. Moreover, the path of the flow channel varied with time, suggesting that the dominant flow path in the rough fracture is not fixed.
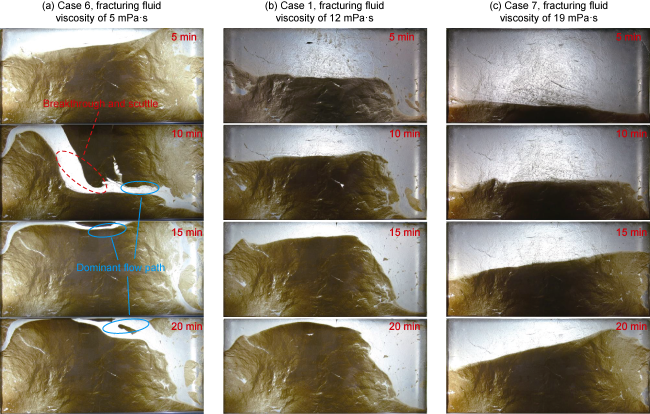
Fig. 15. Proppant transportation and placement process at different fracturing fluid viscosities. |
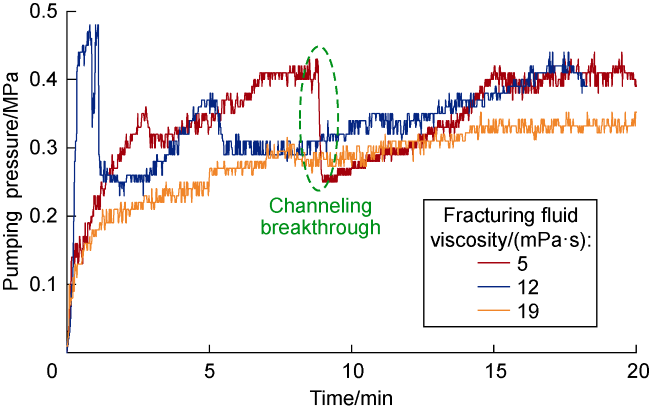
Fig. 16. Variation of pumping pressure with time at different fracturing fluid viscosities. |
For the experiment cases with fracturing fluid viscosity of 12 mPa·s and 19 mPa·s as shown in Fig. 15 , the increase in the fracturing fluid viscosity enhanced the suspension ability of the proppant, allowing it to be transported farther in the fracture. Also, increasing the viscosity of the fracturing fluid weakened the bridging buildup of the proppant in zones with greater fracture roughness and tortuosity, with a more homogeneous distribution of the sand dunes, as well as a lower pressure required for pumping the sand-carrying fluid, i.e., less hydraulic energy consumption (Fig. 16 ). This suggests that increasing the viscosity of the fracturing fluid can inhibit the proppant bridging and blockage caused by the rough fracture wall surface to a certain extent, thus facilitating the proppant transport and placement in the fracture.
Fig. 17. Variation of placement rate with time at different fracturing fluid viscosities. |
3. Conclusions
The rough wall surface of the fracture affects the fracture width and the spatial structure of the flow channel, making the sand-carrying fluid flow pattern and proppant transport behavior complex and variable. The proppant transported in rough fracture is prone to bridging buildup and forms unfilled zones, and the flow field of sand-carrying fluid is unevenly distributed and exists in various flow patterns such as channeling, reverse flow and bypassing. The sand dunes placed in rough fracture are less stable than in smooth fracture.
Inclined fractures created in reservoir stimulation are more readily to be propped. The proppant is transported farther in the inclined fracture, with higher placement rate and efficiency. Compared with the vertical fracture, the placement rate in 10° and 20° inclined fractures increases by 14.69 and 22.16 percentage points, respectively. As the inclination of the rough fracture increases, the sand dunes placed in the fracture become more instable, allowing a higher possibility of channeling breakthrough to form a new proppant transport channel.
Variation of fracture width has a significant effect on proppant transport and placement. Decreased fracture width results in more bridging buildups during proppant transport in the rough fracture, as well as significant fluctuations in the pumping pressure curve and greater demand for hydraulic energy. In fracturing, small-size proppant can be pumped first to support the narrow branch fractures, and then the proppant with appropriate size can be selected to fill the main fracture.
Increasing fracturing fluid viscosity can weaken the proppant bridging plugging caused by fracture roughness. Low-viscosity fracturing fluids carrying sand within rough fractures are prone to plugging the fracture, and the dominant flow path after the sand dunes break through varies with time. High-viscosity fracturing fluids enable more uniform distribution of sand dunes in the rough fracture and reduce the pressure loss of sand-carrying fluid as they flow through the fracture.
Acknowledgment
This work was assisted by the Youth Innovation Team of Shaanxi Universities, and funded by the Open Foundation of Shaanxi Key Laboratory of Carbon Dioxide Sequestration and Enhanced Oil Recovery.
Nomenclature
ds, dm—fracture widths in field fracturing and experiment, m;
F—frictional resistance, N;
G—gravity, N;
u1, u2, u3—velocity fields at points S1, S2 and S3, m/s;
vs, vm—fluid flow velocities in field fracturing and experiment, m/s;
ρs, ρm—fluid densities in field fracturing and experiment, kg/m3;
μs—fracturing fluid viscosity in field fracturing, mPa·s;
μm—fracturing fluid viscosity in experiment, mPa·s.