

Introduction
The world is currently in the convergence of unprecedented changes and the third wave of energy conversion. Green and low-carbon transformation has become an important driving force for global development. Against the backdrop of China's proposal to strive for carbon neutrality before 2060, promoting green and sustainable development is faced with new opportunities and challenges. Natural gas has significant low-carbon advantages and is the “best partner” connecting traditional fossil fuels to the transformation of new energy. It works in synergy with energy storage, and “gas electricity peak shaving” helps promote the development of new energy, playing an irreplaceable role [1]. The cumulative geological reserve of natural gas in China is 199 213.33×10⁸ m3, the newly increased proved geological reserve in 2022 was 10 895×108 m3, with an output of 2 201×108 m3, including 1 289×108 m3 of regular gas, 576×108 m3 of tight gas, 240×108 m3 of shale gas, 96×108 m3 of coalbed methane (coal rock gas) [2]. To ensure the energy security of China, and to build an energy powerhouse, promoting harmonious coexistence between ecological protection and economic development, and improving the construction of the natural gas production, supply, storage, and sales system, it is necessary to continue to increase exploration and development efforts, integrate the development of natural gas and new energy, optimize the structure and supporting facilities of the natural gas industry, play the role of natural gas stabilizers and regulators, support the dual development of China's natural gas industry in terms of speed and quality, and comprehensively enter its peak period.
This article reviews the development process of the world's natural gas industry, sorts out the development process and inspirations of the US shale revolution, summarizes the progress of the natural gas industry of China, elaborates on the challenges of natural gas in green and low-carbon transformation, and proposes current and future strategies for the natural gas development of China. Carbon neutrality is a decarbonization energy revolution that accelerates the transformation of the energy system towards low-carbon and zero-carbon transition. To seize the major strategic opportunity of transitioning from fossil fuels to new energy, in response to the current situation and future trends of the natural gas industry of China, we will accelerate the development and strategic succession of the natural gas industry through the development strategy of “coordinated layout, technological innovation; multi energy complementarity and diversified integration; flexible and efficient optimization and upgrading”, which is essential in order to achieve the vision of carbon neutrality, promote green transformation, and to provide scientifically reasonable and feasible solutions and reference strategies for the new energy system so as to finally build a “clean, safe, efficient, and sustainable” environment.
1. The development process of world natural gas industry and inspiration of shale gas revolution of the U.S.
Natural gas is mainly used as fuel and chemical raw materials. Compared with other fossil fuels, natural gas combustion emits less CO2, bringing a lower greenhouse effect [3], making it the cleanest fossil energy source. There are abundant resources of natural gas. It is also characterized with convenient usage, broad applications, and high compatibility with the energy usage methods and systems of human society. It is the kind of conventional fossil energy that is most likely to be able to solve environmental and climate problems.
Since 1921, the global natural gas industry has gone through four stages of development: the initial stage, stage of growth, stage of leapfrog, and the revolutionary stage (Fig. 1 ), spanning over 100 years. The period from 1921 to 1950 is the initial stage, with global natural gas production output increasing from 200×108 m3 to 3 000× 108 m3 [4], and the natural gas output of the US taking 90% of the total global natural gas output; The period from 1951 to 1970 is the stage of growth, with natural gas output increasing to 1.0×10¹² m3, and natural gas producing areas extending to Europe, former Soviet Union, the Middle East, and North Africa. The period from 1971 to 2005 is the stage of leapfrog development, with natural gas output reaching to 2.9×10¹² m3, the global natural gas producing areas featured by 5 major centers including North America, Russia, Middle East, Asia-Pacific and Africa. The period from 2006 to present is the stage of revolution, with the US leading the development of global unconventional natural gas with shale gas revolution. The global natural gas has been increasing quickly, with the 2022 annual output reaching 4×10¹² m3. According to estimation, by 2030, the total consumption of natural gas will surpass that of coal, and by 2040, surpass that of oil, becoming the most important energy source in the green development of energy [5-6].
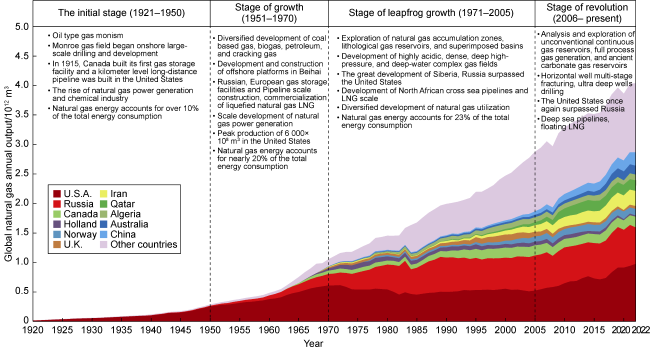
Fig. 1. Global natural gas industry development stages (modified according to Reference [4]). |
In 1973, the United States proposed the strategy of “energy independence”. In 1976, the US Department of Energy established the Eastern Shale Gas Project (EGSP) to conduct shale oil and gas development experiments; from 1981 to 1998, Mitchell Energy Development Company, after more than 10 years of exploration and experimentation, finally achieved large-scale commercial development of Barnett shale gas in 1998, opening up a new era of shale gas development. In 2022, the natural gas production in the United States was 1.23×10¹² m3, of which shale gas production was 8 068×108 m3 [7], accounting for over 65% of total energy output. Currently, four major shale gas production areas have been established, namely Marcellus, Permian, Haynesville, and Utica, and achieving an export volume of 1 100×108 m3 of liquefied natural gas (LNG). The United States is transforming from a natural gas importing country to an exporting country (Fig. 2 ). The United States has effectively promoted the country's “energy independence” through the “shale revolution” [8].
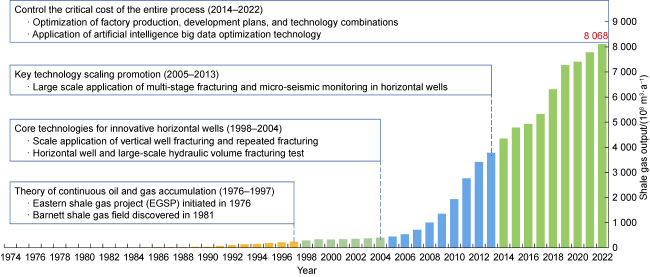
Fig. 2. Development process of shale gas in the United States. |
The "Shale Revolution" in the United States has brought important inspirations in three aspects: strategic layout, tackling in advance, and management innovation. Firstly, it has comprehensively laid out the "energy independence" strategy, and the goal of natural gas development is constantly shifting towards shale gas. A huge resource base is the basic condition for achieving the shale revolution. The field of natural gas development has expanded from conventional external structural gas reservoirs to unconventional shale reservoirs within the source, and the trend of "entering the source" for gas exploration is inevitable. Through legal and financial support policies, energy transformation can be effectively promoted. In 1976, the US government passed the Department of Energy Restructuring Act, which established specialized agencies and conducted 28 years of continuous support for the project research; Article 29 of the Crude Oil Unexpected Profit Law promulgated in 1979 provided for 26 consecutive years of tax reduction and exemption, strongly promoting the development of shale gas scale. The second is to establish advanced scientific and technological research projects, and disruptive theoretical and technological innovation is a key element of energy transformation. Breaking through theoretical barriers, shale as an oil and gas reservoir has broken through traditional oil and gas theory and opened up a new field of development in the oil and gas industry. The continuous geological theory of shale gas and the breakthrough of multi-stage fracturing technology in horizontal wells have effectively unlocked the development of shale gas resources. The third is to fully optimize resource allocation through management innovation, and complete the "self-conducted cost revolution" at low gas prices. Party A takes the lead in the "daily fee system" technical service model, "factory based" operations, efficient multi job joint organization mode, mandatory data sharing mode, and quickly forms a learning curve, greatly improving work efficiency.
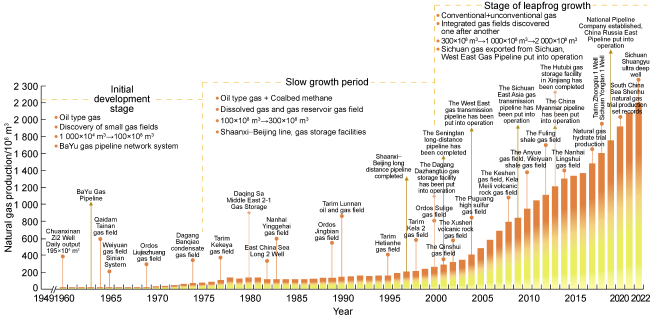
Fig. 3. Development process of natural gas industry of China. |
2. Process, achievements and progress of the natural gas development in China
2.1. Overview of the development history of natural gas in China
China has become the fourth largest natural gas producer and third largest natural gas consumer in the world. In 2022, the natural gas output was about 2 200×108 m3 [2,9], the annual output increase exceeded 10 billion cubic meters for six consecutive years, and the consumption was 3 663×108 m3, 13 times more than that in 2000. By now, four major natural gas production areas have been built, including Ordos Basin, Tarim Basin, Sichuan Basin and sea areas.
According to production, the development of China's natural gas industry can be roughly divided into three periods: (1) The initial stage of development from 1949 to 1975, with annual production gradually increasing from 1 000×104 m3 to 100×108 m3, and the cumulative proved geological reserves being less than 2 000×108 m3 [5,10⇓ -12]; (2) During the slow growth period from 1976 to 2000, production steadily increased to 300×108 m3, with a cumulative proven geological reserve of 2.5×10¹²m3. This stage was mainly characterized by “heavy oil and gas”. During this period, China's demand for oil was much higher than that of natural gas, with a focus on oil exploration and less investment in natural gas exploration. (3) From 2001 to present, the natural gas industry has achieved leapfrog development, with a cumulative proven geological reserve of 20×1012 m3 (Fig. 3 ).
2.2. Achievements and progress of natural gas Exploration and development in China
As exploration and development progresses, the natural gas industry of China continues to develop. The exploration and development areas have significantly expanded to most areas of the country, mainly including basins such as Sichuan, Ordos, Tarim, Junggar, Qaidam, Songliao, Bohai Bay, etc.; The exploration and development targets range from structural gas reservoirs to lithological gas reservoirs, from single carbonate gas reservoirs to conventional gas reservoirs, low-permeability tight gas reservoirs, volcanic gas reservoirs, and other types of gas reservoirs [5,13]. The depth of exploration and development continues to increase, moving from shallow to deep and to ultra deep layers. Breakthroughs have been made in unconventional gas exploration and development, while tight gas, shale gas, and coalbed methane (coal rock gas) are still in the early and middle stages of exploration. They will be the main force for increasing reserves and production in the future, and will become a strategic replacement and effective supplement to conventional oil and gas resources [13-14].
2.2.1. Natural gas exploration achievements and progress
The natural gas exploration in China is based on strategic, global, and forward-looking major fields and goals, with meticulous argumentation, planning, and increased exploration deployment in key basins. By making breakthroughs in new fields, new zones, new strata, and new types, the resource foundation has been laid for the rapid development of the natural gas industry with continuously increasing new reserves. In 2022, China increased its newly discovered geological reserves of natural gas by 10 895×108 m3 [2]. Among them, conventional gas (including tight gas), shale gas, and coalbed methane (coal rock gas) had newly discovered geological reserves of 8 633×108, 2 131×108, 131×108 m3.
During the 13th Five Year Plan period, significant progress had been made in theory and practice of natural gas exploration in China. Several large gas fields (areas) with a scale of 100 billion to trillions of cubic meters, including Anyue, Keshen and Bozhong 19-6, had been proved, with a cumulative increase in proven geological reserves of 5.21×10¹² m3 [15], and a 20% increase in natural gas resource exploration rate. The innovative formation of marine carbonate gas accumulation theory and exploration technology, and the theory of deep gas accumulation in the foreland thrust belt support the accumulated proven geological reserves of Anyue gas field of 1.47×10¹² m3, and the discovery of gas fields of two trillion cubic meters reserve in Kuqa, Tarim Basin. The offshore oil and gas exploration system in China has revealed the mechanism of rapid subsidence controlling large-scale gas generation in the late stage and the three elements co-controlling reservoir formation mechanism of deep metamorphic rock buried hills. It has innovatively formed a natural gas enrichment and accumulation model of overpressure dynamic sealing in the late-stage tectonic activity area, leading to the discovery of the first fully installed 100 billion cubic meter condensate gas field in the Bohai Bay Basin, Bozhong 19-6, with an additional confirmed geological reserve of 1 571×108 m3 of natural gas [16], which is of great significance to ensure the supply and sustainable development of clean energy.
China has achieved fruitful results in natural gas exploration, with new exploration technologies leading to new progress and new geological theories of oil and gas leading to new development. The exploration field has moved from shallow to deep ultra deep gas reservoirs. Deep marine carbonate rocks are an important area for natural gas exploration, and the South China Sea has the potential to form large gas fields.
2.2.2. Natural gas development achievements and progress
The development of natural gas mainly focuses on complex gas reservoirs such as deep abnormal high pressure and high sulfur, heterogeneous ancient carbonate rocks, and low-permeability tight sandstone gas. After years of exploration, innovative development technologies such as carbonate rock gas reservoirs and high sulfur gas reservoirs have been formed, accelerating the development of China's natural gas industry [5]. Currently, the natural gas industry of China is in a period of rapid development and production. The annual production of natural gas has increased by 10 billion cubic meters for six consecutive years, with a growth rate of 43% and an average annual growth rate of 9.4% [14]. In 2022, China's annual natural gas production is about 2 200×108 m3 with conventional gas being the main producer, accounting for nearly 59% of the total; Unconventional gas production continues to grow.
During the 13th Five Year Plan period, China made significant breakthroughs in natural gas development. The innovative development of marine carbonate natural gas development technology has provided important support for the growth of carbonate natural gas production scaling in the Tarim, Sichuan, and Ordos basins (Table 1 ). Breakthroughs have been made in safe and efficient development technology for complex natural gas reservoirs, supporting technologies such as stable production technology and sulfur deposition prevention and control technology for high sulfur gas fields, as well as key equipment and instruments have been developed, which promoted the development of China's first large-scale high sulfur Puguang gas field. This has also extended the stable production period of Yuanba Gas Field from 6 years to 9 years, ensuring stable gas supply for the “Sichuan East Gas Transmission” project. Significant breakthroughs have been made in the equipment and technology of marine deep water engineering, with the development of a 3 000 m deepwater semi-submersible drilling platform, a lifting and laying vessel, and a support vessel. This has overcome technical difficulties in the design and installation of underwater production systems in deepwater areas, and achieved the successful development of the Liwan gas field group in deepwater, supporting the production of “Deep-sea No. 1” ultra-deep water gas field [13,17 -18]. The innovative breakthroughs in the development technology series have provided important technical support for doubling China's natural gas production. The updating and development of natural gas technology has brought continuous improvement in recovery rates, with conventional natural gas recovery rates ranging from 65.0% to 78.9%.
Table 1. Natural gas production in major basins/regions of China |
| Basin/ Region | Natural gas production/108 m3 | |||||
|---|---|---|---|---|---|---|
| 2017 | 2018 | 2019 | 2020 | 2021 | 2022 | |
| Sichuan | 301.88 | 319.91 | 332.72 | 340.26 | 376.73 | 396.48 |
| Ordos | 438.33 | 467.11 | 510.70 | 557.34 | 593.95 | 631.72 |
| Tarim | 269.27 | 283.62 | 303.54 | 330.12 | 341.56 | 355.70 |
| Songliao | 58.17 | 61.42 | 62.66 | 63.55 | 68.94 | 73.31 |
| Jungar | 28.40 | 29.19 | 29.32 | 30.03 | 34.86 | 38.47 |
| Sea area | 137.33 | 153.19 | 159.51 | 183.34 | 197.05 | 218.27 |
Note: Including dissolved gas, data obtained from natural gas production statistics of various basins over the years |
Great potential is estimated for the development of conventional gas based mainly on deep to ultra deep carbonate rocks. In the future, China will actively promote the construction of a natural gas production base with an annual output of 1 000×108 m3 in the Sichuan Basin, and build a “natural gas Daqing”. It is predicted that China's natural gas production will reach (2 800-3 000)×108 m3 by 2035 [12,17].
2.2.3. Leapfrog development of unconventional gas
In recent years, unconventional geological theories have made breakthroughs in exploration and development in unconventional fields, achieving a great progress in unconventional gas development. The unconventional natural gas industry in China has formed an important strategic pattern and is the successor and main force of China's natural gas storage and production strategy. Shale gas has made significant breakthroughs, tight gas has developed rapidly, and coalbed methane (coal rock gas) has made significant progress. Shallow, medium, and low rank coalbed methane mainly contains adsorbed gas with water, while deep, medium, and high rank coal rock gas basically do not contain water, while free gas exists (Fig. 4 ). In 2022, the national unconventional gas production was 912×108 m3, accounting for approximately 41% of the total natural gas production. Among them, tight gas was 576×108 m3, shale gas was 240×108 m3, and coalbed methane (coal rock gas) was 96×108 m3 [2].
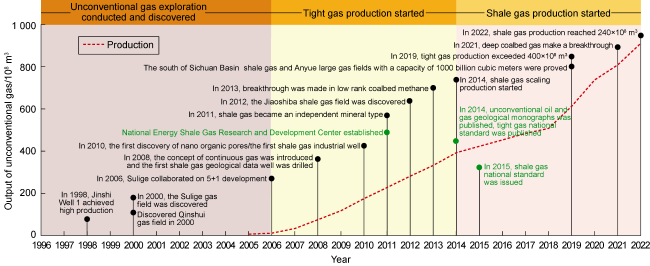
Fig. 4. Important events in the development of unconventional natural gas in China (modified according to Reference [19]). |
During the 13th Five Year Plan period, the unconventional natural gas exploration and development of China achieved a series of landmark results with significant technological breakthroughs (Table 2 ). Major technologies and equipment for the exploration and development of tight gas and shale gas have achieved innovative development, forming key core technologies and equipment such as identification and prediction of enrichment zones and sweet spots, effective development and improvement of oil recovery, drilling and completion processes for long horizontal wells, reservoir volume transformation, and fracturing. Innovating the theoretical understanding of the “cluster type” enrichment law of large-scale tight sandstone gas, it has revealed the accumulation laws of tight gas in key basins, with a cumulative proven geological reserve of nearly 6×10¹² m3 of tight gas. Low-permeability tight natural gas development theory and key technologies for effective development, breakthrough was made in the bottleneck of large-scale development such as horizontal well bridge plug segmented multi-cluster fracturing, and supporting Sulige to build the largest production scale gas field in China. In 2022, the production exceeded 300×108 m3 [20].
Table 2. Achievements in unconventional natural gas exploration and development technologies |
| Technology Innovations Field | Core technologies | Results |
|---|---|---|
| Tigh gas exploration and development technologies | Sweet spots identification and estimation technology | (1) Revealing the laws of tight gas accumulation in three key basins; (2) Consolidate resource potential and support the achievement of reserve targets; (3) Continuously increasing production and long-term stable production in developed areas |
| Reservoir thorough description and geological modeling technology | ||
| Technology for efficient development and improving recovery rate | ||
| Process and technology for efficient recovery and production increase | ||
| Shale gas exploration and development technologies | Accumulation spot and sweet spot estimation technology | (1) To achieve breakthroughs in exploration in new fields; (2) Innovative shale gas development theory and technical equipment; (3) Supporting the commercial development of shale gas |
| Long section horizontal well drilling and completion technology | ||
| Reservoir volume transformation and fracturing equipment technology | ||
| Industrial operation technology for shale gas under complex mountainous conditions | ||
| Environmental assessment and protection technology for mining | ||
| Coalbed methane (coal rock gas) low cost exploration and development technologies | Comprehensive geological evaluation and favorable area prediction technology | (1) Strong support for the overall development of eastern Ordos Basin and the demonstration project of "three gas combined production"; (2) Achieve industrial production for the first time in the brown coal area; (3) Breaking through the bottleneck of fracturing technology for coal seams with a depth of over 2000 meters; (4) Opening up a new field of exploration for low rank coalbed methane (coal rock gas) with a scale of trillions of cubic meters |
| Seismic logging acquisition, fine processing, and interpretation evaluation technology | ||
| Multi branch horizontal well technology | ||
| Drilling Engineering Technology | ||
| Long section horizontal well drilling and completion technology | ||
| Reservoir volume transformation and fracturing equipment technology |
Innovatively forming the “three controls” shale gas enrichment theory of “sedimentary rock controlling storage, preservation condition controlling storage, and high-quality reservoir controlling production”, the newly discovered shale gas reserves established the resource foundation, supported the achievement of reserve targets, sustained production in developed areas, and long-term stable production [18], and achieved breakthroughs in shale gas exploration in new fields. As of the end of 2022, the cumulative proven geological reserves of shale gas in China amounted to 2.89×10¹² m3. Eight gas fields have been discovered in Fuling, Weiyuan, Changning, Zhaotong, Luzhou, Weirong, Yongchuan, and Qijiang. Three national industrial demonstration zones have been established in Fuling, Changning Weiyuan, and Zhaotong, with an annual shale gas production of 240×108 m3. China has become the third country in the world to achieve large- scale shale gas development [15,21].
Establishing a theoretical understanding of the “multi- source accumulation” of mid to low rank coalbed methane (coal rock gas), and the “homologous superposition” of mid to deep coalbed methane (coal rock gas) and coal gas in three-dimensional reservoirs, the cumulative proven geological reserves of coalbed methane (coal rock gas) amounted to 8 145.4×10⁸ m3 [5,17], and the production in 2022 was 96×108 m3. Breakthrough was made in formation of major low-cost exploration technologies, innovatively and efficiently developing major technologies, and building a coalbed methane (coal rock gas) industry base in the southern part of the Qinshui Basin and the eastern edge of the Ordos Basin of national class. Promoted the expansion of development from shallow to deep layers, and constructed 7 coalbed methane (coal rock gas) demonstration projects in Qinshui Basin and Ordos Basin [22-23].
With exploration and development extending to more complex and hidden reservoirs, from tight to ultra tight unconventional areas, it is urgent to further promote breakthroughs in core and key technologies for unconventional natural gas and achieve sustained and high- speed development of unconventional natural gas. The proportion of unconventional gas production in China is expected to exceed 50% by 2030, and the unconventional natural gas industry has great potential to promote green and low-carbon energy strategy transformation in China.
3. Status and challenges faced by natural gas under the target of carbon neutrality
Under the goal of carbon neutrality, the prerequisite for low-carbon energy transformation is supply security. Diversified and multi-channel energy supply is an effective way to ensure security. Natural gas is a clean and low-carbon fossil energy source that plays an important role in environmental protection, climate change, and green and low-carbon transformation. It is the best partner for new energy symbiosis and prosperity [24-25]. In the process of carbon neutrality, accelerating the development of the natural gas industry is imperative.
Currently, the international political environment is complex and ever-changing, and domestic economic development is embarking on a new journey. The development of the natural gas industry has entered a new stage. On the one hand, energy supply security is facing challenges, resource degradation is becoming increasingly severe, mining difficulties are increasing, production costs are rising, and other issues are becoming more prominent; On the other hand, the construction of an energy powerhouse has put forward new requirements for the high-quality development of natural gas. It is necessary to accelerate the promotion of replacing coal with gas, expand utilization methods, coordinate the development of “gas electricity peak shaving” and energy storage, establish a “wind solar gas electricity” multi energy model, and create a new energy system that combines resilience and sustainability for development.
3.1. Importance of natural gas
Currently and in the future, China has entered a stage of energy development where both incremental and stock substitution coexists. Natural gas shoulders the dual mission of safe supply and green low-carbon. Unlike coal and oil, natural gas is the only low-carbon energy source among fossil fuels due to its safe utilization, high combustion heat value, and low carbon emissions. The heat value each cubic meter of natural gas combustion is equivalent to 10 KW•h and heat of combustion value of 1.25 kg of standard coal. Under equal heating conditions, the emissions of carbon dioxide, nitrogen oxides, sulfur dioxide, and dust from burning natural gas are 50% to 60%, 10%, 1/682, and 1/1 479 of coal, and 70% to 75%, 20%, 1/389, and 1/140 of petroleum, respectively (Fig. 5 ).
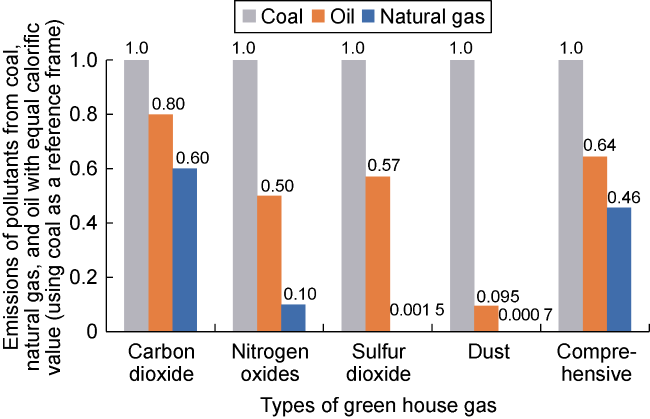
Fig. 5. Comparison of greenhouse gas emissions from fossil fuels (modified according to Reference [17]). |
Vigorously developing natural gas is an inevitable choice for creating a clean, low-carbon, intelligent, efficient, and economically secure energy system. With the third energy transformation, the structure of energy production and consumption will evolve from the “one big and three small” (coal is dominated, followed by petroleum, natural gas and new energy) to the “three small and one big” (new energy is dominated, followed by coal, petroleum and natural gas). The special role of natural gas in ensuring energy security is still irreplaceable [1]. Natural gas is not only the “ballast stone” to ensure energy security, but also the “stabilizer” for the integration and development of new energy. It plays a key supporting role as a “regulator” in the new energy system. It is predicted that by 2060, the natural gas consumption of China will continue to maintain around (4 000-4 500)×108 m3 [26]. In the process of carbon neutrality, the proportion of natural gas consumption in fossil energy will continue to increase, gradually becoming the "protagonist" of fossil energy (Fig. 6 ).
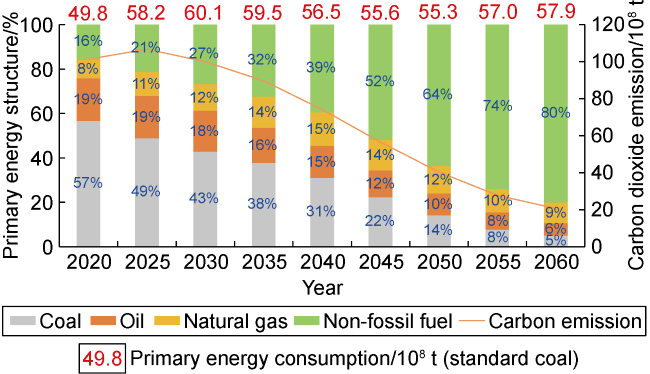
Fig. 6. Positive scenario energy demand and structure, as well as carbon emission prediction (modified according to Reference [26]). |
In the era of carbon neutrality, the expansion of the new energy consumption market is an inevitable trend, but due to technological limitations, the development of new energy in China still takes time. As a transitional fuel for the development of fossil fuels to new energy, natural gas is the key to achieving the transformation of energy consumption structure, and the carbon neutrality process provides an important window for the rapid development of natural gas. Natural gas, with its high efficiency, flexibility, and convenience, can complement and integrate with new energy sources, providing important support and supplementation for its efficient utilization [27⇓⇓-30]. The low-carbon energy transformation strategy brings important opportunities for the development of gas and electricity. Natural gas power generation has strong peak shaving ability, fast peak shaving speed, and is clean and low-carbon. It is an ideal flexible power source that can complement the advantages of new energy sources such as wind power and photovoltaics. It is the best peak shaving choice and important support under the new power system. The integration of natural gas and hydrogen has broad prospects, with over 50% of global hydrogen coming from natural gas for hydrogen production. The two have similarities in storage, transportation, and utilization, and can be mixed and used, complementing and transforming each other. By leveraging the existing infrastructure advantages of the natural gas industry and deeply integrating hydrogen energy with the natural gas industry, new development and application models will emerge [28⇓⇓⇓-32].
3.2. The main challenges faced by the natural gas industry
In recent years, the global energy landscape has accelerated its adjustment, and market fluctuations have significantly intensified. The Russia-Ukraine conflict and other geopolitical struggles, the ferment of anti- globalization thoughts, and the weak recovery of the global economy have affected the smooth operation of the energy market. All countries face the issue of energy bottom line security together, and pay more attention to the safety of the industrial chain. The development of natural gas in China is facing the risks and challenges of increasing external environmental uncertainty. Establishing and improving risk prevention and protection mechanisms, and continuously promoting the smooth operation of the natural gas industry chain are new tests under the new situation [27].
At present, the geological and geomorphological conditions for natural gas exploration and development are becoming increasingly complex, and the trend of resource quality deterioration is constantly increasing. Inferior proven reserves will become the norm [28-29]. The remaining natural gas resources in China account for over 80% of low permeability, deep water, deep water, and high sulfur gas fields. The scale of newly discovered gas field reserves is decreasing, and the difficulty of rapidly increasing storage and production is increasing. The exploration targets are mainly deep high-pressure, high steep structures, and strongly heterogeneous carbonate gas reservoirs. The difficulty of discovering high-quality reserves on a large scale has increased, and the major replacement areas in some exploration areas are unclear, with insufficient theoretical and technical reserves. The development targets mainly include complex gas reservoirs such as deep high-pressure, heterogeneous carbonate rocks, low-permeability and tight sandstone gas, shale gas, etc. Efficient and low-cost development faces challenges, and there is insufficient momentum for rapid production increase; the proportion of production in old gas fields is gradually increasing, and it is expected that the proportion will exceed 60% by the end of the 14th Five Year Plan. The difficulty of stabilizing production is high, and there are theoretical and technical challenges in improving recovery rates. Insufficient original innovation capabilities in engineering technology and equipment pose challenges and risks in breaking through bottleneck technologies and filling equipment gaps [33-34].
The growth rate of the natural gas production in China is lower than that of consumption, and the supply-demand gap has increased. The external dependence of natural gas has risen from 14.2% in 2010 to 40.5% in 2022 (Fig. 7 ). The long-term high proportion of dependence on imports in the domestic market will not change, and natural gas still faces significant pressure in energy security. The continuous increase in external dependence, which affects national energy security, may lead to risks and emergencies such as rising natural gas import prices, reduced or interrupted gas sources, and involvement in LNG gas source competition.
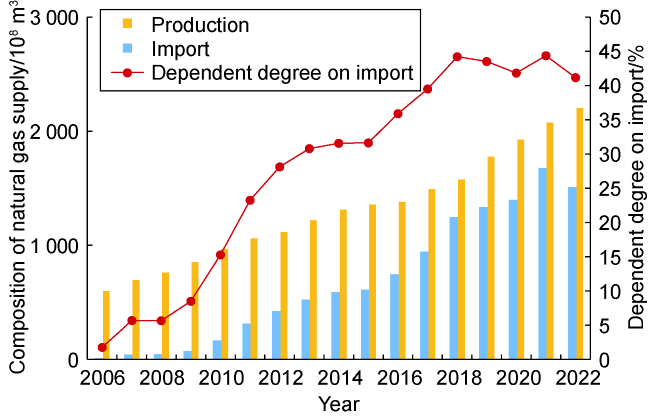
Fig. 7. The development situation of China's natural gas supply structure. |
4. Development strategies for natural gas under the goal of carbon neutrality
Under the leadership of an industrial development system focusing on strategic layout, technological innovation, and optimized allocation, the United States achieved energy self-sufficiency through the shale revolution, achieved energy independence, and reshaped the world's energy landscape. Based on the successful experience of the US shale revolution, under the goal of carbon neutrality, in order to achieve high-quality and large-scale development of China’s natural gas industry, respond to global climate change, accelerate energy green transformation, promote the “natural gas revolution”, and create a “clean, safe, efficient, and sustainable” new energy system in China, it is necessary to build a natural gas industry with Chinese characteristics. Through the innovation driven development strategy, integrating the industrial chain and innovation chain for coordinated development, policy guarantees to build a new development pattern, upgrading resource allocation to empower the optimization of supply and demand structure, and promoting the formation of a complete natural gas production, supply, storage, and sales system. Aiming at the current situation and future trends of the natural gas industry of China, propose development strategies of “coordinated layout, technological innovation; multi energy complementarity and diversified integration; flexibility, efficiency, optimization and upgrading”.
The strategy of overall planning and technological innovation require increased efforts in natural gas exploration and development, overcoming key theoretical and engineering bottleneck problems, and continuing to support the growth of reserves and production. The strategy of multi-energy complementarity and diversified integration is to promote the disruptive technological development of natural gas, make breakthroughs in new technologies, integrate new energy, and form a new format for the development of the natural gas industry. The strategy of flexibility and efficiency, optimization and upgrading focuses on establishing a “national network” to enhance the construction of pipeline facilities, continuously expanding LNG allocation, accelerating the construction of underground gas storage facilities, and establishing a natural gas reserve system. At the same time, emphasis will also be put on optimizing the structure of natural gas consumption, increasing the proportion of natural gas consumption, assisting in the transformation and upgrading of energy consumption, achieving low-carbon resource utilization, and clean energy consumption.
4.1. Stepping up efforts in natural gas exploration and development
The 2022 Government Work Report of China requires [35] to “enhance the domestic resource production guarantee capacity, accelerate the exploration and development of resources such as oil, gas, and minerals”, which shows that China is putting much emphasis on oil and gas security. “Deepening the energy revolution” and “increasing the exploration and development of oil and gas resources, as well as increasing storage and production” are new deployments and requirements at the national level to enhance strategic guaranteed capabilities of resource supply [36]. By focusing on the needs of national energy development, China is aiming at ensuring energy security supply and increasing exploration and develop-ment efforts. By focusing on increasing storage and production, it is expected to further improve natural gas reserves and production, and to promote high-quality development of natural gas.
At present, China has built four major natural gas production bases in Ordos Basin, Tarim Basin, Sichuan Basin, and the sea area. The development of conventional natural gas has been steadily increasing, while development of unconventional natural gas has been increasing rapidly. Up to now, unconventional natural gas accounts for 40% of the total natural gas production, becoming the main force for increasing storage and production, with new production capacity mainly resulting in dense gas and shale gas. The natural gas exploration of China is generally in the early and middle stages, and there is still a possibility of discovering large gas fields in the future. At present, the overall storage and production ratio of developed gas fields is relatively high, with conventional gas and unconventional gas storage and production ratios greater than 40 and 45 respectively, indicating a high potential for upward production [36-37].
4.1.1. Strategic layout supports exploration and development
The exploration and development of natural gas is shifting from conventional natural gas to both conventional and unconventional natural gas, expanding from shallow onshore to deep and ultra deep reservoirs, and from shallow offshore to deep offshore. Based on the domestic energy development situation, it is necessary to continuously and vigorously enhance the exploration and development efforts in existing gas fields to ensure supply security. According to the strategy of expanding existing gas fields, developing potential gas fields, and making breakthroughs in future new gas fields, the strategic layout supports exploration and development.
Focusing on the strategy of expanding existing gas fields and increasing exploration and development in key basins, so as to promote rolling exploration and development in natural gas areas, and support the acceleration of natural gas production, key efforts will be made to promote exploration and development in the Ordos, Tarim, and Sichuan basins, and to accelerate the production of natural gas. Efforts will also be made to accelerate the construction of important natural gas production projects such as Surige, Bozi Dabei, Changning Weiyuan, and Jiaoshiba, and actively promote the continuous and steady increase in conventional and unconventional gas production. In addition, emphasis should be put on intensifying the exploration and development of natural gas in the sea area, strengthening efforts in the Bohai Sea, expanding to the South China Sea, and accelerating the development of the East China Sea, increasing offshore natural gas reserves and production [31,38], and striving to achieve stable and rising natural gas production.
Efforts should be made to develop potential gas areas and accelerate the exploration, evaluation, and development of Junggar, Bohai Bay, and Songliao Basin. Focuses should be put on promoting the new development of exploration in the southern margin of the the Junggar Basin and the lower slope of the hinterland, and open a new prospect of natural gas exploration in the basin. To layout key areas in the Bohai Bay Basin, vigorously implement natural gas exploration and development projects in the Bohai Bay Basin, and to discover favorable exploration targets for natural gas in the Bozhong Depression, and to steadily carry out the production and construction of deep and complex buried hill oil and gas reservoirs, and step into a leapfrog development stage of deep-sea natural gas. Deepen the deployment of natural gas exploration in the Songliao Basin, strengthen the study of deep gas reservoir formation laws, target mid to deep volcanic rocks and tight sandstone gas reservoirs, and expand the new development of natural gas areas in faulted basins.
To make breakthroughs in future new gas areas, continuously increasing exploration and development of conventional, deep-sea, deep and unconventional natural gas, aiming at breakthroughs in new strata and fields. The tight gas, shale gas, and coalbed methane (coal rock gas) in China are all in the early and middle stages of exploration, striving for stable production of mid to deep shale gas, accelerating the production of deep shale gas, promoting exploration of new strata, and achieving significant breakthroughs in the exploration and development of deep coalbed methane (coal rock gas). In the future, deep marine carbonate rocks will be an important field for natural gas exploration. There is potential to discover large gas fields in South China Sea, and the deep coalbed methane (coal rock gas) in the Ordos Basin will achieve efficient storage and production increase, as well as commercial development.
4.1.2. Technological breakthroughs promote increased storage and production
China has made significant breakthroughs in natural gas exploration and development technology, but there is still a gap in key and core areas and efficiency costs compared to the leading international levels. Efforts need to be made to accelerate the research and development of key cutting-edge core technologies and equipment for natural gas, deepen the implementation of strong and complementary chain projects, break through the exploration "forbidden zone", improve development efficiency, promote the development and application of new technologies in upstream natural gas exploration and development, infrastructure construction, energy conservation and efficient utilization, and provide scientific and technological support for increasing natural gas storage and production [17,38].
We should focus on unconventional natural gas development in key areas such as onshore deep to ultra deep, deep water, and old areas. There is an urgent need to overcome a number of obstacles in major theories, technologies, and equipment to promote China's natural gas storage and production increase. We should also strengthen research on “gas exploration” theory and technology, deepen the understanding of deep to ultra deep natural gas hydrocarbon generation, storage, and reservoir formation mechanisms, strengthen research on complex surface exploration technology, innovate logging evaluation techniques for carbonate rocks, volcanic rocks, and unconventional oil and gas reservoirs, and solve the difficulties in evaluating and identifying special gas reservoirs and complex reservoirs; Finally, to develop new exploration technologies for conventional sandstone gas, deep marine carbonate gas, unconventional tight sandstone gas, and shale gas, deepening exploration in areas such as foreland thrust zones, lithology and stratigraphy, new areas, and deep water, accelerating resource exploration, strengthening reserve continuity, and continuously discovering a batch of atmospheric fields, providing support for the sustainable development of the natural gas industry of China [12,39 -40]. Strengthen the research on “gas production” theory and technology, develop the theory and technology of extreme development of old gas fields, and the technology of balanced development of natural gas reservoirs throughout their entire life cycle; Innovate economic and efficient development technologies for unconventional natural gas such as tight gas, shale gas, and coalbed methane (coal rock gas), break through the bottleneck of scale efficiency development technology for tight sandstone gas and marine deep shale gas, promote the commercial development of marine land transitional and terrestrial shale gas, break through the technological constraints of coalbed methane (coal rock gas) development, and achieve effective utilization of unconventional gas resources [5,21,41].
Consolidate production of conventional gas, stabilize production of tight gas, expand shale gas, expand coalbed methane (coal rock gas), and promote the continuous and steady increase in natural gas production. It is expected that natural gas production will reach (2 800-3 000)×108 m3 by 2035, with steady growth thereafter. China is currently the fourth largest natural gas producer in the world. Based on ensuring domestic supply security, we will further strengthen technological research, establish and improve a multi-level scientific and technological innovation system, strengthen the main role of low-carbon and clean natural gas energy, promote sustained production growth, and accelerate the construction of a “natural gas power”.
4.2. Promoting the disruptive technological breakthroughs of natural gas
The strategy is to realize the goal through macro industrial policy support and sound mechanism guarantee. In 2023, the National Energy Administration released the Action Plan for Accelerating the Integration of Oil and Gas Exploration and Development with New Energy Development (2023-2025) [42], which aims to increase and stabilize natural gas production, promote green and low-carbon development, promote technological innovation and research in coordinated development with new energy, and form a new development pattern of diversified integration and multi-energy complementarity between natural gas and new energy industries.
China has entered a new era in natural gas industry and will become the protagonist of fossil energy in the future. The entire industry chain of natural gas including upstream, midstream, and downstream is facing a new situation. Currently, the demand for ecological civilization construction in China is growing strongly [43]. Through disruptive technological breakthroughs in natural gas, we aim to achieve low-carbon and emission reduction extraction, promote the integration of natural gas business with new energy, new materials, and new business formats, and play a dual role as a stabilizer and regulator. “Multi-energy complementarity and diversified integration” can promote the disruptive technological development of natural gas, achieving the dual goals of economic development and environmental protection, and making greater contributions to ensuring national energy security [27].
4.2.1. Making breakthroughs in in-situ heating technology for underground shale
China will need to assist in achieving carbon neutrality, innovate and make breakthrough in the development of new technologies for natural gas development, increase scientific and technological breakthroughs in the “continental underground shale revolution”, and create a natural gas industry with coordinated development of multiple industries and of Chinese characteristics. Shale gas development has reached the technological limit of physical mining with horizontal well heating conversion as a revolutionary and disruptive technology. The in-situ heating and upgrading technology for medium and low mature shale oil underground can transform it into petroleum and artificial natural gas through artificial heating (350 °C). Multiple types of organic matter in the strata including residues such as coke (also known as "underground refineries") left underground, are converting to oil and gas. This technology enables in-situ fracturing of Kerogen, which can produce natural gas; At the same time, heating generates microcracks, increases fluid transport channels, driving forces, and efficient drainage systems, resulting in recovery rates of up to 60% to 70% [44]. Preliminary estimates indicate that the in-situ conversion technology of natural gas from medium to low maturity shale oil in China can produce approximately 65×1012 m3 of resources. The core experiment of the Ordos Basin was conducted, and the simulation experiment results revealed (Table 3 ) that the in-situ conversion technology of the super basin can extract approximately 30×1012 m3 of natural gas resources.
Table 3. Experimental results of shale cores from the 7th member of the Triassic Yanchang Formation in the Ordos Basin |
| Core Samples | TOC/ % | Ro/ % | Gas output/m3 | Oil gas equivalent/kg |
|---|---|---|---|---|
| Lizheng 38 (simulation) | 23.7 | 0.82 | 22.5 | 54 |
| Lizheng 38 (modified) | 22.5 | 65 | ||
| HJF (outcrop) | 24.7 | 0.51 | 26.0 | 73 |
Note: Production is calculated per ton of rock sample |
The in-situ transformation of natural gas from medium to low maturity shale oil underground is still at the basic research and experimental stage. With the expansion of China's exploration and development of natural gas from conventional to unconventional, this will be the most anticipated strategic continuation resource on land in China. “Chemical conversion within the source” will be the breakthrough point of the next round of shale revolution, making breakthroughs in the development of traditional physical development theories, constructing a “chemical conversion within the source” technology system, focusing on key processes and equipment, improving overall technological maturity and economic efficiency, and achieving a new technological revolution in natural gas production.
4.2.2. Making breakthroughs in in-situ heating technology for underground coal converting to oil and gas
In response to the abundant coal and insufficient oil and gas resources of China, utilizing idle underground coal resources to produce natural gas, hydrogen, etc. is of great strategic significance for the development of China's natural gas industry. In-situ heating technology for underground coal converting to oil and gas is a process of producing petroleum, methane (37%), hydrogen (15%) and other oil and gas through the thermal and chemical action of coal through the controlled burning of coal in-situ underground by creating appropriate engineering and technical conditions. Transforming physical coal mining into chemical oil & gas mining can effectively alleviate the conflict between “abundant coal” and “insufficient gas” resources [45-46].
The geological resources of underground coal gasification in China are (280-330)×1012 m3, which is three times the amount of conventional natural gas resources and is basically equivalent to the total amount of unconventional natural gas resources. The development potential is enormous, with available resources of 13×1012 m3 and 30×1012 m3 in basins such as Ordos and Tuha. The surface combustion of 1 ton of raw coal emits approximately 3.3 t of CO2, while underground coal gasification only emits 1.16 t of CO2, directly reducing emissions by 64.8% [47-48].
China needs to focus on new areas of natural gas development, including laying out situ heating technology for underground coal converting to oil and gas, utilizing the advantages of coordinated development of multiple resources, and achieving three-dimensional comprehensive development and utilization of resources. Aiming at developing the comprehensive energy industry of “coal oil gas new energy (hydrogen, methanol) coal gasification CO2 burial”, we endeavor to create an "underground coal converting to oil and gas" industrial cluster and achieve a highly integrated development of underground coal gasification and the oil and gas industry [49]. In the near to medium term, we will carry out the construction of the “in-situ heating technology for underground coal converting to oil and gas-CO2 oil displacement thermal recovery crude oil/modified shale oil-CO2 storage” four fusion comprehensive mining demonstration zone. During the medium to long term, we will carry out the demonstration and promotion of the four fusion comprehensive utilization of “methane hydrogen energy power generation coal chemical industry” on the ground. Gradually, we will build an underground and ground surface coordinated development industrial base, which is expected to achieve a scale of 100 billion cubic meters of natural gas production.
The energy density, gas production speed, and production efficiency of underground coal converting to oil and gas are far higher than those of unconventional gas currently developed. It has two major advantages: direct emission reduction and alternative emission reduction, which is more environmentally friendly and economical. The related key technologies have made breakthroughs. Mature oil and gas exploration and development technologies and complete engineering, ground, and market supporting advantages can be utilized to achieve clean development and utilization of coal resources and leapfrog growth in natural gas production. Building a coordinated development model for the natural gas industry chain, refining, energy substitution in mining areas, gas storage facilities, CCUS (carbon capture, utilization, and storage), and hydrogen energy industry chain according to local conditions, while promoting the horizontal expansion of fossil energy enterprises into emerging businesses and the deepening of traditional energy technologies towards green and low-carbon technologies. This will help realize the “natural gas revolution” and contribute to opening up new paths for building a “clean, safe, efficient, and sustainable” New Energy System of China.
4.2.3. Making breakthroughs in technology of increasing gas recovery rate with CO2
In recent years, during the research and development of natural gas extraction technologies, it has been found that CO2 has strong methane desorption and adsorption capabilities. Combining carbon utilization technologies such as carbon dioxide utilization and storage, we have accelerated the development of new technologies for CO2 extraction and gas enhancement, significantly improving natural gas recovery rates, and actively exploring and promoting the near zero emissions of natural gas “centralized utilization + CCUS”.
The utilization of CO2 extraction and gas enhancement technology includes coalbed methane (coal rock gas) extraction (CO2-ECBM) and shale gas extraction (CO2-EGR). Due to the fact that the adsorption capacity of coal and shale for CO2 is 2 times and 4-10 times that of CH4, respectively, injecting CO2 into the coal seam or shale layer can supplement the formation pressure of the depleted gas reservoir, expand the volume of the fracture network, construct a seepage channel, and replace CH4 to improve the recovery rate of coalbed methane (coal rock gas) and shale gas, as well as carbon storage in underground coal seams and shale layers. A field experiment was conducted on CO2 enhanced extraction of coalbed methane (coal rock gas) in the Qinshui Basin, using intermittent injection method. Liquid CO2 was injected 15-18 t per day for 13 consecutive days, with a cumulative injection of 192.8 t. Average gas production before injection is 490 m3/d. After injection, the average production is 1 186 m3/d, more than double the amount of gas.
About 74% of the developed gas fields in China are complex gas reservoirs, making it difficult to improve oil recovery. Conventional drainage and gas recovery techniques typically increase oil recovery by 1% to 3%, and "gas driven" is expected to significantly improve oil recovery. Under the background of carbon neutrality, conducting theoretical and technical research on the application of natural gas + CCUS/CCS (carbon capture and storage) is of great significance for clarifying the carbon neutrality implementation path of the natural gas industry of China, promoting the application of CCUS-EGR, and developing the carbon industry.
4.2.4. Integrated development of natural gas and new energy
In 2022, China's fossil energy consumption accounted for over 80%. It is predicted that by 2060, the proportion of new energy consumption will reach 80% (Fig. 8 ). In the process of carbon neutrality, energy consumption will undergo a qualitative and quantitative change from “one large and three small” (mainly carbon-based energy) to “three small and one large” (mainly zero carbon energy). In the continuous adjustment of China's energy structure, the coordinated development of fossil energy and new energy will be the main scenario for energy supply and demand, with multi energy synergy and complementarity. Natural gas is the best partner for the transition from traditional fossil fuels to new energy, and its efficient and flexible characteristics can compensate for the shortcomings of other new energy sources. Promoting the integration of natural gas and new energy is an inevitable choice for the national energy strategy so as to accelerate the integration of natural gas and new energy, promote intelligent and green coordinated development, and build a new development pattern of “diversity, complementarity, innovation, and integration” between natural gas and new energy under the new energy system [50⇓-52].
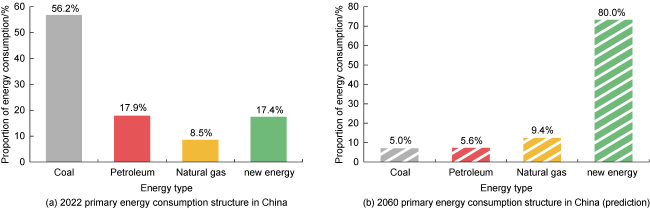
Fig. 8. Consumption structure of primary energy in China. |
Building a new type of power system with new energy as the core is the key to achieving carbon neutrality, and natural gas is the best choice for grid peak shaving under the new energy system. New energy generation has intermittent, random, and anti-peak characteristics. The flexibility of the existing power grid cannot support its large-scale grid connection. With a high proportion of new energy entering the power system, it is faced with huge challenges in stability. Natural gas power generation has advantages such as minute level start stop regulation speed, strong emergency response, small footprint, low unit investment, clean and low-carbon, etc. It can cater to seasonal peak shaving needs, compensate for the volatility of new energy power generation, and is the optimal peak shaving power source [43,53 -54]. The gas and electricity sector will become the core driving force for the growth of natural gas demand, promoting a steady decrease in carbon emissions. After the retirement of coal-fired power in key cities and regions, gas and electricity support are needed, and new energy requires gas and electricity as flexible power sources to drive rapid growth in natural gas consumption and assist in the green transformation of industrial structure and energy.
The natural gas and hydrogen energy industry chain has the prospect and advantages of deep integration development, playing an important role in promoting energy structure transformation and ensuring energy supply. The natural gas industry has inherent advantages in integrating with the hydrogen energy industry in three major links: upstream hydrogen production, midstream hydrogen transport, and downstream hydrogen consumption. In the upstream process, natural gas can be used as a raw material for hydrogen production, promoting on-site testing and industrial application of economic and efficient hydrogen production; In the midstream field, the hydrogen is mixed with natural gas and transported by pipeline. Pipeline hydrogen blending is the key to achieving long-distance and large-scale hydrogen transportation; In the downstream industry, utilizing the advantages of existing gas station networks, we will coordinate the renovation of existing stations and the construction of hydrogen refueling stations. Explore the development model of "four stations in one" for gas stations, gas stations, hydrogen refueling stations, and power stations, fully leveraging the advantages of hydrogen energy, natural gas, and other resource combinations and diverse complementarity [51,55]. In the process of energy transformation, natural gas and hydrogen are used as important carriers to connect traditional energy and new energy, build a low-carbon, profitable, collaborative and efficient energy interconnection network, and build a “natural gas + hydrogen energy” dual clean low-carbon energy system of “diversification, complementarity and integration” (Fig. 9 ). Based on the geographical location and resource allocation conditions of China, it is not suitable to blindly follow the European model. It is necessary to develop China's own “gas hydrogen model”: hydrogen production in the west, hydrogen utilization in the east, and “hydrogen transmission from west to east”. In the early stage, combining the advantages of natural gas pipelines and infrastructure, we will develop “gas hydrogen integration”. Forming a development model suitable for China's new energy system in the natural gas and hydrogen industries will help to utilize the advantages of natural gas infrastructure and consumption, as well as leverage the advantages of zero carbon efficiency and energy hub in hydrogen energy, promote high-quality development of the natural gas industry, and reduce the social and economic costs of energy transformation.
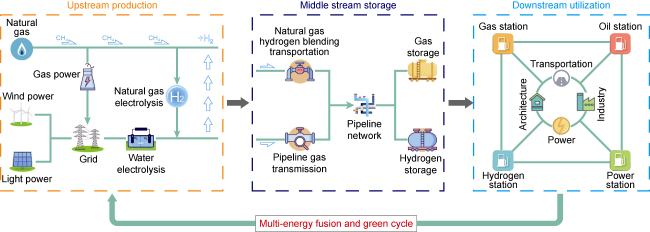
Fig. 9. Integrated development of natural gas and new energy diagram. |
The Action Plan for Accelerating the Integration of Oil and Gas Exploration and Development with New Energy Development (2023-2025) proposes to “reasonably layout natural gas peak shaving power stations in areas with abundant wind and solar resources on land, improve system regulation capacity [42]. To build a comprehensive energy model mainly based on the integration of wind power and natural gas power generation on the sea, and provide stable and reliable green electricity for offshore platforms”, further clarifying the promotion of coordinated development of oil, gas, and new energy, so as to realize industrial integration.
Guided by the goal of carbon neutrality, promoting the integrated development of natural gas and new energy is the core direction for the future. China needs to improve the mechanism design and supporting policies for promoting the integrated development of natural gas and new energy, expanding from “clean substitution” to “synergistic substitution for pollution reduction and carbon reduction, supporting the scale development of new energy”, highlighting the strengthening of the low-carbon and flexible advantages of the natural gas, and ultimately achieving “centralized utilization and deep carbon reduction”. The integrated development of natural gas and new energy can help balance the dual goals of energy cleanliness and energy security, effectively support the energy transformation of China, and is of great significance for building a “clean, safe, efficient, and low-carbon” energy system. It also plays an important role in promoting China's achievement of carbon neutrality goals.
4.3. Optimization and upgrading of natural gas supply and demand
In order to further deepen the reform of the natural gas market system and improve the construction of the production, supply, storage, and sales system, China has successively issued corresponding policy documents to support and encourage the innovative development of the natural gas industry, and continue to promote the transformation and upgrading of the natural gas supply and demand structure. Policies and regulations such as “Accelerating the Construction of a National Unified Market” and “14th Five Year Plan for a Modern Energy System” [2] aim to promote the interconnection of infrastructure such as natural gas pipelines and LNG receiving stations from various aspects such as planning layout, operation mode, and institutional mechanism, and accelerate the improvement of the “National One Network”; Highlighting economies of scale, promoting accelerated construction of gas storage facilities, orderly guiding natural gas consumption, optimizing utilization structure, ensuring people's livelihood gas utilization, and promoting efficient utilization of natural gas.
Building a safer, more efficient, and more flexible natural gas industry is an important way to support the clean and low-carbon strategy of China. Flexibility, efficiency, optimization and upgrading, expanding the supply, optimizing the demand, strengthening the natural gas industry chain, and driving new development of natural gas. It is necessary to ensure stable natural gas supply, establish and improve a unified deployment plan for the national pipeline network, expand LNG resource allocation, vigorously enhance natural gas reserve capacity, so as to build a safe and stable reserve system, and build a diversified supply pattern. China will need to optimize the structure of natural gas consumption, promote energy consumption upgrading, and improve the construction of natural gas production, supply, storage, and consumption system.
4.3.1. Increase pipeline gas and LNG layout
China started importing natural gas in 2006 and surpassed Japan in 2018 to become the world's largest importer. In 2022, it imported 1 508×108 m3 of natural gas, including 876×108 m3 of liquefied natural gas (LNG) and 632×108 m3 of pipeline gas. China has established a diversified natural gas trade system with pipeline gas and LNG as the main body, forming four major strategic channels for natural gas imports: the Northwest Central Asia Pipeline, the Southwest China Myanmar Pipeline, the Northeast China Russia Pipeline, and the East Sea Trade. Importing LNG across the ocean from more than 10 countries including Oceania, Africa, Europe, North America, and Asia plays an important role in ensuring natural gas supply. As of the end of 2022, the total length of China's natural gas pipelines is approximately 11.6×10⁴ km (including provincial and local pipelines of 4.69×10⁴ km), and the cross-border pipelines between China Myanmar, China Russia, and Central Asia, as well as the layout of coastal LNG receiving stations, are continuously improving [56-57].
It is also important to upgrade pipeline facilities, layout the national pipeline network, expand import channels, establish a collaborative, intelligent, and diversified pipeline network system, and ensure the safety of natural gas supply. With the continuous expansion of the natural gas industry, the continuous supporting construction of pipeline network facilities requires increased investment. On the one hand, in response to the characteristic differences in heating between the northern and southern regions of China, we need to continuously improve the peak gas supply capacity of facilities and resource coordination optimization, as well as enhance emergency response capabilities to extreme weather and emergencies, to ensure energy supply security. On the other hand, China will innovate natural gas pipeline gathering, long- distance transportation, and smart pipeline technology, continuously promote the interconnection and interoperability of domestic natural gas regional pipeline networks, achieve flexible allocation of natural gas between different pipeline facilities, improve the "national network", and build a "full network connectivity" pattern [27].
In addition, China needs to fully participate in imported pipeline gas transportation, closely monitor gas rich regions such as the Arctic, Middle East, and East Africa in Russia, and consolidate the foundation of overseas natural gas import resources from the source. Stabilizing the gas supply capacity of the four major import strategic channels abroad, continuously strengthening the exploration and development cooperation of natural gas resources among countries along the Northeast, Northwest, and Southwest natural gas pipelines (Table 4 ), accelerating the cooperation of the Central Asian D-line and the China Russia Middle Line pipelines, ensuring the supply of imported gas from foreign pipelines, and improving China's ability to guarantee imported gas resources are also important. Finally, we need to focus on continuously deepening the strategic layout and construction of pipeline gas. It is expected that by the end of the 14th Five Year Plan, China's natural gas pipelines will form a “four major (import) channels” and a “five vertical and five horizontal” trunk pipeline network pattern [36,58⇓ -60].
Table 4. Statistics of the imported natural gas pipelines of China |
| NG pipelines | Pipeline | Gas Source | Pipe length/ km | Designed transport capacity/ (108 m3·a-1) |
|---|---|---|---|---|
| Central Asia | Central Asia A Line Central Asia B Line | Turkmenistan Uzbekistan Kazakhstan | 1 833 | 300 |
| Central Asia C Line | 1 830 | 250 | ||
| Central Asia D Line | 1 000 | 300 (to be built) | ||
| China Myanmar | China Myanmar NG | Myanmar | 2 520 | 120 |
| China Russia | China Russia East Line | Central Russia | 3 000 | 380 |
In 2022, global gas prices skyrocketed, and China's imported natural gas was faced with risks such as being "overpriced," "unavailable," and "unable to be transported back". During the peak winter season, the self-sufficiency of resource countries was still limited, making it more difficult to purchase imported natural gas. Unilateral "unauthorized" reduction of agreed export volume and unauthorized "unauthorized" downloading through intermediate countries has led to a sharp decrease in natural gas supply to China, and there are uncertain factors and instability risks in LNG imports. In order to accelerate energy structure adjustment, ensure domestic energy supply, strengthen the scale construction of domestic coastal LNG receiving stations, highlight economies of scale, leverage the characteristics of LNG storage tanks that are suitable for storage, transportation, and flexible transportation, it is necessary to promote the pilot demonstration of multimodal transportation of LNG tanks, take multiple measures to improve gas storage capacity, and ensure stable supply of imported LNG gas.
By 2022, China had built 24 LNG receiving stations and 94 storage tanks, and is currently constructing, expanding, and planning 33 LNG receiving stations. As a major importer of LNG, it is necessary to further strengthen LNG strategic planning, continuously deepen the construction of LNG system structure, implement LNG expansion projects, and build an independent LNG transportation force that matches China's position. Strengthen the construction of four major LNG receiving bases around the Bohai Sea, Yangtze River Delta, Pearl River Delta, and Beibu Gulf; Enhance LNG unloading capacity and leverage its intensive storage and flexible peak shaving capabilities. By expanding the scale of international LNG sources, establishing a global resource pool, enhancing the ability to allocate LNG overseas resources, and promoting global procurement of LNG products. Actively expand the LNG import volume of the southern hemisphere, equatorial region and countries along the "the Belt and Road" to reduce the risk of significant supply reduction in winter heating period. It is estimated that the LNG import will exceed 1 500×108 m3 [11,61].
In the current and future, for the long-term period, China's pipeline gas construction and LNG industry should expand macro planning, deepen strategic layout, expand imported natural gas resources, improve domestic pipeline and LNG infrastructure construction, enhance gas supply capacity, form a diversified supply system, promote the upgrading of the natural gas supply chain, and ensure the stable development of the natural gas industry of China.
4.3.2. Strengthen the construction of gas storage facilities and reserve systems
In recent years, with the sustained and rapid growth of natural gas consumption in China, efforts have been made to increase the construction of natural gas reserve capacity, significantly improve the balance, allocation, and guarantee capabilities of natural gas, promote the improvement of the natural gas safety and supply system of China, and play an irreplaceable strategic emergency role in peak shaving and supply security.
Gas storage is an important infrastructure for ensuring the safe supply of natural gas and solving peak shaving problems. It plays four major roles: emergency supply, peak shaving gas supply, strategic reserves, and market finance. It is one of the key links in the natural gas industry chain. By 2022, 24 gas storage facilities (clusters) had been built nationwide, with a designed total storage capacity of 603×108 m3 and a designed total working gas volume of 274.6×10⁸ m3 (Table 5 ). The construction of China's gas storage capacity continues to accelerate, and in the future, it will form six major regional gas storage clusters around the Bohai Sea, Northeast China, Yangtze River Delta, Southwest China, Central China, and Central South China, providing safety guarantees for winter supply and natural gas consumption growth [62-63].
Table 5. General situation of national gas storage facilities in 2022 |
| Gas storage (group) | Area | Quantity | Capacity/108 m3 | Working capacity/108 m3 | Build peak shaving capacity/108 m3 |
|---|---|---|---|---|---|
| Huabei 1 | Hebei | 5 | 75 | 25 | 15.0 |
| Huabei 2 | 3 | 20 | 8 | 5.0 | |
| Zhongyuan 1 | Henan | 1 | 85 | 33 | 26.0 |
| Zhongyuan 2 | 1 | 10 | 5 | 3.0 | |
| Zhongyuan 3 | 1 | 7 | 2 | 2.0 | |
| Zhongyuan 4 | 1 | 5 | 2 | 1.0 | |
| Daqing | Heilongjiang | 2 | 5 | 3 | 2.0 |
| Ji-1 | Jilin | 1 | 11 | 6 | 1.0 |
| Ji -2 | 1 | 3 | 2 | 0.5 | |
| Sujin-1 | Jiangsu | 1 | 27 | 17 | 8.0 |
| Sujin -2 | 1 | 12 | 7 | 2.0 | |
| Sujin -3 | 1 | 10 | 6 | 2.0 | |
| Sujin -4 | 1 | 5 | 2 | 1.0 | |
| Liaohe1 | Liaoning | 1 | 60 | 35 | 25.0 |
| Liaohe 2 | 1 | 6 | 5 | 2.0 | |
| Chang 1 | Shanxi | 1 | 25 | 12 | 2.0 |
| Chang 2 | 1 | 10 | 4 | 4.0 | |
| Dagang-1 | Tianjin | 6 | 70 | 30 | 21.0 |
| Dagang -2 | 3 | 11 | 6 | 5.0 | |
| Dagang -3 | 1 | 7 | 3 | 0.5 | |
| Xintu | Xinjiang | 1 | 107 | 45 | 39.0 |
| Xibei | 1 | 8 | 2 | 1.0 | |
| Chuandong | Sichuan | 1 | 5 | 2 | 1.0 |
| Xinan | Chongqing | 1 | 45 | 25 | 25.0 |
Note: The name of gas storage (group) is code name; the data of the table is processed into approximate value or round number. |
In 2022, the peak shaving capacity of China's gas storage facilities amounted to 192×108 m3, accounting for approximately 5% of the consumption, far below the international 15% level. It is necessary to develop a theoretical and technical system for gas storage construction under complex geological conditions, accelerate the construction of underground gas storage facilities with a scale of 100 billion cubic meters, and enhance the natural gas peak shaving and emergency supply capacity. It is expected that by the end of the 14th Five Year Plan period, the natural gas reserves of China will double on the basis of 2021. In 2040, China's natural gas consumption is approximately 6 500×108 m3, and it is necessary to build gas storage facilities with a scale of billions of cubic meters in order to strengthen the energy security "bottom gas" and ensure the smooth operation of the natural gas supply and industry of China [64].
Accelerating the construction of natural gas storage facilities and further strengthening gas storage capacity is an important measure to ensure the safe and stable supply of natural gas and the stable development of the industry, which also provides strong guarantees for the sustained and healthy development of China's economy and society. The construction of gas storage facilities in China will follow the overall development pattern of “coordinated planning, step-by-step implementation, simultaneous development of government and enterprises, with peak shaving as the main focus and strategy as the auxiliary, gas reservoirs as the main focus and the rest as the auxiliary”. By continuously improving the design standards for gas storage and extraction capacity, and enhancing the coordination and supporting capabilities of storage and extraction, gasification, and export, we aim to achieve synchronous planning, simultaneous construction, and simultaneous production of facilities such as natural gas storage production transportation; Prioritize the construction of gas storage facilities in import channels, consumer hub centers, and other locations to meet market peak shaving needs. Enhance the linkage ability between underground gas storage facilities and LNG receiving stations, select LNG receiving stations with expansion capabilities in coastal areas, build LNG reserves, and use them as peak shaving gas sources; Enhance the synergy between gas storage construction and domestic gas production, strengthen peak shaving and emergency reserve capabilities [65-66].
In order to ensure national energy security, a graded national natural gas strategic reserve system should be established as soon as possible. It is suggested that China build a natural gas reserve system that combines strategic and commercial aspects, with national, regional, and enterprise level reserves as the main body. In addition, we need to enhance the scale of gas storage, with underground gas storage facilities as the main focus and coastal LNG storage tanks as auxiliary, and build a comprehensive above ground and underground storage system. Based on "large LNG stations" and "large gas storage facilities", we also need to promote the intensive layout of gas storage facilities, plan the construction of gas storage facilities [67], study and introduce corresponding laws and policies for natural gas reserve construction, and gradually open up the construction of reserve peak shaving facilities. Finally, we need to encourage various social capital and investment entities to jointly participate in the creation and operation of gas storage facilities, and advocate for joint ventures and cooperation among government agencies, urban enterprises, and central enterprises.
4.3.3. Strengthen the adjustment of natural gas consumption structure
The natural gas market of China is in a period of vigorous development, and China is continuously promoting the implementation of projects such as "coal to gas", and continuously promoting the low-carbon and clean transformation of China's energy consumption structure. According to the latest national statistical bulletin, in 2022, China's natural gas consumption was 3 663×108 m3, of which industrial fuel gas ranked first, accounting for 41.8%; Urban gas accounts for 32.7%; Electricity generation accounts for 17.5% of the total; Chemical industry accounting for 8.0% [9,56] (Fig. 10 ).
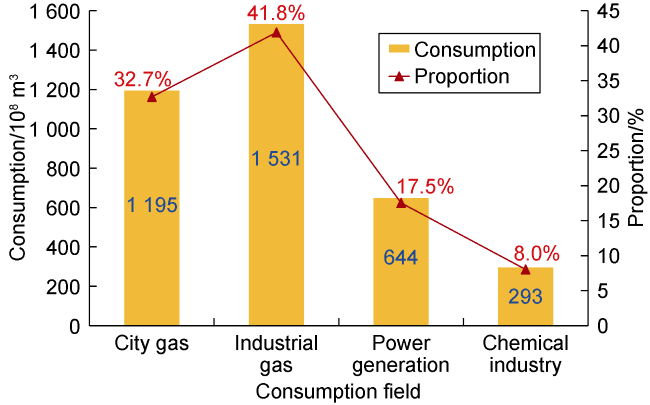
Fig. 10. Natural gas consumption structure of China in 2022. |
The world's natural gas consumption accounts for 24% of the total primary energy consumption, while China's natural gas consumption accounts for 8.4% of the total primary energy consumption [2]; The global per capita gas consumption is 493 m3/person, with 2 604 m3/person in the United States and only 270 m3/person in China. Compared to the world level, China's natural gas consumption ratio and per capita gas consumption are both at a relatively low level. The proportion of natural gas consumption in China's primary energy consumption is far lower than that of developed countries and regions such as the European Union and the United States. Drawing on the experience of energy transformation in Europe and America, increasing the proportion of natural gas consumption in China and reducing carbon dioxide emissions are currently the most realistic and feasible path.
By developing efficient natural gas utilization technologies, expanding the urban fuel gas market, expanding industrial fuel gas usage, and developing natural gas power generation projects, China aims to increase the proportion of natural gas in primary energy consumption, continuously optimize the natural gas consumption structure, and maximize the value of natural gas resource utilization [68-69]. China needs to vigorously develop high- efficiency gas power generation technology and natural gas distributed energy technology, continuously enhancing the gas supply guarantee capacity in key areas such as urban gas, industrial fuel, and power generation. (1) Highlight the advantageous position of natural gas in residential cooking and heating, and ensure the stable development of the gas market; (2) Expanding the field of industrial gas consumption, continuing to promote the "coal to gas" conversion, improving gas efficiency and economy, it is expected that industrial fuel natural gas consumption will exceed 1 600×108 m3 by 2025, and 1 800×108 m3 by 2030 [56]. (3) Priority should be given to building natural gas peak shaving power stations in electricity load centers, leveraging the role of gas and electricity as flexible power sources and supporting power sources in consumption centers, integrating with wind and photovoltaic development, and encouraging the construction of multi energy complementary projects for natural gas distributed energy (cold, heat, and electricity) and new energy. It is expected that the installed capacity of natural gas power generation will increase to 1.5×108 kW by 2025, and the consumption will exceed 1 000×108 m3; In the long term, the installed capacity will reach 2.2×108 kW by 2030, and the consumption will exceed 1 500×108 m3; (4) Accelerate the application of LNG in ships and heavy-duty trucks, and promote the substitution of natural gas for oil [70].
Under the goal of carbon neutrality, we will focus on developing two areas: gas and electricity, as well as industrial fuels, to help transform and upgrade the energy consumption structure. It is expected that around 2040, the peak natural gas consumption in China will reach 6500×108 m3 [71] (Fig. 11 ). In the future, gas, electricity, and industrial gas will be important driving forces for the growth of natural gas consumption, and will be the main areas supporting the growth of national natural gas consumption, with their increment accounting for 75% of the total increment in the country. Industrial fuels will become an important driver of natural gas demand growth; the gas and electricity sector will be the core driver of natural gas demand growth, and the technology and economy of energy storage still need time to make breakthroughs. Peak shaving of gas and electricity will play an important role in ensuring safety and stability in the power supply system.
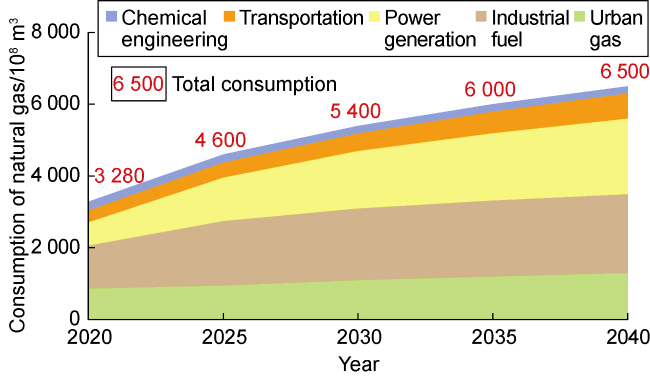
Fig. 11. Statistics and trend prediction of China's natural gas market demand. |
5. Conclusions
Since 1921, the global natural gas industry has gone through four stages of development: the initial stage, stage of growth, stage of leapfrog growth, and the revolutionary stage. The United States has successfully completed "Shale Revolution" through strategic layout, advanced research and management innovation, effectively promoting its “energy independence”.
China's natural gas industry has gone through three stages of development, including the stage of initiation, stage of growth, and stage of leapfrog development, successfully achieving a leapfrog development and becoming an "energy powerhouse". The field of natural gas exploration and development continues to expand, with resource levels doubling continuously and proven reserves increasing continuously. Four major production bases have been established in Ordos Basin, Tarim Basin, Sichuan Basin and the ocean area. Conventional natural gas is steadily developing, while unconventional natural gas is rapidly developing.
Natural gas is an important lever for China's energy transformation, and its important position will be further enhanced under the goal of carbon neutrality. On the one hand, it is a traditional energy source that replaces coal and oil, shouldering the special mission of ensuring energy security; On the other hand, it is the best partner for new energy. The development of natural gas is an insurmountable stage in China's energy transition from high carbon to low-carbon and zero carbon energy. By leveraging the advantages of clean, low-carbon, flexible and easy storage of natural gas, we can promote complementary, coordinated, and integrated development between natural gas and new energy.
Currently, the development of natural gas in China is faced with increasing risks and challenges from external environmental uncertainty. The deterioration of resources is becoming increasingly severe, and problems such as increased difficulty in extraction, rising production costs, and higher requirements for green environmental protection are becoming increasingly prominent. China needs to establish and improve risk prevention and protection mechanisms, achieve efficient exploration and economic development, so as to maintain stable production growth, and continuously promote the smooth operation of the natural gas industry chain are new challenges under the new situation.
In order to ensure national energy security, achieve coordinated development between economy and environmental protection, and achieve carbon neutrality goals, the development of China's natural gas industry is based on "coordinated layout, technological innovation; multi energy complementarity, diversified integration; flexibility and efficiency, optimization and upgrading", further improving the natural gas production, supply, storage and sales system. Firstly, we need to continuously strengthen the exploration and development of natural gas, support the increase of natural gas storage and production through strategic layout, focus on tackling key technologies for efficient natural gas development and improving recovery rates, release the potential production capacity of conventional low-grade gas reservoirs and unconventional gas, focus on overcoming the bottleneck problem, and change the dilemma of key and core technologies relying on importing and being controlled by others. Secondly, it is important to accelerate the green transformation and development of natural gas, making breakthroughs in new natural gas technologies, replacing new fields of natural gas, integrate natural gas and new energy development, promote China's "natural gas revolution", create a "clean, safe, efficient, and sustainable" new energy system in China, and build a "natural gas power". Thirdly, efforts should be made to build a safe and reliable natural gas industry chain and market system, and optimize the market supply and demand structure. Emphasis should be put on expanding the supply, promoting pipeline gas construction, increasing LNG layout and configuration, increasing the scale of gas storage facilities, and forming an overall pattern of diversified supply, orderly utilization, and flexible allocation; Optimizing the consumer end, increasing the proportion of natural gas in primary energy consumption, optimizing the energy consumption structure, and achieving low-carbon and clean development of energy utilization.
Acknowledgement
Sincere thanks should be given to the leaders and experts of China Petroleum Exploration and Development Research Institute, including Ding Guosheng, Wang Xiaolin, and Lin Shiguo, for their suggestions and assistance in the research process of the paper.