

Introduction
The semi-deep to deep lake gravity flow sandstone is widely developed in the 7th member of the Triassic Yanchang Formation (Chang 7 Member for short) in the Ordos Basin, NW China. It is an important unconventional oil and gas reservoir, and is interbedded with deep water black shale or dark mudstone in varying thickness [1]. Feldspar dissolution pores are one of the main storage spaces of such sandstones [1⇓⇓⇓⇓-6]. It is crucial to elucidate the features and controlling factors of feldspar dissolution for comprehending the origin of intra-source or near-source sandstone “sweet spot” reservoir.
In the late 1970s, the concept of secondary porosity was proposed, and in the 1980s, Surdam, Stoessell and other researchers developed an organic acid dissolution model for carbonate and aluminosilicate minerals such as feldspar [7⇓⇓-10]. The model has been extensively applied for studying continental sandstone reservoirs in China. It is generally believed that organic acids produced during the evolution of organic matter migrate into the sandstone to dissolve the unstable components such as feldspar and lithics [11⇓⇓⇓⇓-16]. Theoretically, the closer the sandstone is to the source rock, the more likely it is to dissolve. The sandstone in the semi-deep to deep lake gravity flow is interbedded with the source rock of the Chang 7 Member and has excellent conditions for dissolution. However, available data shows that with similar sandstone structural maturity, the feldspar dissolution pores in the Chang 7 sandstone are spatially inconsistent with the thickest area of the source rock. The area with the highest degree of dissolution is not the most developed area of the source rock [5]. The cause for this difference is rarely discussed. It is difficult to explain in terms of the differences in closing/opening condition of diagenetic system or the content of soluble materials. Because present formation water in the Chang 7 Member shows that as a shale oil layer, the water is generally CaCl2 type [17]. Furthermore, the geological structure in the study area is gentle and there is no significant difference in the closing/opening condition of diagenetic system. Although the feldspar content varies from area to area, it is still much greater than the requirement for dissolution [13].
Petrological properties control pore evolution at different diagenetic stages and they are the controlling factors on the physical properties of sandstone [18]. Previous studies have shown that, in addition to the dissolution of feldspar, lithics and carbonate minerals that consume organic acids, mica, volcanic alteration and clay transformation also regulate the pH of pore fluid [12,19 -20]. For example, mica minerals can adsorb H+, increase the pH of pore water, promote pressure solution and overgrowth of adjacent quartz [19,21⇓⇓ -24], and precipitate calcite, chlorite or kaolinite [3,19,25]. However, it is rarely known whether mica can affect the dissolution of the feldspar in Chang 7 sandstone. This paper analyzes the petrology and diagenetic characteristics of the semi-deep to deep lake gravity-flow sandstone of the Chang 7 Member in the Ordos Basin. In combination with dissolution experiments, the dissolution characteristics of different types of feldspar, the consuming capacity of feldspar and mica debris to organic acids and the factors affecting feldspar dissolution are studied.
1. Geological setting
The Ordos Basin is located at the junction of the eastern and western tectonic domains in China. The study area is located at the southwest of the Ordos Basin, which belongs to the Yishaan Slope and the Tianhuan Depression, and covers the key area of shale oil exploration in the Yanchang Formation [26-27] (Fig. 1a ).

Fig. 1 Location of the study area (a), sedimentary facies distribution (b), and provenance-based division and sampling wells distribution of sedimentary area (c) of the Chang 7 Member in the Ordos Basin (modified from Reference [26]). |
The Yanchang Formation can be divided into Chang 10 to Chang 1 members from bottom up. The sedimentary characteristics reflect the evolutionary process of lake basin formation, expansion and extinction. The Chang 7 Member was deposited during the largest lake transgression. The black shale deposited during that period is an important oil source rock [4,28⇓⇓ -31]. Simultaneously, gravity flow sandstone that is vertically interbedded with black shale is widely distributed in the semi-deep to deep lake area (Fig. 1b ) [31-32]. The deposits of the Chang 7 sandstone are originated from five provenances around the basin [26] according their composition (Fig. 1c ), but almost from the northeast and the southwest. The middle is a mixed provenance.
2. Samples and methods
In this study, 68 Chang 71 samples (Fig. 1b ) were taken from 14 wells for casting thin sections, scanning electron microscopy (SEM) and energy spectrum analysis, and typical gravity-flow sandstone samples in semi deep-deep lake were selected for whole rock testing (XRD), including petrological properties, feldspar types, content and dissolution characteristics. In combination with 864 thin sandstone sections (932 in total) from 177 wells, rock composition and the regional distribution of dissolution pores were studied, and the relationship between feldspar dissolution pores and rock composition and source rock was discussed. Then three minerals (i.e., biotite, muscovite and potassium feldspar) were selected for dissolution experiments with formic, acetic and propionic acids. The experimental results were compared with the underground data. The experimental procedures are as follows: (1) Calculated the mass of biotite, muscovite and feldspar according to their average volume fractions (30% for feldspar, and 5% for mica), and weighed 0.9 g biotite, 0.9 g muscovite, and 5.0 g feldspar with an electronic balance. (2) Prepared formic, acetic and propionic acid at 0.1 mol/L referring to previous organic acid dissolution experiments [33]. (3) Selected 3 types of minerals and 2 types of mineral combinations (biotite, muscovite, K-feldspar, biotite + K-feldspar, muscovite + K-feldspar), and divided each group into 3 parts. Dropped 10 mL formic, acetic and propionic acid into each group, respectively, with a rubber dropper, and let them react. (4) Totally 15 groups of reaction went on. Measured the pH value of the solution using a glass pen pH meter every 24 h until the ninth day when the measured data was stable.
3. Petrology of Chang 7 sandstone
Far away from provenances and deposited in deep water, the Chang 7 sandstone in the study area is fine grained, moderately well sorted and poorly rounded. The particles are mainly 0.04-0.30 mm, with an average of 0.16 mm. Fine sandstone accounts for about 59.1%, followed by silty sandstone, medium to fine sandstone and small amounts of coarse sandstone, 22.9%, 13.4% and 4.6%, respectively. The sorting of framework grains is moderately well, accounting for 52.7%, followed by well and poor sorting, accounting for 22.7% and 24.6%, respectively. The particle roundness is almost sub-angular.
The Chang 7 sandstone is mainly lithic feldspathic sandstone and feldspar lithic sandstone, with contents of 44.3% and 41.9%, respectively (Fig. 2 ), followed by feldspar sandstone and lithic sandstone, with contents of 8.2% and 5.6%. The content of quartz is 11%-70%, with an average of 36.45%. The content of feldspar is 7%-60%, with an average of 24.47%. The content of lithics is 7%-44%, with an average of 18.94% (Table 1 ). The mica content is high, up to 30.0%, with an average of 5.14%. The average content of matrix is 9.39%, mainly hydromica, and a small amount of tuffaceous and net-shaped clay. The average content of cement is 6.21%, mainly carbonate, siliceous, illite and chlorite.
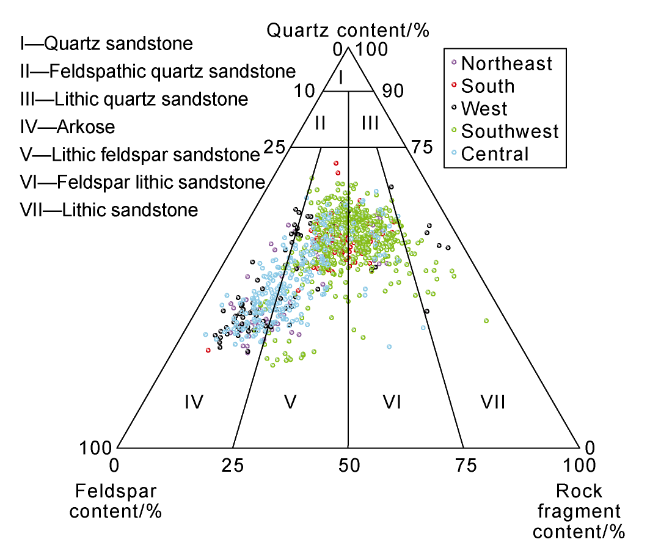
Fig. 2 Ternary diagram of rock classification for the Chang 7 sandstone. |
Table 1 Rock composition and porosity from thin sections of Chang 7 sandstone in the study area |
| Region | Number of samples | Detrital composition/% | Interstitial material/% | Thin section porosity/% | ||||||||
|---|---|---|---|---|---|---|---|---|---|---|---|---|
| Quartz | Feldspar | Lithics | Mica | Matrix | Cement | Feldspar dissolution pore | Lithic dissolution pore | Cement dissolution pore | Intergranular pore | Total thin section porosity | ||
| Northeast | 99 | 15.80-51.50/ 25.11 | 12.00-53.50/ 42.52 | 7.00-27.20/ 12.01 | 7.10 | 6.64 | 6.62 | 0.80 | 0.10 | 1.10 | 2.30 | |
| Central | 145 | 11.00-56.50/ 25.10 | 7.00-57.53/ 35.10 | 7.00-41.01/ 14.01 | 7.67 | 10.21 | 7.92 | 0.68 | 0.10 | 1.10 | 2.00 | |
| South | 55 | 21.00-54.00/ 39.10 | 8.00-60.00/ 24.10 | 9.00-24.80/ 17.12 | 4.70 | 10.10 | 4.90 | 1.04 | 0.10 | 0.30 | 1.60 | |
| West | 65 | 16.00-70.00/ 33.08 | 7.30-57.00/ 24.22 | 7.20-44.00/ 24.32 | 4.56 | 8.15 | 5.67 | 1.01 | 0.30 | 0.20 | 3.30 | 4.90 |
| Southwest | 568 | 15.80-51.50/ 40.16 | 12.00-53.50/ 19.08 | 8.10-27.20/ 20.88 | 4.31 | 9.68 | 5.89 | 0.96 | 0.10 | 0.10 | 0.70 | 2.00 |
| Average | 36.45 | 24.47 | 18.94 | 5.14 | 9.39 | 6.21 | 0.91 | 0.10 | 0.08 | 0.95 | 2.19 | |
Note: The value after "/" is average. |
The regional variation of the sandstone components is significant due to the different lithologies of the provenances. In the north-eastern region (Fig. 3 ), the sandstone is characterized by high contents of mica and feldspar, 42.52% and 7.10% on average, respectively, and the sandstone is mainly feldspar sandstone and lithic feldspar sandstone. The sandstone in the southwest region is mainly lithic feldspar sandstone and feldspar lithic sandstone with high contents of rock fragments and quartz, and a low content of mica (4.31% on average).
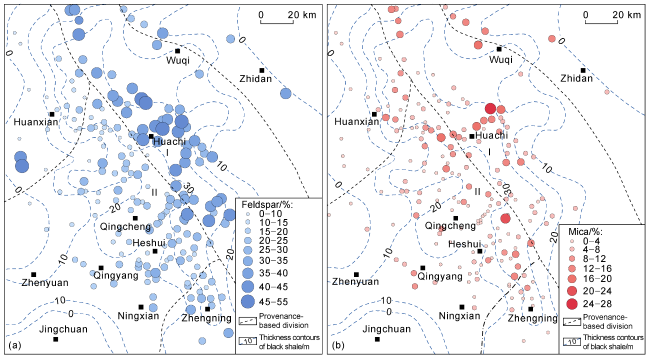
Fig. 3 Distribution of feldspar (a) and mica (b) in the Chang 7 sandstone in the study area (from thin section data). |
The whole rock X-ray diffraction results show that the plagioclase content in Chang 7 sandstone is 7.14%-36.10%, with an average of 18.33%, and the K-feldspar content is 5.37%-17.98%, with an average of 8.21%. The feldspar content varies from region to region. The content of plagioclase in the northeast, central, west and southwest is 31.35%, 14.10%, 12.01% and 16.25%, respectively, while the content of K-feldspar is 9.76%, 9.58%, 6.16% and 8.02%, respectively (Fig. 4 ). The K-feldspar and plagioclase contents obtained from X-ray diffraction are consistent with the feldspar content from thin sections.
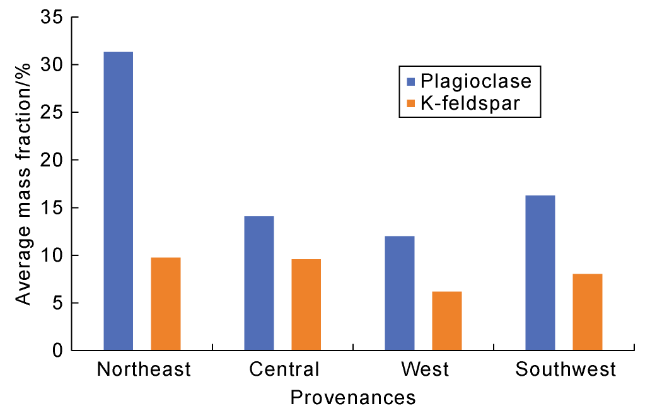
Fig. 4 The average content histogram of plagioclase and K-feldspar in the Chang 7 sandstone in the study area. |
4. Diagenetic processes of feldspar in Chang 7 sandstone
Observation of thin sections and SEM shows that there are three types of feldspar alteration processes in the Chang 7 sandstone: feldspar overgrowth, replacement by authigenic minerals and dissolution.
4.1. Feldspar overgrowth and replacement by authigenic mineral
Feldspar overgrowth is occasionally observed. Compared with detrital feldspar, feldspar overgrowth is cleaner, unaltered and free from inclusions, indicating that they were formed in the diagenetic process. The extinction pattern of feldspar overgrowth can be consistent with (Fig. 5a ) or opposite to (Fig. 5b ) detrital feldspar.
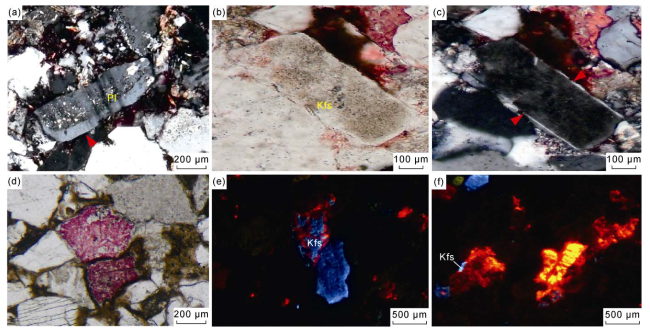
Fig. 5 Feldspar overgrowth and replacement. (a) Sericitized plagioclase with overgrowth; 1 216.53 m; Well Zheng 9; cross-polarized light (XPL); (b) Feldspar overgrowth; 1 178.50 m; Well Zheng 8; plane-polarized light (PPL); (c) Kaolinized K-feldspar with slightly dissolved edge; 1 178.50 m; Well Zheng 8; XPL; (d) K-feldspar completely dissolved, a small amount of residue, and filled with calcite; PPL; 2 201.60 m; Well Hu 218; (e) K-feldspar locally replaced by calcite; 2 647.83 m; Well Huan 54; cathodoluminescence; (f) K-feldspar replaced by early calcite; 1 634.70 m; Well Ning 29; cathodoluminescence. Pl—plagioclase; Kfs—K-feldspar. |
Feldspar can be replaced by authigenic clay and carbonate minerals. The replacement by authigenic clay is mainly kaolinization of K-feldspar (Fig. 5c ) or sericitization of plagioclase under weak acidic conditions. The replacement results in an unclean surface of feldspar crystal and makes a stark contrast to feldspar overgrowth (Fig. 5a ), indicating that the replacement of feldspar by clay mineral occurs earlier than feldspar overgrowth, and may be the product of early diagenesis. Feldspar can be partially or completely replaced by calcite (Fig. 5d-5f ), and the replacement is observable in early poikiloclastic cemented sandstone and pore-cemented sandstone, indicating that such replacement occurs throughout the diagenesis.
4.2. Feldspar dissolution
4.2.1. Feldspar dissolution pores
According to the statistics of 932 casting thin sections, pores in the Chang 7 sandstone are mainly dissolution pores and intergranular pores. Total thin section porosity averages 2.19%, and that of feldspar dissolution pores is 0.91% (Fig. 6a ), almost half the reservoir space. The degree of dissolution and the characteristics of different types of feldspar are different, showing that K-feldspar is more easily to be dissolved than plagioclase. According to the observation of 68 new cast thin sections, the dissolution porosity of potassium feldspar is 0-2.4% (Fig. 6b ), with an average of 0.75%, and that of plagioclase is 0-0.8%, with an average of 0.13%. The cleavage of K-feldspar is clearly step-shaped under plane-polarized light (Fig. 7a ), mostly simple twinning (orthoclase) or cross hatched twinning (microcline). After being dissolved, K-feldspar becomes a residual skeleton, and leaves large pores. Oil in the pores can be removed and displaced by red resin (Fig. 7a, 7b ). Plagioclase (mainly albite) has small dissolution pores which are poorly connected, and have residual hydrocarbons (Fig. 7c ). This suggests that feldspar dissolution occurs before hydrocarbon filling.
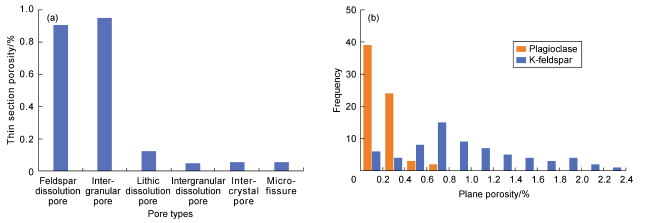
Fig. 6 Thin section porosity of different pores (a) and the dissolution porosity of plagioclase and K-feldspar (b) in Chang 7 sandstone. |

Fig. 7 Photomicrographs of feldspar dissolution in the Chang 7 sandstone in the study area. (a) K-feldspar dissolution pores filled with red resin; 1 973.79 m; Well Xi 23; PPL; (b) Residual K-feldspar skeleton and undissolved adjacent microcline; 1 973.79 m; Well Xi 23; PPL; (c) Plagioclase ( probably albite ) partially dissolved and dissolution pores filled with hydrocarbons; 1 973.79 m; Well Xi 23; PPL; (d) The same field of view as Fig. a; XPL; (e) Microcline characterized by crossed twinning; the same field of view as Fig. b; XPL; (f) Albite characterized by polysynthetic twin; the same field of view as Fig. c; XPL; (g) Residual K-feldspar skeleton and adjacent dissolved kaolinized K-feldspar; 1 689.33 m; Well Ning 28; PPL; (h) The same field of view as Fig. g; XPL; (i) Undissolved kaolinized K-feldspar; 1 689.33 m; Well Ning 28; PPL (left ) and XPL (right ). Ab—albite; Mic—microcline. |
The SEM observation also shows that K-feldspar has more dissolution pores than plagioclase. The dissolution porosity of K-feldspar debris is generally higher than that of the adjacent albite debris (Fig. 8a ). Fig. 8b shows that K-feldspar is in contact with albite in twinning, and dissolution pores of different sizes are found in K-feldspar, but no pores in the albite adjacent to biotite (Fig. 8b ). The distribution of pores in albite is also closely related to the solid solution of K-feldspar, and the pores in K-feldspar solid solution are more than those in host albite mineral (Fig. 8c, 8d ). In addition, orthoclase in K-feldspar is more soluble than microcline. Fig. 7e shows that orthoclase debris has been partially dissolved, but adjacent microcline has not or partially been dissolved. Unaltered feldspar has been significantly dissolved (Fig. 7d-7f ). Kaolinized or sericitized feldspar is intact, but the adjacent unaltered feldspar tends to be dissolved (Fig. 7g-7i ).
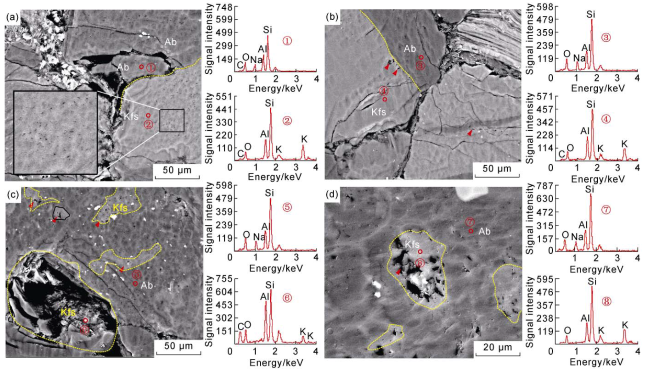
Fig. 8 SEM images and energy spectra of feldspar in Chang 7 sandstone (①-⑧ are energy spectrum detecting points). (a) K-feldspar (light gray) has more micropores than adjacent albite (gray); 1 944.9 m; Well Shan 110; (b) K-feldspar and albite contact in twinning; K-feldspar has dissolution pores with different sizes along the crystal boundary, but no pores found in albite adjacent to biotite; 1 944.9 m; Well Shan 110; (c) pores in albite is closely related to K-feldspar solid solution; 1 498.6 m; Well Shan 110; (d) micropores in K-feldspar are more than in host albite mineral; 1 498.6 m; Well Shan 110. |
4.2.2. Dissolution process of feldspar
Dissolution of feldspar by organic acid is the main cause for secondary pore formation in the Chang 7 sandstone [5-6]. In the dissolution process, SiO2 is produced and leads to the precipitation of quartz and kaolinite. If the pore fluid contains rich potassium ions, illite will be formed [34]. Mineral assemblages of authigenic quartz with illite (Fig. 9a ) or kaolinite (Fig. 9b, 9c ) in or near feldspar dissolution pores are often observed under the microscope.

Fig. 9 SEM images of feldspar dissolution pores and by-product minerals in Chang 7 sandstone. (a) Dissolution pores filled with authigenic quartz and illite; 2 110.00 m; Well Li 150; ( b ) K-feldspar dissolution pores filled with quartz; 2 422.54 m; Well An 72; (c) K-feldspar dissolution pore, and authigenic kaolinite deposits in intergranular pores; 2 300.39 m; Well Hu 211; (d) pores partially filled with albite and calcite; 1 809.40 m; Well Zhuang 144; (e) authigenic albite and illite deposited in dissolution pores; 2 572.00 m; Well Geng 170; (f) short-plate authigenic albite and illite in dissolution pores; 2 463.04 m; Well Huan 87. Cal—calcite; I—illite; K—kaolinite; Qtz—quartz. |
The albitization of feldspar is another way of forming dissolution pores. For example, plagioclase is an isomorphic mixture of albite and anorthite. During albitization, Ca2+ in plagioclase is replaced by Na+ to form albite, and Ca2+ is then released into the pore fluid and can lead to further precipitation of carbonate cements, eventually forming a mineral assemblage of authigenic albite crystals with calcite or dolomite [35⇓⇓⇓-39] (Fig. 9d ).
When albitization occurs in K-feldspar, the K+ in K-feldspar is replaced by Na+ to form albite. The released K+ can further react with kaolinite at higher temperature (100-130 °C) to form authigenic illite, and finally to form a mineral assemblage of authigenic albite and illite [40] (Fig. 9e, 9f ).
4.3. Regional distribution of feldspar dissolution porosity
The thin section porosity of feldspar dissolution porosity varies widely in different sedimentary areas (Fig. 10a ). Thin section porosity of the feldspar dissolution pores is higher in the south, southwest and west regions at 1.04%, 0.96% and 1.01% respectively, followed by 0.80% in the northeast and the lowest in the central regions, only 0.68% on average (Table 1 ). The distribution of feldspar dissolution pores is not consistent with the distribution of the thickest high-quality source rock and the highest feldspar content of the Chang 7 Member (Figs. 3a and 10b ), and shows an opposite trend to the distribution of the mica content (Fig. 3b ), indicating that feldspar dissolution probably be influenced by mica.
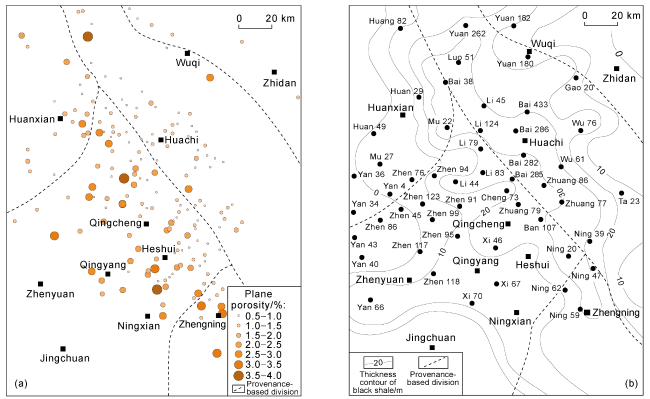
Fig. 10 Thin section porosity distribution of feldspar dissolution pores (a) and thickness of dark mudstone (b) in Chang 7 Member. |
4.4. Dissolution experiment of feldspar
To further understand the influence of organic acids and mica on the dissolution of K-feldspar, dissolution experiments on different mineral assemblages with three organic acids were carried out, and the pH data of the solution after different periods of reaction time were measured. Using the calculation formula for pH, the concentration of hydrogen ions in the test samples was calculated (Table 2 and Fig. 11 ).
Table 2 The pH variation of solution groups with different mineral assemblages |
| Mineral | Organic acids | pH | Hydrogen ion concentration/(10−3 mol·L−1) | ||||||||
|---|---|---|---|---|---|---|---|---|---|---|---|
| Day 1 | Day 2 | Day 3 | Day 4 | Day 5 | Day 6 | Day 7 | Day 8 | Day 9 | |||
| Biotite | Formic acid | 1.44 | 1.95 | 2.00 | 2.08 | 2.16 | 2.26 | 2.20 | 2.26 | 2.26 | 30.81 |
| Acetic acid | 1.96 | 2.65 | 2.77 | 2.89 | 3.05 | 3.10 | 3.16 | 3.19 | 3.19 | 10.32 | |
| Propionic acid | 1.85 | 2.60 | 2.70 | 2.80 | 3.00 | 3.01 | 3.12 | 3.13 | 3.16 | 13.41 | |
| Muscovite | Formic acid | 1.44 | 1.96 | 1.94 | 2.04 | 2.08 | 2.14 | 2.16 | 2.17 | 2.18 | 29.70 |
| Acetic acid | 1.96 | 2.55 | 2.56 | 2.64 | 2.75 | 2.70 | 2.75 | 2.73 | 2.74 | 9.15 | |
| Propionic acid | 1.85 | 2.58 | 2.65 | 2.71 | 2.83 | 2.85 | 2.86 | 2.89 | 2.92 | 12.88 | |
| K-feldspar | Formic acid | 1.44 | 1.90 | 2.02 | 2.03 | 2.07 | 2.33 | 2.25 | 2.33 | 2.39 | 28.43 |
| Acetic acid | 1.96 | 2.60 | 2.78 | 2.86 | 2.94 | 2.96 | 2.94 | 3.08 | 3.08 | 10.07 | |
| Propionic acid | 1.85 | 2.53 | 2.64 | 2.77 | 2.78 | 2.83 | 2.79 | 2.83 | 2.90 | 12.69 | |
| Biotite + K-feldspar | Formic acid | 1.44 | 1.99 | 2.16 | 2.27 | 2.27 | 2.31 | 2.39 | 2.42 | 2.43 | 32.13 |
| Acetic acid | 1.96 | 2.87 | 2.97 | 3.10 | 3.08 | 3.18 | 3.19 | 3.22 | 3.22 | 10.19 | |
| Propionic acid | 1.85 | 2.74 | 2.85 | 2.90 | 3.02 | 3.20 | 3.09 | 3.13 | 3.19 | 13.20 | |
| Muscovite + K-feldspar | Formic acid | 1.44 | 1.96 | 2.05 | 2.15 | 2.11 | 2.28 | 2.28 | 2.28 | 2.28 | 28.15 |
| Acetic acid | 1.96 | 2.69 | 2.77 | 2.86 | 2.89 | 2.95 | 2.89 | 2.97 | 2.97 | 9.71 | |
| Propionic acid | 1.85 | 2.63 | 2.71 | 2.80 | 2.83 | 2.96 | 2.90 | 2.91 | 2.92 | 12.74 | |
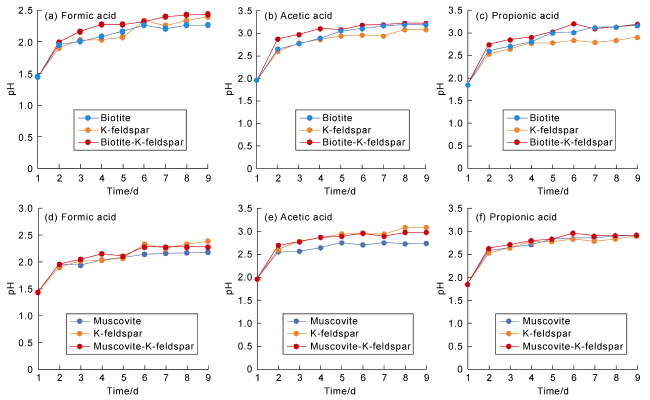
Fig. 11 The pH variation curves of reaction solutions of organic acids with different mineral assemblages. |
The results showed that: (1) The pH of all experimental groups changed significantly in the first two days and tended to remain stable for the next seven days, indicating that the reaction tended to be balanced. (2) Formic acid had the strongest acidity, the highest degree of reaction with various minerals or combinations, and the variation of hydrogen ion concentration exceeded 28×10-3 mol/L, significantly higher than acetic and propionic acid. (3) Biotite reacted more with formic, acetic and propionic acids than feldspar, and muscovite reacted slightly more with formic acid and propane but less with acetic acid than feldspar.
5. Controlling factors on feldspar dissolution
5.1. Feldspar content and type
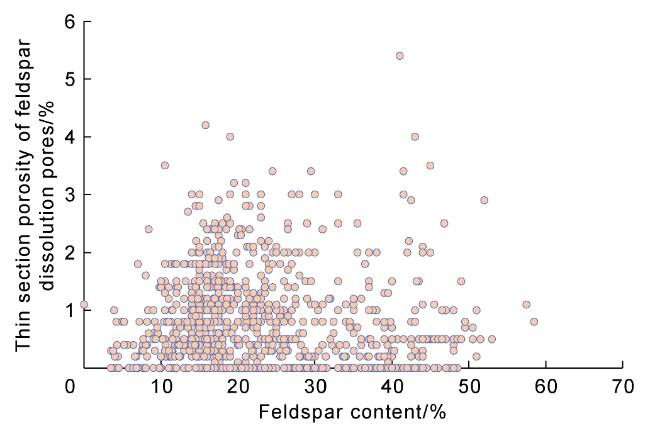
Thin section data show that there is a poor correlation between the content of feldspar and the porosity of feldspar dissolution pores (Fig. 12 ). The possible reason for this is that the degree of feldspar dissolution is low and the average thin section porosity is only 0.85%. The average feldspar content is 24.47% and the average K-feldspar content gained from XRD analysis is 8.21%, which far exceeds the dissolution requirement. Thus, feldspar content is not the primary factor that controls feldspar dissolution.
Fig. 12 The scatter plots of feldspar content and feldspar dissolution porosity in the study area. |
The type of feldspar has a significant effect on the dissolution of the Chang 7 sandstone, as evidenced by the following: (1) K-feldspar is more soluble than plagioclase. (2) Orthoclase in K-feldspar is more soluble than microcline. (3) Unaltered feldspar is more susceptible to dissolution than kaolin or sericite feldspar. Feldspar dissolution depends on their types, and is related to the composition of the feldspar. Energy spectrum analysis shows that the plagioclase in the Chang 7 sandstone is almost calcium-free and mostly albite. Albite is more stable than K-feldspar with increasing depth and temperature [36]. Furthermore, the volume change of K-feldspar before and after dissolution is greater than anorthite and albite [41]. Therefore, the dissolution of K-feldspar is more important for the formation of secondary porosity.
In the syngenetic or early diagenetic stage, feldspar is easily kaolinized or sericitized [42-43], and such feldspar does not dissolve in the late stage. The main reason may be that the soluble components of feldspar are consumed first in early replacement. Kaolinite or illite itself is also one of the products of feldspar dissolution during the burial period [18,43⇓⇓ -46]. Therefore, early kaolinization or sericiteization inhibits late dissolution reaction.
5.2. Organic acids
Atmospheric freshwater and organic acids are generally considered to be the main media for particle dissolution [47⇓-49]. In the study area, the gravity flow sandstone of the Chang 7 Member was deposited in a semi-deep to deep lake, and not easily exposed to atmospheric water during the sedimentary stage. The geological structure was stable during the burial period and faults were less developed, preventing the sandstone from being leached by atmospheric freshwater [6]. The feldspar dissolution pores were preserved without collapsing and deforming (Fig. 7 ). All the evidences suggest that the dissolution was related to the organic acid in the burial period.
Thick black shale with a high organic content is developed in the Chang 7 Member. It is almost distributed in Jiyuan-Zhengning areas in the northwest-southeast direction, and more than 30 m thick (Fig. 10b ). The gravity flow sandstone in the semi-deep to deep lake is interbedded with source rocks. The acidic water from the source rocks during the maturation process can directly enter the adjacent sandstone and dissolve it. This explains why the fine-grained, matrix-rich sandstone of the Chang 7 Member still has dissolution pores [4,6]. However, the distribution of the thickest high-quality source rock is not consistent with the distribution of the dissolution pores. As shown in Fig. 10a , Fig. 10b and Table 1 , the source rocks in the central Huachi area are the most developed and generally thicker than 20 m. The feldspar content is also high, averaged 35.1%, but the feldspar dissolution porosity in the area is only 0.68%. The source rocks in the Ningxian-Qingcheng area in the southwest are thinner and the feldspar content is low (averaged only 19.08%), but the feldspar dissolution porosity in this area is high, averaged 0.96%, indicating that feldspar dissolution is influenced by other factors in addition to the source rocks.
5.3. Mica
The dissolution experiment also found that mica and feldspar were consumers of organic acids in their chemical reaction process. A gram of biotite consumed formic, acetic and propionic acids of 34.23×10⁻³, 11.47×10⁻³, and 14.60×10⁻³ mol/L, respectively; 33.00×10⁻³, 10.17×10⁻³, and 14.31×10⁻³ mol /L, respectively, by a gram of muscovite; and 5.69×10⁻³, 2.01×10⁻³ and 2.54×10⁻³ mol/L, respectively, by feldspar. In terms of unit consumption, biotite and muscovite are significantly higher than feldspar. This suggests that mica has a significant buffering effect on the dissolution of feldspar.
Another potential effect of mica on feldspar dissolution is that mica minerals may expand and fill in intergranular pores after alteration or be compacted into pseudo-matrix, reducing the flowing capacity of the pore throat [53], and thus preventing organic acid from entering sandstone and dissolving feldspar.
The feldspar dissolution porosity and mica distribution in the Chang 7 sandstone agree with experimental results (Table 1 ). In the central area, although the source rocks are the most developed and the feldspar content is high, the mica content is rich, with an average content of 7.67%. The feldspar dissolution porosity in the central area is significantly lower than that in the southwest (the average mica content is 4.31%), indicating that the inhibition of mica on feldspar dissolution is also reflected at the macroscale.
For a long time, researches into the mechanisms of reservoir formation have focused mainly on the type of dissolving fluid (atmospheric water or organic acid or CO2) and the closing/opening condition of diagenetic system [7,47,53⇓ -55], but the competitive consumption of sandstone components on dissolution fluid is less discussed.
Experiments show that mica of the same quality consumes significantly more organic acids than feldspar (by 4-5 times). In real sandstone, even if the mica content is low, its effect on the consumption of organic acids and the dissolution of feldspar cannot be ignored. The distribution relationship between feldspar dissolution pores and mica content in the Chang 7 sandstone also demonstrates the potential influence of mica minerals on dissolution pores. The influence of mica-feldspar competition on acid consumption should be considered when studying the distribution of secondary pores. Because mica is common in clastic rocks, especially in semi-deep to lake gravity flow sandstone, it is more likely to enrich. This understanding has certain implications on the analysis and evaluation of deepwater sandstone reservoirs.
6. Conclusions
The feldspar in Chang 7 sandstone experienced three types of diagenetic processes: feldspar overgrowth, replacement by clay or calcite and feldspar dissolution. Both organic acid and albitization facilitate the dissolution of feldspar, and organic acid is the main cause for the formation of dissolution pores.
K-feldspar is more soluble than plagioclase. In K-feldspar, orthoclase is more soluble than microcline, and unaltered feldspar is more susceptible to dissolution than early kaolinized or sericitized feldspar.
The dissolution experiment shows that the ability of mica to consume organic acids is significantly stronger than that of feldspar, and the presence of mica inhibits the dissolution of feldspar. The feldspar dissolution pores in Chang 7 sandstone are mainly distributed in the area with a low mica content in the southwest of the study area, while the feldspar dissolution pores in the central and northeastern areas with a high mica content are significantly less.
The feldspar dissolution porosity of the gravity-flow sandstone of the Chang 7 Member is affected by many factors, including organic acid, feldspar type, early alteration degree of feldspar and mica content.