

Introduction
Underground gas storages (UGS) have advantages such as peak shaving, supply guarantee, environment protection, strategic reserves, and economic efficiency, and have attracted worldwide attention [1-2]. In China, the existing UGS are small in capacity to support the peak-shaving in the country. Thus, the expanded development of UGS is meaningful in respect of livelihood and strategy [3]. Different from the development of oil and gas reservoirs, the construction of UGS is characterized by bidirectional cyclic injection and production, high-speed strong injection and production, and alternating cyclic loads, making the design, construction, operation, and control very challenging. Moreover, in the lifecycle development of UGS, repeated storage and production of gas and reciprocal intrusion of water jointly aggravate the time-varying and complex nature of fluid flow patterns and occurrence states. The lifecycle development of a UGS can simply be divided into two stages: construction and operation (or cyclic storage-production).
In the construction stage, a reasonable gas injection method can steadily drive the gas-liquid interface to move toward the production well, thereby efficiently displacing the fluid, and increasing the pore space for gas storage. In this stage, it is crucial to ensure the stable movement of the gas-liquid interface. Most scholars hold that gravity, viscous force, and capillary pressure are the key mechanical mechanisms to determine the morphology of the gas-liquid interface and the displacement stability [4-5]. A concept was proposed to control the stable movement of the gas-liquid interface, with consideration of the mechanical interactions between fluids [6]. This concept can support the formation of storage capacity in the construction stage, but not manipulate the expansion of storage capacity in the cyclic storage-production stage.
In the cyclic storage-production stage, multiple rounds of gas storage and water invasion processes continue to change the size and shape of the storage space. It is important to rationally control these processes for UGS capacity expansion, which is a key engineering issue to be addressed [7]. In this stage, the macroscopic gas-liquid interface has been broken, and the flow mechanism and occurrence mode of gas and liquid under complex subsurface conditions are top research topics. Regarding these aspects, the studies are mostly made through small- scale visualization experiments, core flooding experiments, and reservoir engineering methods [8⇓-10], assuming a constant storage production system. There are few attempts to expand the UGS capacity by changing the injection and production methods, and also rare effort on the evolution of the gas-liquid interface and the rules of fluid occurrence during multi-cycle gas-water mutual displacement process.
Water-invaded gas-reservoir UGS are commonly challenged by a two-phase fluid flow problem in the multi-cycle storage-production process, that is, gas intrudes into the displacing water, and water sucks the displaced gas. For these UGS, it is urgent to improve the displacement efficiency, reduce the residual water saturation in the porous media, and continually increase the pore space for gas storage. This paper presents an experimental study on the construction stage and the cyclic storage-production stage of water-invaded gas-reservoir UGS, to investigate the gas-liquid interface stabilization mechanism, gas-liquid flow, and occurrence rules. The results help to explore the optimization and control method for efficient lifecycle operation of UGS.
1. Experiment
1.1. Materials and apparatus
The experimental gas is methane. The experimental water is deionized water, dyed with methylene blue, with a density of 1.03 g/cm3 and a viscosity of 0.99 mPa·s at 25°C. The experimental model is made of two pieces of glass, which are bonded together and both hydrophilic. One piece is etched to mimic a typical sandstone with pores. The etched part has a size of 10 cm×3.6 cm×13 μm, where basic structural units (6 mm×4 mm each) are arranged and combined, as shown in Fig. 1 , to fully reflect the heterogeneity of the model and maximally imitate the 3-D pore network of a real reservoir [11]. However, this model can only characterize partial microscopic hetero- geneity of the actual reservoir, not the whole macroscopic heterogeneity. The model porosity is 35.2%. The enlarged view of the model can display the migration and evolution of the gas-liquid interface in the displacement process.

Fig. 1 Design of the porous media model. |
The apparatus includes Harvard PHD Ultra micro-flow dual-channel constant-rate syringe pump (with a controllable rate of 10-100 mL/min), Sony α7RIII camera, ZEISS SteREO Discovery V12 rotatable stereo microscope, and LED panel light, etc.
1.2. Schemes
The experiment was designed to inject methane from the top of the model to simulate the gas injection for displacing the pore fluid (the construction stage) and inject water from the bottom to simulate the water invasion during gas production (the storage-production stage). The experimental parameters are shown in Table 1 .
Table 1 Schemes of microfluidic experiment |
| Scheme | Gas injection rate in the construction stage/ (μL·min−1) | Bottom water invasion rate in the cyclic storage-production stage/ (μL·min−1) | Gas injection rate in the cyclic storage-production stage/(μL·min−1) |
|---|---|---|---|
| 1 | 1.00 | ||
| 2 | 0.25 | ||
| 3 | 1.00 | ||
| 4 | 3.00 | ||
| 5 | 10.00 | ||
| 6 | 1.00 | 1.50 | 1.00 |
| 7 | 10.00 | 15.00 | 10.00 |
| 8 | 1.00 | 1.50→15.00 | 2.00→10.00 |
A total of 8 experimental schemes were prepared, with the model set horizontally in Scheme 1 and vertically in Schemes 2-8. Schemes 1-3 were used to compare the differences in fluid migration and distribution when the model was placed horizontally and vertically. Schemes 2-5 were designed to investigate the morphology of gas- liquid interface and its stabilization mechanism during water displacement by top gas injection (in the construction stage). Schemes 6-8 were employed to mimic the gas- liquid flow and occurrence in the construction stage and the cyclic storage-production stage (with a total of 10 cycles). Specifically, the cyclic storage-production process was conducted at a constant low rate in Scheme 6, at a constant high rate in Scheme 7, and at an accelerating rate in Scheme 8, that is, the gas injection rate increases linearly by cycles. Since most UGSs follow the practice that the gas production rate is about 1 to 2 times of the gas injection rate, the bottom water invasion/gas production rate is designed to be 1.5 times of the gas injection rate in this study.
1.3. Procedure
The experiment was implemented according to the designed parameters under the scheme (Table 1 ), with steps as follows:
(1) At the temperature of 25 °C (but no back-pressure set), fix the experimental model and use a micro vacuum pump to evacuate it for 1 hour; then, saturate the model with methylene blue dyed water, and calculate the porosity of the model according to the material balance method.
(2) Let the model stand for 1 hour to keep the fluid distribution in the model balanced, and place the water-saturated model on the LED panel light (horizontally or vertically as designed), connect all parts of the experimental system as shown in Fig. 2 , adjust the brightness of the light and the focal length of the stereo microscope until the complete pore structure displays.

Fig. 2 Diagram of the microfluidic experimental system. |
(3) Carry out gas injection and gas injection-bottom water invasion as designed, and record the experimental process regularly, until the remaining fluid in the model no longer changes.
(4) Clean the pores with alcohol, and then rinse with nitrogen to blow out the alcohol; place the model in a 75°C thermostat to dry it, and conduct the subsequent experiment after it is completely dry (the same model is used in the experiment under each scheme for purpose of comparability).
(5) Repeat steps (1) to (4) until all designed experiments are completed.
2. Stable displacement mechanism during the initial construction stage
2.1. Influences of gravity on the gas-liquid interface
Experiments with the model in horizontal and vertical arrangements can highlight the influence of gravity on the morphology of the gas-liquid interface. When the model is not injected with gas, the fluid in the pores does not flow freely under gravity, since gravity cannot overcome capillary pressure. Fig. 3 shows the morphology of the gas-liquid interface when the injection rate is 1 μL/min under Scheme 1 and Scheme 3.

Fig. 3 Morphology of the gas-liquid interface in case of gas injection into the model at different arrangements. |
During the gas injection of the model at a horizontal arrangement, an unfavorable mobility ratio is prone to form fingering, because the low-viscosity fluid (methane) displaces the high-viscosity fluid (water) [12]. In the initial gas injection, the gas-liquid interface started to destabilize at a local position after a short period of movement, and a fingering phenomenon appeared (Fig. 3a ). When the front advanced as fingering to a certain position, due to the changing relative value of capillary pressure and viscous force, the part without fingering began to move as fingering until the gas breakthrough. After the gas formed a dominant pathway, its ability to carry liquid reduced sharply, resulting in a limited sweep efficiency. Finally, the recovery efficiency of gas injection was only 43.2%.
During the gas injection of the model at vertical arrangement, also a process of low-viscosity fluid displacing high- viscosity fluid, the gravity segregation effect due to the density difference between gas and water is opposite to the direction of displacement pressure difference. The buoyancy force acting on the gas phase throughout the displacement process compensates the unfavorable mobility ratio to a large extent, inhibiting the fingering of the front [4]. Therefore, the gas-liquid interface remained relatively stable during the whole migration process, the morphology of the gas-liquid interface varied slightly at different times, and the gas sweep was large (Fig. 3b ). The final recovery efficiency of gas injection reached 78.6%, much higher than that in the horizontal arrangement scheme.
2.2. Mechanical mechanism of stable gas-liquid interface
By comparing Scheme 2 and Scheme 3, it can be known that the gas-liquid interface shows a stable migration state. The rates in both schemes can be considered as stable displacement rates. By tracing the evolution of the gas-liquid interface through image processing techniques, the recovery efficiency of gas injection can be calculated at different times. The migration rate of a point on the gas-liquid interface at a certain time is defined as the ratio of the vertical distance between the point and the injection end to the experimental time. The average of the migration rates at the front and the ends of the gas-liquid interface is defined as the average migration rate of the interface. The relationship between the average migration rate or recovery efficiency of gas injection and the experimental time was plotted (Fig. 4 ). Based on the average migration rate of the interface, the method of Grattoni et al. [13] was used to calculate the gravity number and Bond number at different times, which were then compared 1, so as to determine the main controlling mechanical mechanism. An increase of the Bond number to 1 indicates that the fluid flow changes from capillary pressure-dominated to gravity-dominated. A decrease of the gravity number to 1 indicates that the fluid flow changes from gravity-dominated to viscous force-dominated. In this study, the final recovery efficiencies under schemes 2 and 3 are relatively high, reaching 74.7% and 78.6% respectively. The curves of both schemes show a pattern of four stages: unchanged in the initial stage, slow growth in the early stage, rapid growth in the middle stage, and stable in the late stage. There are no values in the initial stage because of the strong compressibility of gas, which causes gas to accumulate and compress at the top until reaching a threshold pressure before starting to flow. The range where each mechanical mechanism plays a leading role is strongly correlated with changes in the average migration rate of the interface and the recovery efficiency of gas injection. The position where the main controlling mechanical mechanism changes occurs at the turning point of the curve, indicating that competition and changes between mechanical mechanisms essentially control the morphology of the gas-liquid interface and the recovery efficiency of gas injection during displacement [14]. In both schemes, the morphology of the gas-liquid interface was dominated by capillary pressure in the early stage, and by gravity in the middle stage when the recovery efficiency increased by 66 percent points in Scheme 2 and by 62 percent points in Scheme 3. After gas breakthrough, the recovery efficiency curve in Scheme 2 is nearly flat, while the recovery efficiency curve in Scheme 3 levels up slightly and further increases by 2 percent points. This indicates that after the displacement by gas injection became stable and gas broke through, the process was dominated by viscous force. The higher the gas injection rate, the stronger the viscous force, which is more conducive to the improvement of recovery efficiency after gas breakthrough. Although schemes 2 and 3 adopt very different gas injection rates, they are similar in zonal division and size of mechanical mechanisms, resulting in almost identical final displacement characteristics. For a stable gravity displacement process, the displacement characteristics before gas breakthrough are dominated by capillary pressure and gravity, but less influenced by viscous force; after gas breakthrough, the displacement process is dominated by viscous force. This result is consistent with the finding in long-core displacement experiments in Reference [15].

Fig. 4 Relationship between average migration rate of the interface, water recovery efficiency of gas injection and the experimental time. |
2.3. Morphology of gas-liquid interface
As the gas injection rate continues to change, the migration law and morphological characteristics of the gas-liquid interface change greatly. Fig. 5 shows the top gas injection process in schemes 4 and 5. At the two injection rates, an unstable displacement process occurs, and the final recovery efficiency is 51.6% and 37.1%, respectively. In Scheme 4, a good sweep appeared in the early stage, without obvious fingering. As the displacement progressed, the gas-liquid interface began to destabilize. At this time, the dynamic balance among gravity, capillary pressure, and viscous force was broken, and viscous force became dominant. Fingering of the gas-liquid interface began to occur locally, and the sweeping ability was weakened. In Scheme 5, an obvious gas fingering was observed in the early stage, and gas breakthrough appeared earlier at the outlet. Therefore, during the construction stage of a UGS, a stable migration of the gas-liquid interface is an effective means of efficiently displacing the water phase, and it can provide a greater storage space for the subsequent cyclic storage-production stage.

Fig. 5 Morphology of gas-liquid interface during top gas injection at different rates. |
3. Change and expansion of UGS capacity in the cyclic storage-production stage
3.1. Fluid occurrence and UGS capacity change after stable gas injection
To clarify the migration and occurrence of fluid within porous media and UGS’s capacity change in the cyclic storage-production stage, multiple cycles of bidirectional low-rate storage-withdrawal experiments with methane injection to displace water phase and bottom water invasion (Scheme 6) were implemented. Through these experiments, the applicability of stable gas injection rate in the lifecycle of UGS was verified. The gas-water distribution in the model after the first four cycles of gas injection-water invasion is shown in Fig. 6. A roughly consistent pattern of gas-water distribution was observed at the end of Cycle 5, so it is not illustrated in the figure. It can be seen that, during Cycle 1 of gas injection, the gas-liquid interface was relatively stable, and a large amount of continuous residual water phase stayed near the bottom of the production well. The recovery efficiency was 78.6%. During Cycle 1 of bottom water invasion, the invaded water usually flowed along the pores with preexisting water phase, but rarely penetrated the pores occupied by gas phase. At this time, the isolated residual water phase was gradually merged, and a huge gas-occupied space unswept by water phase remained in the pores even when continuous water breakthrough appeared at the top of the model. The water saturation in the model was 76.3%. During Cycle 2 of gas injection, obvious advancement of gas-liquid interface could be observed, and the occurrence of residual water phase was more complex than that at the end of Cycle 1. The recovery efficiency was 56.8%. At this time, the gas saturation in the model was 68.6%. After Cycle 2 of bottom water invasion, the fluid occurred more dispersedly and distributed more complexly, the water phase flowed in a similar manner to the previous process of bottom water invasion, the bypassing of water phase was more obvious, and the bound gas volume further increased. At the end of water invasion, the water saturation was 58.6%, and the gas saturation was 41.4%. During Cycle 3 of gas injection, no obvious gas-liquid interface could be observed, the gas breakthrough time reduced greatly, and the bound water volume further increased. The recovery efficiency was 37.6%. The water saturation was 53.3%, and the gas saturation was 46.7%. The water saturation after Cycle 3 of bottom water invasion was 55.5%. In the subsequent cycles, the water recovery by gas injection further reduced, the flow capacity of water phase and gas phase was further weakened, and the occurrence of fluid gradually reached an equilibrium to disable flow.

Fig. 6 Fluid occurrence state in each stage of multi-cycle storage-withdrawal at constant low rate after UGS construction by stable gas injection. |
Generally, with the increase of storage-production cycles, the fluid within the porous media tends to occur more dispersedly and distribute more complexly. Flow bypass is a universal phenomenon in the process of gas injection and water invasion. A large amount of gas is bound and sealed in the pores by capillary pressure to become immovable trapped gas. The flow capabilities of both gas and water phases are gradually weakened. The gas-water interlock impedes the reutilization of pore space, leading to a lower rate pore space employment. The gas phase saturation zone is gradually transformed into a gas-water transition zone, which leads to the decrease of effective storage capacity and the loss of working gas volume.
The gas saturation at the end of each cycle of gas injection is defined as the storage capacity ratio, and the gas saturation at the end of gas withdrawal/bottom water invasion as the cushion gas ratio. The difference between the storage capacity ratio and the cushion gas ratio is determined as the working gas ratio. The variation of UGS parameters with the operation cycles was plotted (Fig. 7 ). It can be found that with the UGS operation cycles, the recovery efficiency, storage capacity ratio, and working gas ratio gradually decrease, while the cushion gas ratio increases. After 4 cycles, the occurrence state of the fluid in the porous media almost does not change greatly. At this time, the distribution of the two-phase fluid is complex, and the driving force cannot overcome the additional resistance caused by the dispersion of the non-wetting phase into the discontinuous phase at the pore throat. Capillary resistance becomes gradually dominant to seriously hinder the fluid flow. As a result, the storage capacity fails to further expand.

Fig. 7 Operation parameters of multi-cycle storage-production at constant low rate after UGS construction by stable gas injection. |
3.2. Fluid occurrence and UGS capacity change after unstable gas injection
In the actual operation of UGS, storage-production at a high rate is often adopted to achieve peak shaving in a short period of time. The flow rate of fluid near the wellbore is often much higher than that between injection and production wells during reservoir development. The high pressure gradient near the wellbore also affects the flow behaviors of the fluid. In order to control the unfavorable trend of continuous decrease of storage capacity ratio caused by low storage-production rate, the fluid occurrence and storage capacity change in multi-cycle storage-production at a constant high rate after UGS construction by unstable gas injection at high rate (unstable migration of gas-liquid interface) were investigated in Scheme 7. The fluid distribution at the end of each cycle is shown in Fig. 8 . The variation of UGS parameters with the operation cycles was determined and plotted (Fig. 9 ).
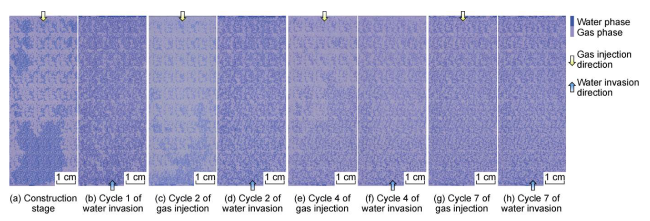
Fig. 8 Fluid occurrence state in each stage of multi-cycle storage-production at constant high rate after UGS construction by unstable gas injection. |
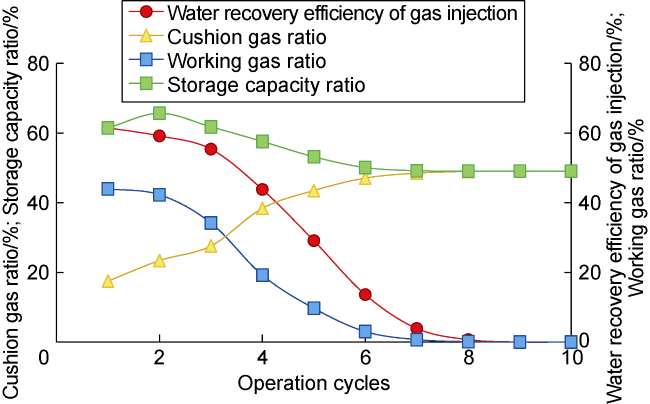
Fig. 9 Operation parameters of multi-cycle storage-production at constant high rate after UGS construction by unstable gas injection. |
In Fig. 8 and Fig. 9 , after the construction stage, the residual water phase shows a continuous distribution, and it is mostly distributed in the lower part of the model. The residual water phase becomes uniformly dispersed with the increase of storage-production cycles. After 7 cycles, the occurrence state of the residual water phase almost did not change, reaching a hydraulically stable state. With the increase of gas injection cycles, the recovery efficiency decreases gradually. In the construction stage, the recovery efficiency of gas injection is 61.5%. In the cyclic storage-production stage, the recovery efficiency reduces to 43.8% at the end of Cycle 4 of gas injection and to 3.9% at the end of Cycle 7 of gas injection, which means basically no ability to drive water. In the early stage of the UGS operation, a higher gas injection rate will produce a strong viscous force. The viscous force and gravity are sufficient to overcome the increasing capillary resistance. Thus, the water displacement capacity before Cycle 7 is high (higher than that during the storage-production at constant low rate). At the time of Cycle 7, the capillary resistance increases, the fluid flow becomes more difficult, and the operation efficiency of the UGS is greatly reduced. Compared with the initial state, the storage capacity ratio increases by 4.2 and 0.3 percent points in Cycle 2 and Cycle 3, respectively. The UGS capacity can still be expanded at this stage. The storage capacity ratio continues to decrease since Cycle 4. After Cycle 7, the parameters such as storage capacity ratio and recovery efficiency of gas injection no longer change. Thus, when the fluid occurrence state is dispersed, there will be additional resistance, and the gas-water two-phase coexistence area will seriously affect the operation efficiency, capacity expansion period and final capacity of the UGS.
3.3. Efficient capacity expansion control of UGS
As analyzed above, a relatively low gas injection rate can ensure the stability of gas-liquid interface migration, while a high gas storage-production rate can prolong the effective operation cycle of UGS. However, keeping the gas storage-production rate constant cannot meet the demand of UGS capacity expansion for gas supply. Thus, Scheme 8 was designed as the injection-withdrawal rate is increased by cycles to continuously change the mechanical mechanism of fluid, and investigate the influence on fluid flow, occurrence, and gas storage-production efficiency. Fig. 10 shows the fluid distribution at the end of each cycle, and Fig. 11 illustrates the variation of the operation parameters of UGS.
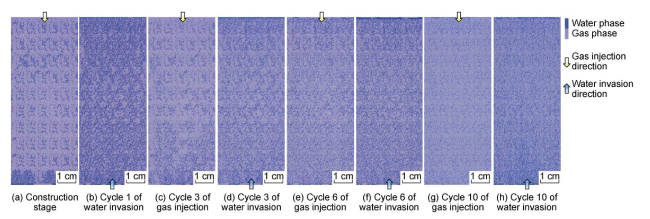
Fig. 10 Fluid occurrence state in each stage of multi-cycle storage-production at accelerated rate after UGS construction by stable gas injection. |
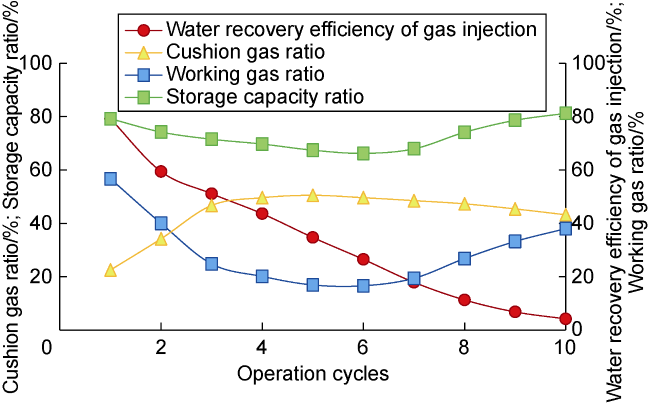
Fig. 11 Operation parameters of multi-cycle storage-production at accelerated rate after UGS construction by stable gas injection. |
In Fig. 10 and Fig. 11 , in the construction stage of UGS, a relatively low gas injection rate (1 μL/min) can expand the sweep efficiency, with the recovery efficiency of gas injection up to 79.2%, providing efficient pore space for gas storage to support the subsequent cyclic storage-production stage. In the cyclic storage-production stage, after Cycle 1 of water invasion, the water phase can occupy the main pore space in a contiguous manner, the water saturation in the model is 77.5%, and the bound gas saturation is low at 22.5%. At this time, the flow resistance of the water phase is weak. At the end of Cycle 3 of gas injection, the recovery efficiency of gas injection is 51.1%, and the bound gas saturation increases to 34.2% at the end of water invasion. In Cycle 6, the driving force induced by gas injection rate is still weak. At this time, the operation law of the UGS is similar to that in the experiment of storage-production at constant rate, but the recovery efficiency, storage capacity ratio and working gas ratio are significantly lower. The gradually increasing viscous force can still be highly capable of water displacement and capacity expansion. Different from the experiment of gas storage-production at a constant rate, as the gas injection cycles continue to increase, the residual water phase is distributed more dispersedly and, overall, uniformly, and the storage capacity ratio increases gradually with the removal of residual water, by 15.0 percent points from 66.2% in Cycle 6 to 81.2% in Cycle 10. An obvious gas-liquid interface can still be observed in the process of gas injection in the cyclic storage-production stage, indicating that the increase of gas injection rate can effectively drive the bound fluid that cannot be displaced by a smaller force, and continuously break the hydraulic stability of the fluid in the pore. Such change of mechanical mechanism has a significant effect in promoting the efficient construction and operation of the UGS. In the late stage of UGS operation (after 6 cycles), the water phase is mostly distributed in small pores in a small and isolated form, while the gas phase is connected and distributed in large pores. The bound water has little effect on the gas phase flow, which makes the storage capacity ratio increase instead of decrease, and rise continuously along with the subsequent operation, reflecting the UGS capacity expansion. After water invasion, the connectivity of the water phase is still weak, and the continuously increasing gas injection rate can still overcome the capillary resistance to displace the water phase, improve the UGS capacity, and inhibit the occurrence of gas-water interlocking, which reduces the cushion gas ratio and increases the working gas ratio. This fully embodies the ability of this method to reduce the low-efficiency gas storage area of gas-water transition and expand the high-efficiency area.
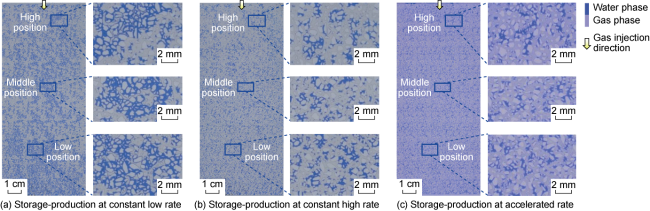
3.4. Microscopic fluid occurrence state in different UGS operation modes
Fig. 12 Microscopic occurrence state of fluid after 10 cycles in different UGS operation modes. |
Overall, increasing the gas storage-production rate can continuously improve the ability of gas displacement, overcome the rising capillary resistance at the pore throat, and continuously displace the water phase to allow the gas phase to occupy the main flowing space, thereby improving the gas storage efficiency. Moreover, in the subsequent process of storage-production at a high rate, the resistance during gas injection and production can be reduced to improve the efficiency of gas storage and production. Therefore, for the multi-cycle operation of UGS, the storage-production at low rate should be adopted initially to ensure the stable migration of the gas-liquid interface for purpose of maximizing the gas storage efficiency of the pores; gradually, the operation transits to high rate [3], to ensure that there is sufficient driving force to overcome the increasing flow resistance and expand the gas storage space and flow channels, thereby meeting the goals of capacity expansion for peak shaving of UGS.
4. Conclusions
Under the condition without considering the macroscopic heterogeneity of the actual reservoir, the pore- scale microscopic simulation experiment show that: In the construction stage of UGS, the gas injection rate should be controlled, and the effect of gravity should be fully utilized to ensure the macroscopically stable migration of the gas-liquid interface and greatly improve the gas sweep efficiency, providing a greater storage space for the subsequent cyclic storage-production stage. In the cyclic storage-production stage of UGS, the pore space utilization efficiency is low at a constant gas storage-production rate. Increasing the storage-production rate can continuously break the balanced stress state of the fluid in the pores and expand the gas storage pore space and flow channels, thereby facilitating the capacity expansion of UGS for peak shaving.