

Introduction
The Qaidam Basin is surrounded by three mountains, i.e., Qilian, Kunlun and Altun, NW China. The basin is 850 km long from east to west, and 350 km wide from south to north. It covers an area of approximately 12.1× 10⁴ km2 with an effective hydrocarbon exploration area of 9.6×10⁴ km2 [1]. The Sanhu Depression is in the middle area of the Qaidam Basin and contains abundant biogas recourses in the 3 000 m thick Quaternary sediments [2], with proved biogas initially-in-place of about 3 000×108 m3 [3]. As the main source of gas reserves and production in Qinghai oil field, the three major gas fields in Sanhu Depression, i.e., Sebei-1, Sebei-2, and Tainan, have produced over 50×108 m3 gas annually for 13 consecutive years [4-5].
Multiple techniques, e.g. surface structures [6], remote sensing anomalies [7], aeromagnetic and aerial radiometric anomalies [8], gravity, magnetic, and electrical anomalies [9], geochemical methane anomalies [10], and microbial anomalies [11], were used during the past over 60 years of biogas exploration and development in the Sanhu Depression. The seismic exploration in early days mainly used P-wave seismic data. Techniques of gas reservoir detection with multiple seismic attributes [12], seismic frequency reduction [13], gradient attenuation [14], and pre- stack amplitude variation with offset (AVO) inversion [15] have played an active role in the exploration of structural traps. It is becoming more and more difficult to stabilize gas production from the three major gas fields. Recent exploration practices revealed that in addition to structural gas reservoirs [16], lithological gas reservoirs have been discovered [17]. Gas preserving capacity of mudrocks was proved by Well seyeH3-1. Therefore, the exploration focus has been expanded gradually from sandstones at structural traps to sandstones and mudstones at structural highs, slopes and depressions [18]. However, due to the gas preserved in strata of the gas fields, P-wave seismic events are pulled down, resulting in inaccurate structural maps [19]. Although P-wave and S-wave joint interpretation [20], converted-wave seismic processing [21], multi-wave and multi-component seismic [22-23], amplitude abnormality eliminating [24], and stochastic modelling [25] were explored by former studies, most are geophysical discussions based on S-wave 2D seismic data. Limited by data quality and methodology, there is no literature referring to precise restoration of structural morphology and establishment of isochronous stratigraphic framework, let alone any report on restoring sedimentary facies and predicting reservoir physical properties under an isochronous stratigraphic framework.
In 2020, a large-scale P-wave and S-wave seismic joint acquisition was completed in the Taidong area (the study area), which is located in northwestern Sanhu Depression, westside of the Sebei-1 gas field. The high-quality 9-component S-wave 3D seismic dataset is not disturbed by gas interference [26]. Fine well-seismic calibration was conducted based on the 9-component S-wave 3D seismic dataset, and then a fourth-order isochronous stratigraphic framework was set up. Under this framework, the 9-component S-wave 3D seismic dataset was used in seismic sedimentology study. Seismic geomorphology (model-driven, qualitative analysis) and seismic lithology (data-driven, quantitative analysis) were coupled. A technology workflow, i.e., phase rotation, frequency decomposition and fusion, stratal slicing, seismic attribute principal component analysis (PCA), and random fitting, was established to solve two major issues: one is sedimentary facies features and evolution in critical periods; the other is sandstone reservoir properties and distribution.
1. Geological setting
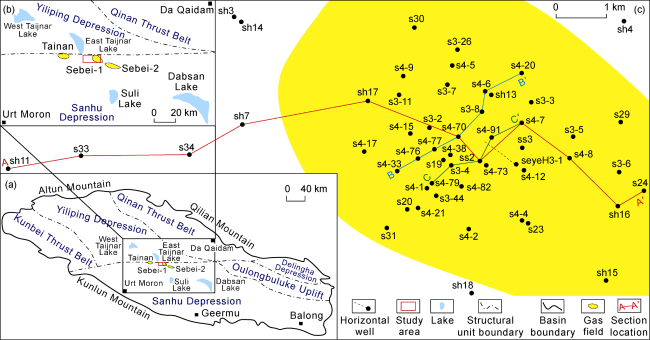
The Qaidam Basin was sandwiched between the Qinling-Qilian-Kunlun geosyncline fold belt after being separated from the Tarim-Sino-Korean Plate [27]. The Proterzoic crystalline basement and Paleozoic fold basement were formed after the Indosinian Movement [28]. From the Mesozoic to the Cenozoic, the basin experienced four tectonic movements, i.e., rifting in Early and Middle Jurassic, compression from Late Jurassic to Cretaceous, reginal compression and local strike-slip from Paleogene to Late Pliocene, and compressional fold depression from Late Pliocene to Quaternary, leading to several petroleum systems [29]. At present time, the Qaidam Basin is surrounded by three mountains with alternating uplifts and depressions in the basin. It can be divided into the following six first-order structural units, i.e., Sanhu Depression, Oulongbuluke Uplift, Delingha Depression, Kunbei Thrust Belt, Yiliping Depression and Qinan Thrust Belt [30] (Fig. 1 ).
The Sanhu Depression (where “Sanhu” means three lakes) is named after the three surface lakes, i.e., East Taijnar, Suli and Dabsan. The Quaternary loose and weak-diagenetic strata in the depression are rich in biogas. The Pleistocene Qigequan Formation can be divided into 14 marker beds, i.e., K0-K13, from top downward [31-32]. The K3-K12 are the beds where biogas is concentrated (Fig. 2a ). The lacustrine mudstones in dark color formed in deep water of large lake area during the Middle Pleistocene are high-quality gas source rocks. The lacustrine mudstones formed in a steady lake basin during the Late Pleistocene are both good gas source rocks and regional cap rocks [33].
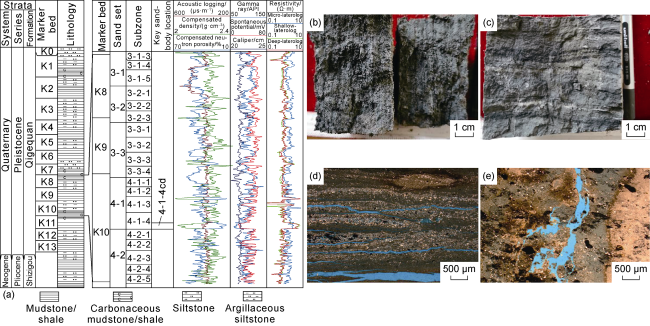
Fig. 2. Stratigraphic column and photos of typical well cores and thin-sections in the Sanhu Depression, Qaidam Basin (modified from Reference [31]). (a) Stratigraphic column and location of the key sandbody (4-1-4cd) in Sanhu Depression; (b) Dark gray laminated silty mudstone, Well st1, 1 282.70 m; (c) Gray striped aragonite silty mudstone, Well st1, 1 309.00 m; (d) Interbed fractures, intergranular pores in debris, and intercrystalline pores in clay minerals, Well st1, 1 282.70 m; (e) Intercrystalline pores in clay minerals, Well st1, 1 309.00 m. |
Sediments in the Qigequan Formation (0.73-2.80 Ma) went through four stages, i.e., lake basin formation in the Early Pleistocene (K13-K10, 2.35-2.80 Ma), lake basin heyday in the Middle Pleistocene (K9-K6, 1.94-2.35 Ma), lake basin steady in the Middle-Late Pleistocene (K5-K3, 1.51-1.94 Ma), and lake basin shrinkage in the Late Pleistocene (K2-K0, 0.73-1.51 Ma) [16,34]. In terms of the average sedimentation duration of each single marker bed, i.e., 0.11 Ma in K13-K10, 0.10 Ma in K9-K6, 0.14 Ma in K5-K3 and 0.39 Ma in K2-K0 [16], they all belong to the fourth-order sequences [35]. Five critical periods when K13, K10, K8, K4, and K1 formed were studied in this paper.
In the Early Pleistocene, the lake basin migrated to the Sanhu Depression, with small lake area, shallow water, and abundant source materials. Alluvial fans and fluvial-flooding plains were formed. The semi-deep lake was located near the East Taijnar-Suli-Dabsan lakes. In the Middle Pleistocene, the lake basin was in its heyday with risen water level, enlarged lake area, and decreased source materials. Alluvial fans and deltas shrunk gradually. In the Middle and the Late Pleistocene, the lake basin was steady with peak fluctuating lake level, wide lake area, and weak source materials. In the Late Pleistocene, the lake basin shrank into a smaller lake area [36].
The Qigequan Formation in the Sanhu Depression is composed of mudstone, silty mudstone, and argillaceous siltstone mainly in gray, dark gray, grayish yellow or brownish yellow, which are loose and with weak diagenesis. The grain size generally becomes finer upward [37]. The reservoir properties are good, e.g., the average porosity is 20% in mudstones [4] and even higher in sandstones. Facilitated by methanogens, the beds are rich in biogas [38]. The inorganic gas derived from deep sources may also contribute [39].
3D seismic data used in Taidong area is distributed in the northwest of Sanhu Depression and western part of Sebei-1 gas field (Fig. 1 ). Seismic geomorphology was used to restore typical sedimentary facies of K13-K0, while seismic lithology was utilized to calculate reservoir thickness, porosity, and permeability of the key sandbody.
2. Data and methodology
2.1. Well and seismic data
The Sebei-1 gas filed in the study area has been developed for a long time with abundant data of exploration, appraisal and development wells. Framework wells were selected to calibrate well and seismic (S-wave) data and set up an isochronous stratigraphy framework, for tracking the interfaces of marker beds. The gamma ray (GR) logs can help indicating sandstone and mudstone, i.e., high GR values correspond to mudstones [40], which effectively compensates for the shortage of high-quality logging data caused by loose and weak-diagenetic lithologies (Fig. 2b-2e ). The reservoir thickness and properties (i.e., porosity and permeability) of 27 wells obtained by interpretating well logs and testing samples from the key sandbody of K10 were used to carry out quantitative seismic lithological study. Twenty wells were used as calculating wells, while the rest seven wells were used as blind testing wells (Table 1 ).
Table 1. Key reservoir parameters of the key sandbody of K10 in Qigequan Formation in the study area |
| No. | Well | Sandbody thickness/ m | Reservoir thickness/ m | Poro- sity/% | Perme- ability/ 10−3 μm2 | Remarks |
|---|---|---|---|---|---|---|
| 1 | s3-11 | 6.30 | 2.90 | 26.80 | 6.60 | Calculating wells |
| 2 | s3-26 | 5.50 | 3.80 | 25.50 | 7.60 | Calculating wells |
| 3 | s3-3 | 8.64 | 5.00 | 25.90 | 3.30 | Calculating wells |
| 4 | s3-5 | 7.06 | 4.80 | 26.00 | 8.90 | Calculating wells |
| 5 | s3-8 | 6.75 | 3.65 | 27.10 | 11.30 | Calculating wells |
| 6 | s4-1 | 8.34 | 3.40 | 27.70 | 3.30 | Calculating wells |
| 7 | s4-12 | 7.72 | 5.00 | 29.10 | 17.50 | Calculating wells |
| 8 | s4-17 | 8.24 | 4.40 | 22.80 | 7.20 | Calculating wells |
| 9 | s4-2 | 7.10 | 2.63 | 25.40 | 8.00 | Calculating wells |
| 10 | s4-21 | 6.86 | 2.60 | 25.80 | 9.70 | Calculating wells |
| 11 | s4-38 | 6.40 | 3.70 | 26.40 | 8.40 | Calculating wells |
| 12 | ss2 | 7.59 | 6.77 | 30.40 | 17.70 | Calculating wells |
| 13 | s4-6 | 6.66 | 3.45 | 25.70 | 27.60 | Calculating wells |
| 14 | s4-70 | 8.38 | 7.55 | 37.10 | 199.80 | Calculating wells |
| 15 | s4-73 | 6.96 | 6.54 | 31.90 | 140.10 | Calculating wells |
| 16 | s4-77 | 8.17 | 3.72 | 23.40 | 26.20 | Calculating wells |
| 17 | s4-79 | 7.73 | 4.93 | 23.10 | 29.50 | Calculating wells |
| 18 | s4-8 | 9.02 | 4.87 | 20.80 | 9.20 | Calculating wells |
| 19 | s4-9 | 6.06 | 4.90 | 25.00 | 7.20 | Calculating wells |
| 20 | ss3 | 8.44 | 4.65 | 25.70 | 7.39 | Calculating wells |
| 21 | s3-2 | 7.16 | 3.30 | 27.60 | 11.70 | Blind testing wells |
| 22 | s3-6 | 7.40 | 6.00 | 24.80 | 6.20 | Blind testing wells |
| 23 | s3-7 | 7.92 | 4.10 | 26.05 | 7.90 | Blind testing wells |
| 24 | s4-15 | 6.06 | 4.90 | 23.17 | 6.37 | Blind testing wells |
| 25 | s4-33 | 7.49 | 4.17 | 22.90 | 5.10 | Blind testing wells |
| 26 | s4-76 | 7.98 | 3.80 | 18.50 | 20.90 | Blind testing wells |
| 27 | s4-82 | 9.20 | 4.95 | 12.90 | 4.50 | Blind testing wells |
The P-wave seismic profile in Taidong area reflects poor lateral continuity of events, with rapidly changing frequency and energy. Especially in the east of Well sh17 within the scope of the gas field, high gas saturation leads to decreased frequency and pulled down events. It is, therefore, impossible to interpret P-wave seismic data (Fig. 3a ). Although with the influence of near-surface structural anomalies, the main reason for frequency- decrease and pulling down of P-wave seismic events is the gas preserved in beds [20]. In comparison, the isochronous framework built by interpreting the well-calibrated S-wave seismic data is more reliable since S-wave events are not interfered by gas-bearing property and can truly reflect the underground structure. Comparison between the P-wave and S-wave profiles indicates that the real strata become shallow from Well sh11 to Well s24, but the gas leads to seismic events frequency-decrease and pulling down on the P-wave seismic profile, which is quite different with the real structural features (Fig. 3 ). The reflecting energy, frequency, and continuity on the S-wave seismic profile in the study area (both in the gas field and outside of the gas field) are relatively consistent, which can be used to track boundaries of marker beds (Fig. 3b ).
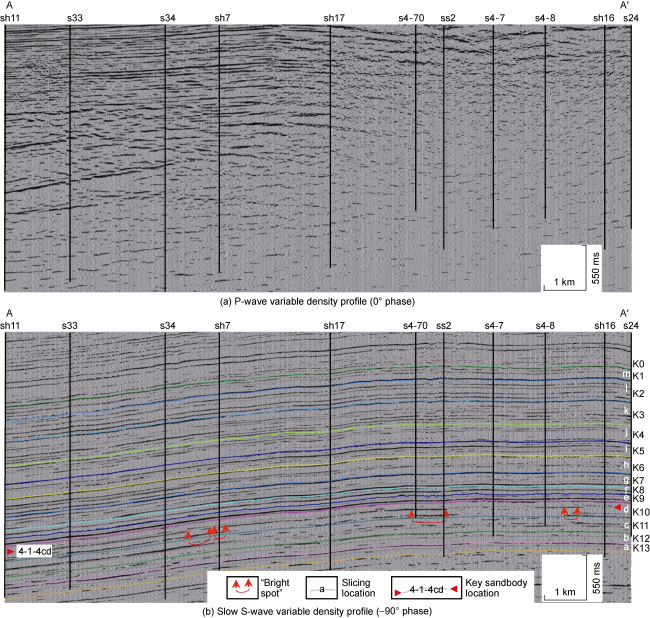
Fig. 3. Seismic profiles of P-wave and S-wave in the study area (see |
The Taidong 9-component S-wave 3D seismic survey covers an area of 82.5 km2 (Fig. 1 ), with the bin size of 20 m×10 m, the sampling interval of 2 ms, and the effective bandwidth of 5-60 Hz. The dominant frequency in the target zone is 26 Hz. Shear waves propagating in anisotropic formations will split into fast shear waves and slow shear waves, and the latter used in this study have higher amplitudes [41].
With the deepening of biogas exploration in Sanhu Depression, exploration in strata deeper than K9 began. The 4-1-4cd sandbody of the 4-1-4 subzone in 4-1 sand set middle of K10 becomes an important target (Figs. 2a and 3b). The 4-1-4cd sandbody is relatively thick (5.50- 9.20 m, 7.45 m on average) and steadily distributed. The slow S-wave interval velocity is about 1 300 m/s. Accordingly, the calculated time thickness of the sandbody is about 6 ms. Therefore, the time window used to extract seismic attributes is 12 ms (two-way travel time). Considering three conditions, i.e., thickness of single sandbody measured from well logs, effective S-wave bandwidth and the dominant frequency, 7, 25, and 35 Hz are tested to be the appropriate dominant frequencies for the three decomposed seismic sub-cubes.
2.2. Methodology and workflow
Seismic sedimentology, used in this study, includes seismic geomorphology and seismic lithology. Seismic geomorphological technologies are composed by phase rotation [42-43], wavelet frequency decomposition, red- green-blue (RGB) fusion, and stratal slicing [44⇓⇓-47]. In the fusion process, the low-frequency sub-cube is expressed by red, high-frequency by blue, and moderate-frequency by green. Correspondingly, red indicates thick strata, blue indicates thin, and green indicates moderate thickness on the RGB fused slices. Drilling activities confirm that the three primary colors stand for sedimentary structures with different thickness [48], which provides a theoretical basis for restoring seismic geomorphological features of critical periods. Phase rotation, seismic attribute extraction, PCA, and random fitting were combined into seismic lithological techniques [48-49]. Based on data from well drilling, well logs and sample testing, reservoir thickness and properties were calculated for the 4-1-4cd sandbody. Seismic geomorphology distinguishes sedimentary structure and geomorphologic features qualitatively, while seismic lithology provides lithological meanings to seismic geomorphology and calculates reservoir parameters. The overall workflow coupling seismic geomorphology and seismic lithology is summarized in Fig. 4.
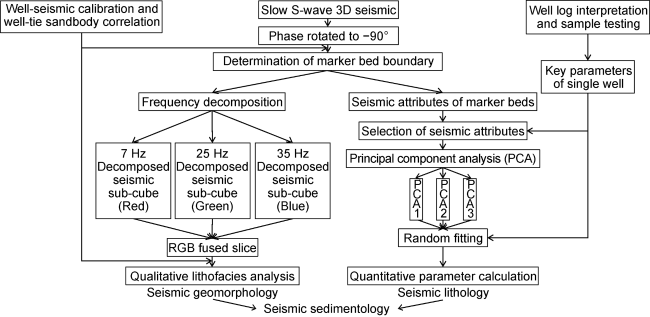
Fig. 4. Research workflow of seismic sedimentology. |
3. Qualitative analysis of sedimentary facies by seismic geomorphology
3.1. Set up the isochronous stratigraphic framework by S-wave seismic data
The structure of the study area is generally broad and gentle, which is higher in the east and lower in the west. The eastern higher part is the Sebei-1 gas field. Affected by gas, seismic events are pulled down on the P-wave seismic profiles, which cannot be used to perform structural interpretation. The early structural maps are mainly derived from interpolating well data.
An isochronous stratigraphic framework was established with the S-wave data. The seismic reflected energy tends to increase from the bottom K13 to the top K0. Seismic events have poor continuity, low frequency, and relatively low amplitude in K13 to K10; good continuity, relatively high frequency, and high amplitude in K9 to K6; moderate continuity, relatively low frequency, and moderate amplitude in K5 to K4; good continuity, high frequency, and relatively high amplitude in K3 to K2; and poor continuity, low frequency, and overall low amplitude in K1. According to the frequency, amplitude, and energy revealed by seismic profiles, as well as well logs, two transgressive-regressive cycles were interpreted. The lake level deepened from K13 to K10, shallowed from K9 to K6, deepened from K5 to K3, and shallowed again from K2 to K0.
3.2. Seismic geomorphological characterization
According to the S-wave 3D seismic interpretation, the time thickness from K13 base to K0 base is 2 124-2 398 ms. Isochronous stratal slices were generated with a time step of 2 ms. Restricted by vertical seismic resolution, adjacent slices usually reflect similar geological phenomena. In this study, a representative slice for each typical marker bed (Fig. 3b ) was selected to analyze seismic geomorphological features according to the correlating relationship between the fused color and bed thickness.
Single beds in K13 are relatively thick in the east. Seven channels were identified, whose length varies from 3.6 km to 18.5 km, single-channel width from 45.0 m to 244.0 m, flowing from east to west or from southeast to northwest. Channel ① is the shortest, and meets Channel ④. Channel ⑦ extends 14.2 km westward into Channel ⑤ (Fig. 5a ). The sediments in channels ①-④ are relatively thick, while other channels hold mainly moderate to thick sediments in the upstream and thin sediments in the downstream.
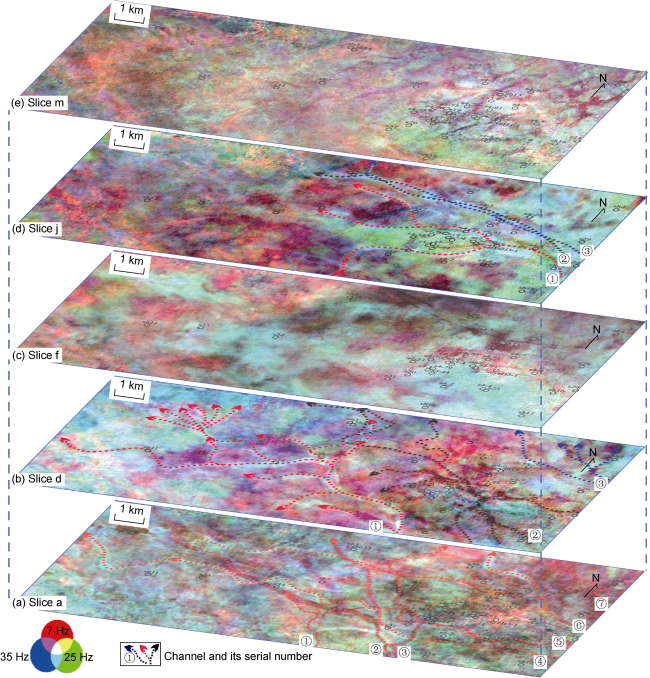
Fig. 5. RGB fused slices of critical periods in Qigequan Formation in the study area (see |
There are three sets (two large and one small) of channel systems in K10. All the three systems have branching phenomena (Fig. 5b ), indicating that clastic materials were unloaded after being transported over a short distance at that time. The south Channel set ① covers the largest area, while the north Channel set ③ is the smallest.
K8 possesses no channels in the study area. It has moderate to thin single beds in the east and moderate to thick beds in the west judged from colors on the fused slice (Fig. 5c ). Lateral differentiation of single-bed thickness is enhanced in K4, i.e., thin in the east and thick in the west. Three channels, flowing roughly from east to west, appear in the study area (Fig. 5d ). Channel ① obviously branches, while the other two are single channels, with a length of 6.6-11.1 km and a width of 50.0-155.0 m.
The fused slice of K1 shows that there are mainly moderate sediments in the study area, with ring-like features in the east part (Fig. 5e ).
3.3. Lithofacies anatomy of the key target layer
The slice corresponding to the key sandbody 4-1-4cd (Fig. 6a ) shows that single beds are thicker in the middle of the study area and thinner in the eastern and western sides. Three sets of channel systems, all branch at downstream, can be interpreted on the slice. In fact, this kind of sedimentary phenomena are also observed in the modern Dabsan Lake at the surface of Sanhu Depression (Fig. 6b ). A satellite image shows that the terrain of the Dabsan Lake is gentle, with channels frequently branching and merging, and flowing from southeast to northwest. Obvious similarities between the satellite image and the fused slice d in K10 ensure that the present sediment is the key to the past sedimentary environment. The responses of Channels ① and ② can be seen on the nearly east-to-west well-(S-wave) seismic profile: the profile section from Well s34 to Well sh7 passes through Channel ① (partly outside of the channel); the profile section from Well s4-70 to Well ss2 and from Well s4-8 to Well sh16 passes Channel ②. Locations corresponding to the channels on the fused slices appear as "bright spots" on the profile (Fig. 3b ).
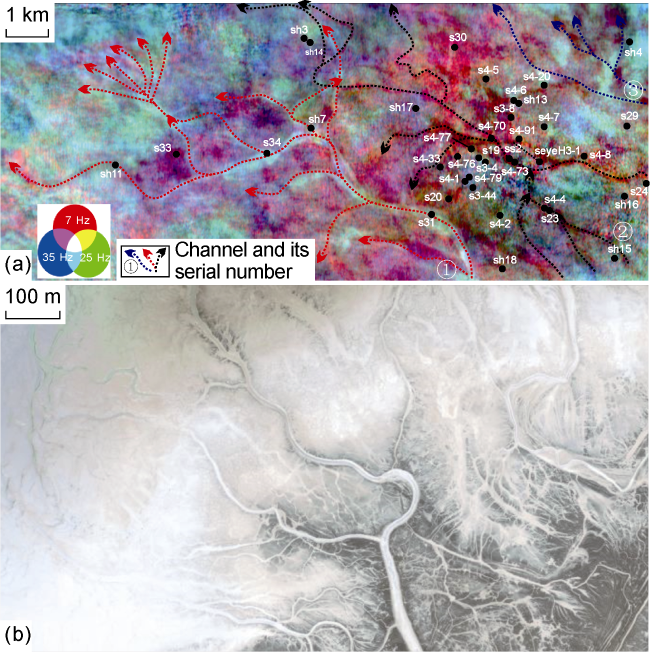
Fig. 6. Typical RGB fused slice of K10 in the study area (a) and the satellite image of the modern Dabsan Lake (b). |
Considering more wells were drilled in the area where Channel ② is located, two well profiles (i.e., B-B’ and C-C’) crossing the channel system were selected to analyze the stratigraphy and sandbody structures and to assist the interpretation of RGB fused slices. The well profiles (Fig. 7 ) show that single sandbodies in the wells located at two sides of the main channel are thin (1-2 m on average), corresponding to the finger-shaped GR log. The single sandbodies in the wells located inside of the main channel are thick (3-6 m on average), corresponding to the box-shaped or bell-shaped GR log. Judging from colors on the RGB fused slice (Fig. 6a ), the main channel is purple to red (standing for thick beds), and areas at two sides of the main channel are blue to green (standing for thin beds), which is consistent with the thickness of the sandbodies revealed by the two well profiles (Fig. 7 ). Thick sandbodies in the main channel correspond to "bright spots" on the seismic profile.
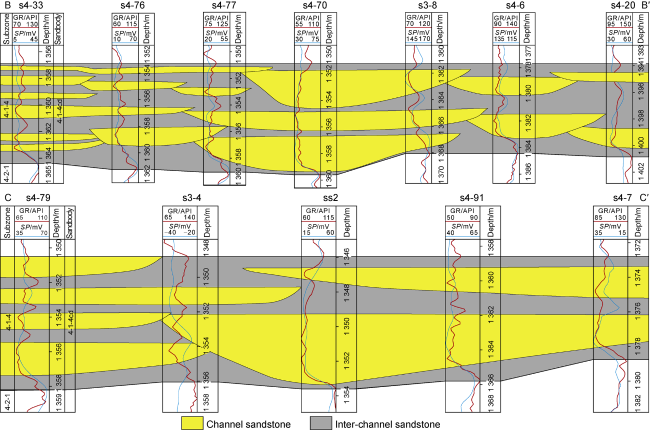
Fig. 7. Well profiles of the key sandbody in the study area (see |
It is known from the well-seismic calibration that Channel ① has wider single channels, broader drainage area, but thinner sandbodies (0.5-1.5 m for single sandbody thickness in the 4-1-4cd sandbody of wells s34 and sh7, according to statistics) than Channel ②. Analyzing from colors on the fused slice, thickness of the sandbodies changes at different locations of a single channel, reflecting uneven flow energy there. The analyzing results have verified the geological meanings of colors on the RGB fused slices and provided a basis for the interpretation of sedimentary environment.
3.4. Interpretation of sedimentary environment for critical intervals
Combining the regional structure and sedimentary background, sedimentary environment features and the evolution of the representative critical intervals, i.e., K13, K10, K8, K4, and K1 in the study area were interpreted based on seismic geomorphological characteristics revealed by fused slices.
In K13, the lake began to form with limited scope. Channels are crisscrossed in a large area. Sedimentary facies are mainly delta front and shallow lake, with more underwater distributary channels in the delta front (Fig. 8a ).
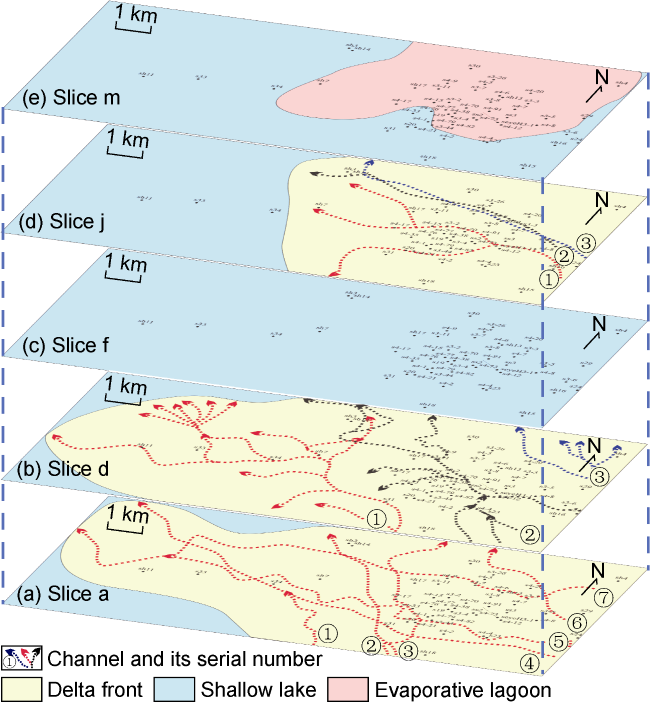
Fig. 8. Sedimentary facies of critical intervals in Qigequan Formation in the study area. |
In K10, due to the relatively abundant rainfall, channels occurred in a larger area with wide main channels and narrow branched channels. The western shallow lake shrank while delta front shifted slightly to the west (Fig. 8b ).
In K8, the lake basin entered its heyday. Channels disappear in the lacustrine environment, with shallow lake in the whole region (Fig. 8c ). Mudrock core samples were tested to obtain such key parameters as Ca/Mg, Sr/Ba, and SiO2/Al2O3 values (Table 2 ). Previous studies indicated that the Ca/Mg value was positively related to paleotemperature [50], i.e., high values represent hot weather. The Sr/Ba value is positively correlated with paleosalinity [51], i.e., high values represent salinization. The SiO2/Al2O3 value is bounded by 4, with values greater than 4 indicating arid climate [52]. For samples in the study area, the Ca/Mg values are 0.96-3.37, with an average of 2.23; the Sr/Ba values are 0.17-0.42, with an average of 0.31; and the SiO2/Al2O3 values are 3.24-3.78, with an average of 3.50. Compared with the Xujiahe Formation in the Sichuan Basin [51], the higher Ca/Mg and Sr/Ba values in K8 indicate higher paleotemperature and paleosalinity in the study area. The SiO2/Al2O3 value is smaller than 4, reflecting a relatively humid climate. It is comprehensively judged that the climate in K8 was hot with less rainfall. In the lacustrine area, the volume of water evaporation was greater than the injection, resulting in high salinity.
Table 2. Element and mineral analysis of Well tn18 in K8 in Sanhu Depression, Qaidam Basin |
| Depth/m | Lithology | Ca/Mg | Sr/Ba | SiO2/Al2O3 |
|---|---|---|---|---|
| 1 589.05 | Gray mudstone | 3.37 | 0.29 | 3.78 |
| 1 590.90 | Gray argillaceous siltstone | 1.88 | 0.31 | 3.47 |
| 1 592.50 | Gray mudstone | 3.00 | 0.17 | 3.66 |
| 1 595.73 | Gray mudstone | 1.92 | 0.42 | 3.39 |
| 1 599.30 | Gray mudstone | 2.25 | 0.39 | 3.48 |
| 1 604.13 | Gray mudstone | 0.96 | 0.29 | 3.24 |
In K4, the lake became shallower and the sedimentary environment changed significantly. Western part of the study area was shallow lake, while eastern part was delta front. Three channels appeared, with Channel ① branching at the downstream direction (Fig. 8d ).
In K1, as the tectonic uplifting and climate drying, the lake basin became smaller with relatively restricted water environment [36], with the predominant facies of shallow lake. An evaporative lagoon appeared in the eastern part of the study area (Fig. 8e ).
4. Quantitative calculation of reservoir properties by seismic lithology
For the 4-1-4cd sandbody, a 12 ms time window was taken to extract and select 35 optimal seismic attributes. The attributes were correlated to geological parameters of 20 calculating wells, deriving the correlation coefficients of seismic attributes with geological parameters, i.e., reservoir thickness, porosity and permeability (Table 3 ). Ranked by the correlation coefficients in a descending order, three attribute combinations were formed to fit and calculate reservoir thickness, porosity, and permeability. The absolute values of correlation coefficient for reservoir thickness, porosity, and permeability were chosen to be 0.379, 0.348, and 0.350 as thresholds, respectively. Then the corresponding number of seismic attributes for the three geological parameters was 10, 8, and 11, respectively.
Table 3. Correlation coefficients between seismic attributes and geological parameters of the key sandbody in the study area |
| Seismic attribute | Correlation coefficient | ||
|---|---|---|---|
| Reservoir thickness | Porosity | Permeability | |
| Avg_Energy | 0.339 | 0.348 | 0.017 |
| Avg_SNR | 0.231 | −0.436 | 0.009 |
| Avg_ABS_Amp | 0.354 | 0.360 | 0.027 |
| Avg_Inst_Freq | 0.335 | −0.209 | 0.098 |
| Avg_Inst_Phase | 0.132 | 0.153 | 0.084 |
| Avg_Peak_Amp | 0.138 | 0.035 | −0.272 |
| Avg_Refl_Str | 0.344 | 0.326 | 0.145 |
| Avg_Trough_Amp | 0.435 | 0.079 | 0.375 |
| Corr_Length | −0.383 | −0.023 | −0.372 |
| Energy_Half_Time | 0.210 | −0.064 | 0.211 |
| K-L_Complexity | 0.521 | 0.108 | 0.439 |
| Kurtosis_in_Amp | −0.072 | 0.105 | 0.050 |
| Max_ABS_Amp | 0.313 | 0.351 | 0.053 |
| Max_Peak_Amp | 0.101 | 0.038 | −0.152 |
| Max_Trough_Amp | 0.442 | 0.056 | 0.357 |
| Max_Value | 0.093 | 0.034 | −0.160 |
| Mean_Amplitude | -0.247 | −0.115 | −0.378 |
| Min_Value | -0.402 | −0.062 | −0.299 |
| Num_of_Troughs | 0.379 | 0.322 | 0.454 |
| Number_of_Peaks | 0 | 0.020 | −0.251 |
| Percent_Above | 0.024 | 0.085 | −0.134 |
| Percent_Below | −0.024 | −0.085 | 0.134 |
| PrinComp_P1 | −0.520 | −0.093 | −0.424 |
| PrinComp_P2 | 0.521 | 0.108 | 0.439 |
| PrinComp_P3 | −0.458 | −0.093 | 0.037 |
| RMS_Amplitude | 0.339 | 0.348 | 0.017 |
| Skew_in_Amp | 0.162 | 0.172 | 0.410 |
| Slope_Half_Time | 0.158 | 0.308 | −0.066 |
| Slope_Inst_Freq | −0.299 | −0.357 | −0.294 |
| Slope_Refl_Str | −0.351 | −0.318 | −0.196 |
| Thickness_of_Amp | −0.258 | −0.179 | −0.350 |
| Total_ABS_Amp | 0.354 | 0.360 | 0.027 |
| Total_Amplitude | −0.247 | −0.115 | −0.378 |
| Total_Energy | 0.339 | 0.348 | 0.017 |
| Variance_in_Amp | 0.411 | 0.163 | 0.102 |
4.1. Reservoir thickness
Exploration in the Qigequan Formation shows that 10% can be taken as a lower limit of porosity for reservoir in the study area. The first 10 seismic attributes that have high correlation coefficients with the reservoir thickness were analyzed by the PCA method, resulting in 10 principal components (Table 4 ). Each of the components is calculated by weighting the 10 attributes and they are linearly uncorrelated with each other. The first three components cover 89.81% of the total effective information and were chosen to fit with well-derived reservoir thickness. The workflow can not only preserve sufficient effective information in the attributes, but also reduce the difficulty in the fitting operation.
Table 4. PCA results of reservoir thickness of the key sandbody in the study area |
| Principal component | Information proportion/% | Eigen value | Attribute with max. contribution (weight) |
|---|---|---|---|
| PCA1 | 55.638 31 | 0.057 36 | Corr_Length |
| PCA2 | 27.506 82 | 0.028 36 | Corr_Length |
| PCA3 | 6.667 81 | 0.006 87 | Num_of_Troughs |
| PCA4 | 3.880 87 | 0.004 00 | Variance_in_Amp |
| PCA5 | 3.264 24 | 0.003 37 | Min_Value |
| PCA6 | 2.073 91 | 0.002 14 | PrinComp_P2 |
| PCA7 | 0.498 37 | 0.000 51 | PrinComp_P1 |
| PCA8 | 0.295 54 | 0.000 03 | Avg_Trough_Amp |
| PCA9 | 0.135 41 | 0.000 14 | PrinComp_P3 |
| PCA10 | 0.038 71 | 0.000 04 | K-L_Complexity |
The random fitting technique was applied by the following equation with a correlation coefficient of 0.79.
The first three components were substituted into Eq. (1) to calculate the distribution of reservoir thickness (Fig. 9 ). The calculated results indicate that thickness of the widely dispersal reservoir in 4-1-4cd sandbody varies from 0 m to 6 m in the study area. The reservoir continuity of main gas field in the southeast is good, which becomes poor toward the northwest. The thickness difference of reservoir is obvious in the middle area.
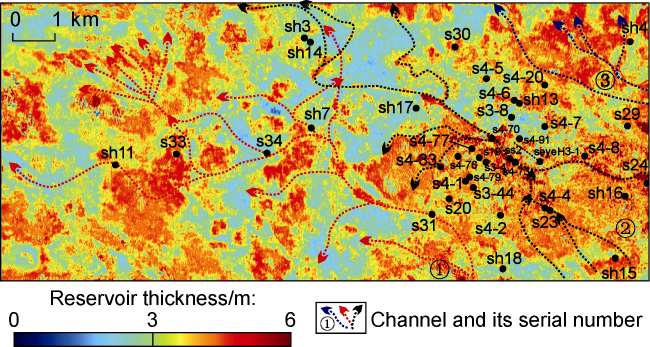
Fig. 9. Overlay of reservoir thickness and channels of the key sandbody in the study area. |
4.2. Reservoir porosity
The same workflow was applied to the different eight seismic attributes that have high correlation coefficients with reservoir porosity (Table 3 ). The resulted principal components by PCA method were fitted with porosity in wells. Eq. (2) was found to have the best correlation with a correlation coefficient of 0.86. The calculated distribution of reservoir porosity is shown in Fig. 10.
The reservoir porosity is generally high (up to 30%), with the main reasons including loose sedimentation, weak diagenesis and small burial depth. In a plane view, the central-west of the study area possesses the highest porosity (up to 30%) with relatively good continuity, while the porosity in the east is lower (22%-26%) with good homogeneity.
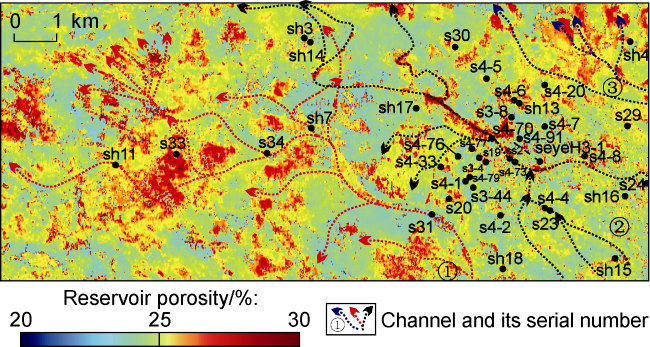
Fig. 10. Overlay of reservoir porosity and channels of the key sandbody in the study area. |
4.3. Reservoir permeability
Reservoir permeability is an important factor in determining single well productivity. Eleven seismic attributes that have high correlation coefficients with reservoir permeability were used to perform PCA (Table 3 ) by the same workflow as reservoir thickness and porosity. The resulted three principal components were substituted into Eq. (3) and the calculated distribution of permeability is shown in Fig. 11.
According to the calculated results, the reservoir permeability in the study area ranges from 1×10⁻³ μm2 to 20×10−3 μm2. The permeability in the eastern main gas field is laterally continuous and generally greater than 12×10−3 μm2. High permeability is also found locally in the west, but it is less continuous laterally. The permeability in the middle area is relatively low, which is lower than 10×10−3 μm2.
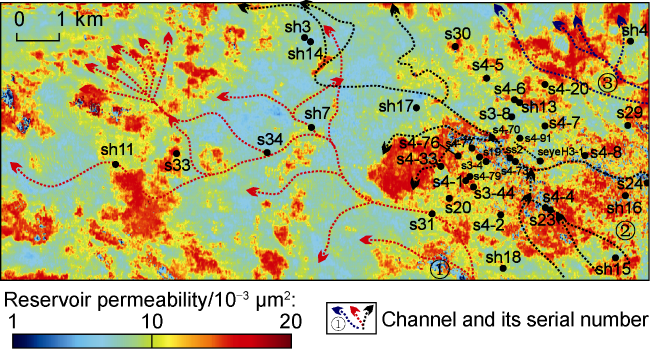
Fig. 11. Overlay of reservoir permeability and channels of the key sandbody in the study area. |
4.4. Calculation results verification
Seismic lithology driven by well and seismic data was employed to calculate the planar distribution of reservoir thickness, porosity, and permeability. Data from 20 wells were used, and the remaining seven wells that did not participate in the calculation process were projected on the crossplots as blind-testing wells (Fig. 12 ). It is found that the seven blind-testing wells follow the same overall trend with the 20 calculating wells for the three geological parameters, among which the agreement for the porosity and permeability is especially higher.
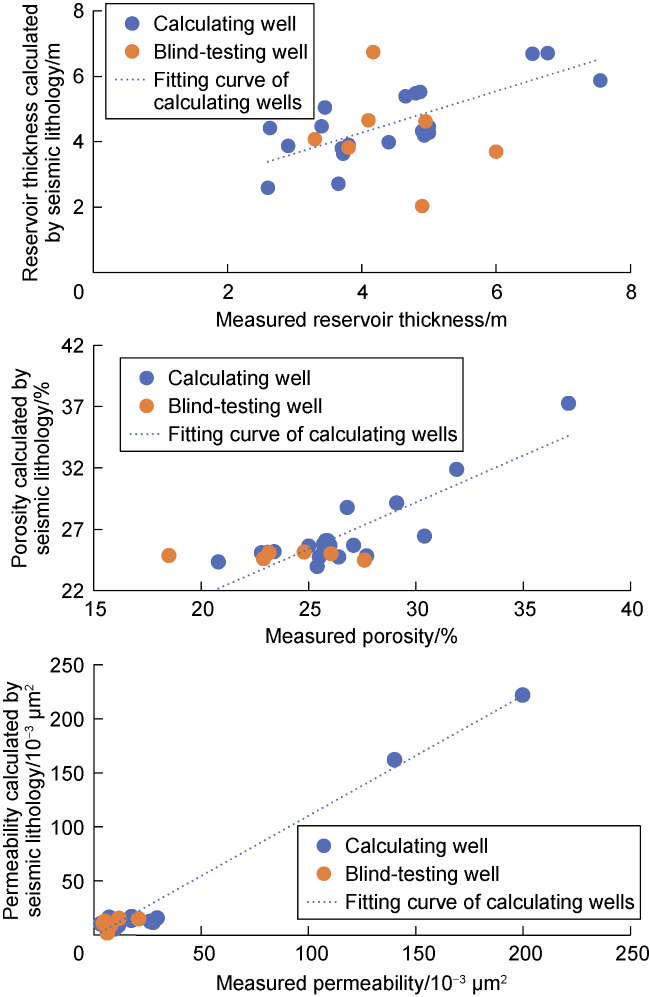
Fig. 12. Verification of reservoir thickness, porosity and permeability results of the key sandbody in the study area. |
5. Facies-controlled reservoir features and prediction of favorable areas
5.1. Controlling effect of facies on the reservoir
The horizon (base of K9) flattening method was attempted to restore paleogeomorphology of the key sandbody 4-1-4cd during its deposition (Fig. 13 ). Given the gentle and stable structure and weak diagenesis in the study area, the effect of tectonic fractures and diagenesis on reservoir properties is relatively weak. Therefore, the paper follows the facies-controlling theory to analyze reservoir thickness, properties, and distribution from the following aspects, i.e., the geomorphology controls sediments and sedimentary facies control the reservoir.
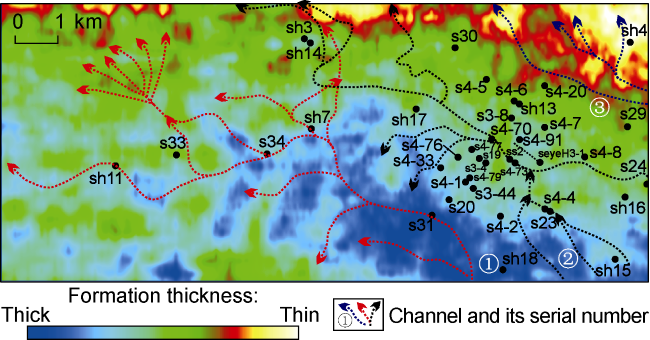
Fig. 13. Overlay of landform and channels of the key sandbody in the study area. |
Previous studies have proved that valleys holding channels are generally located in low-lying terrains [53]. The distribution of channels when the key sandbody formed characterized by well and seismic data was overlayed with the paleogeomorphology, suggesting generally a gentle terrain which is high in the north and low in the south. According to the interpreted sedimentary facies, shallow lake was in the west, while delta front was in the east. There are three channel systems (①-③) from south to north, which are located in different geomorphological segments. Specifically, Channel ① is located in the lowest terrain with largest drainage area, with the main channels distributed along the lower area.
The main channels have strong hydrodynamics, thick sandbodies with large grain sizes, which are conducive to reservoir development. The areas with branch channels have weak hydrodynamics and small grain sizes, but can also develop effective reservoirs. Judging from the planar features, branch channels in the east are the main factor governing reservoir distribution; while the lake flow in the west may further reshape the planar distribution of the reservoir (Fig. 9 ). The quantitatively calculated planar distribution characteristics of reservoir porosity and permeability are generally consistent with the reservoir thickness despite of some local differences. High-porosity areas are mainly located in the areas related to channels. Especially in the east, high-porosity areas are concentrated in the main channels (Fig. 10 ). The perme-ability of channel sandbodies formed in the delta front is relatively high. The permeability of main channels is slightly higher than that of branch channels, which indicates that both sedimentary environment and hydrodynamic conditions control the permeability.
5.2. Prediction of favorable areas
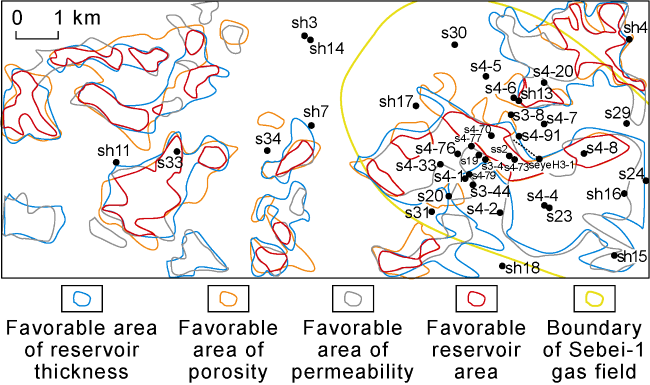
Using well logging and S-wave seismic data, the plane distribution of geological parameters in the key sandbody was calculated by seismic lithological methods. Combining the actual conditions in the study area, 4 m, 23%, and 10×10−3 μm2 were taken as the lower thresholds for reservoir thickness, porosity and permeability, to delineate the range of favorable areas for the three parameters, respectively. The three ranges were then superimposed, resulting in 19 predicted favorable reservoir areas in K10, whose total area is 10.584 km2 (Fig. 14 ).
Fig. 14. Favorable reservoir area of the key sandbody in the study area. |
Favorable reservoirs in K10 are widely distributed in the study area. The total area of 13 favorable reservoir areas in the west outside of the main gas field is 5.499 km2, which indicates further extending space of the gas field to the west. Furthermore, lots of channels were recognized in K13 with large scale of sandstone reservoirs, and similar sedimentary environment that may occur abundant channel sandbodies was discovered in K11 to K12. The above findings indicate an optimistic future to explore biogas in K10 to K13. Therefore, biogas exploration in Taidong area should be expanded to the peripheral western area and deeper beds of Sebei-1 gas field.
6. Conclusions
An analytical method of sediment and reservoir was proposed based on 9-component S-wave 3D seismic data. The workflow of the method is as following. The Pleistocene Qigequan Formation in Taidong area Sanhu Depression Qaidam Basin was taken as an example. Based on 9-component S-wave 3D seismic data and satellite images, techniques of phase rotation, frequency decomposition, RGB fusion, and stratal slicing were utilized to qualitatively characterize sedimentary facies in the study area by model-driven seismic geomorphology. Further quantitative research can be conducted on the physical properties of sandstone reservoirs.
There were two cycles in the Pleistocene Qigequan Formation in Taidong area with three synchronal sets of underwater distributary channel systems, and seven distributary channels in one period. Channel sandstones in the lower cycle are thick and broad. Affected by paleoclimate and paleogeomorphology, the predominant facies were delta front and shallow lake. The two cycles of channel occurrence-development-destruction reveal that the lake became deeper from K13 to K10, shallower from K9 to K6, deeper from K5 to K3, and shallower again from K2 to K0.
Quantitatively analyzing of reservoir properties in the loose sandstone area shows that sandbodies in the underwater distributary channels possess the best physical properties. Based on sample testing and well log interpretation, techniques of phase rotation, seismic attribute extraction, PCA, and random fitting were employed to quantitatively calculate reservoir thickness, porosity, and permeability in the 4-1-4cd key sandbody in K10 of Qigequan Formation in the study area by data-driven seismic lithology. The calculated results indicate that the reservoir is controlled by underwater distributary channels and is widely developed with superior physical properties.
Underwater distributary channel sandstone reservoirs in K10 of Qigequan Formation spread to a large area west of Sebei-1 gas field, which provides parameter accordance to extend the gas field to the west. The favorable reservoir area of the key sandbody in K10 is predicted to be 10.584 km2 by superposing favorable areas of reservoir thickness, porosity and permeability. Over 50% of the favorable reservoir area is in the western peripheral area of the Sebei-1 gas field, which is a favorable direction for the biogas exploration.
Nomenclature
a1, a2, a3—values of the first three principal components related to the reservoir thickness at well locations, dimensionless;
b1, b2, b3—values of the first three principal components related to the porosity at well locations, dimensionless;
c1, c2, c3—values of the first three principal components related to the permeability at well locations, dimensionless;
GR—gamma ray, API;
SP—spontaneous potential, mV;
x—the reservoir thickness at well locations, m;
y—the porosity at well locations, %;
z—the permeability at well locations, 10−3 μm2.