

Introduction
At present, China is continuously increasing its exploration and development efforts for shale oil, with new achievements made in the exploration and development of shale oil reservoirs in Jiyang Depression of the Bohai Bay Basin [1⇓⇓⇓⇓⇓-7], Qingcheng oilfield of the Ordos Basin [8-9], and Gulong Sag of the Songliao Basin [10⇓-12]. The economic development of shale oil mainly relies on horizontal well drilling and volume fracturing technology. The stimulated reservoir volume (SRV) of shale oil is mostly based on fracability evaluation, and significant technical and economic effects have been achieved through measures such as significantly increasing the net pressure inside the fracture, intensive fracturing, and enhancing proppant injection [13]. However, there is currently no quantitative method for optimizing the fluid volume intensity for SRV fracturing of shale oil reservoir (the ratio of fracturing fluid volume to the length of the section for each stage, or the ratio of the total fracturing fluid volume to the horizontal section length of the well). There are significant differences in the fracturing fluid volume intensity of different shale oil blocks, with most ranging from 20 m3/m to 30 m3/m and a few exceeding 100 m3/m. Most of these values are based on the experience of neighboring wells, or are obtained by combining reservoir simulation and fracture simulation methods with single-well estimated ultimate recovery (EUR) as the optimization goal. The latter is mainly based on the macroscopic geological parameters of the reservoir for simulation, without considering the impact of the imbibition effect of shale oil reservoir matrix on the permeability and porosity of the matrix near the fractures. The imbibition intensity (the volume of liquid imbibed into the rock over the unit area of the rock) follows the law of high in the early stage and decreasing in the middle and late stages. And there existed a critical value, over which the volume of liquid imbibed into the rock gradually decreases. If the fracturing fluid volume intensity is high enough to cause the imbibition intensity to exceed the critical value, the post fracturing flow-back period and oil breakthrough time will be extended [14].
This paper took Well X-1 in the Biyang Sag of the Nanxiang Basin as an example to obtain the capillary pressure characteristic curve and relative permeability characteristic curve which characterize the forced imbibition process by fitting the forced imbibition law measured by core experiments through core-scale oil reservoir simulation. Then, the two characteristic curves were taken into the macroscopic reservoir model to simulate the post-fracturing soaking process, analyze the influence of fracturing fluid volume intensity on EUR, obtain the optimal fracturing fluid volume intensity parameters, and verify the reliability of the parameters in actual shale oil production wells.
1. Experimental study on forced imbibition
1.1. Imbibition experiments
The advantageous aspect of imbibition is the ability to replace oil with water, while the disadvantageous aspect is the formation damage caused by clay hydration and swelling. As long as the favorable aspect dominates, the shale oil reservoir can fully utilize the imbibition effect to achieve maximum benefits through soaking after fracturing. At present, the imbibition experiments mainly focus on spontaneous imbibition, without considering the influence of post-fracturing fluid net pressure on imbibition, so the experimental conditions differ greatly from the actual situation of the reservoir. Therefore, this paper designed an experimental method for evaluating forced imbibition in rock cores based on low field nuclear magnetic resonance (NMR) monitoring technology. The experimental apparatus is shown in Fig. 1.
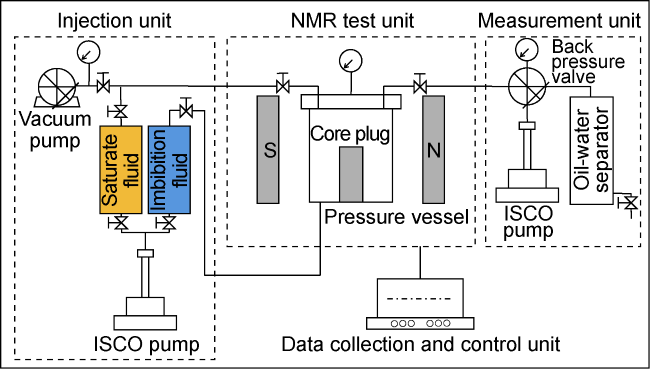
Fig. 1. Schematic diagram of forced imbibition apparatus. |
In the experiment, the low field NMR analyzer was used as the main equipment, and the pressure vessel with piston was used to provide additional fluid pressure to carry out the forced imbibition experiment. Kerosene and deuterium oxide were used to prepare imbibition fluid to eliminate the influence of hydrogen containing fluid on NMR signal. The change of NMR signal in core reflects the reduction of kerosene in core, which can be converted into the oil production and recovery degree of the core contributed by imbibition displacement. A total of 9 core plugs were drilled from the full diameter cores from 2 790.00-2 810.00 m section of X-1 pilot well in the Biyang Sag, including 6 horizontal cores and 3 vertical cores. The gas permeability of the cores is (18-81)×10−9 μm2. The average porosity by NMR logging is 0.93%. The bedding in the cores is developed with bedding fracture density of 1 000-2 000 fractures/m.
The experimental steps are as follows: (1) Use the low field NMR analyzer to test the initial T2 spectrum of dry core sample. Then saturate the core sample with kerosene and measure the T2 spectrum of kerosene-saturated core sample. (2) Place the kerosene-saturated core sample and 2% KCl deuterium solution in a pressure vessel (imbibition tank). (3) Open the valve on the top of the pressure vessel, use the ISCO pump to pressurize the vessel with imbibition fluid until the liquid is discharged from the top valve. Then close the top valve and continue increasing the pressure to required values for the experiment (0.1, 5.0, 10.0 MPa), and keep the ISCO pump at constant pressure; (4) After 0, 3, 7, 14, 21, 24, 30 and 49 d of imbibition, take out the core sample and wipe the surface with cotton yarn for NMR test to obtain T2 spectrum; (5) Put the core samples into the pressure vessel again, and repeat steps (3)-(4) until the end of the experiment; (6) Calculate the T2 spectral area measured at different times, and use Eq. (1) to calculate the recovery degree.
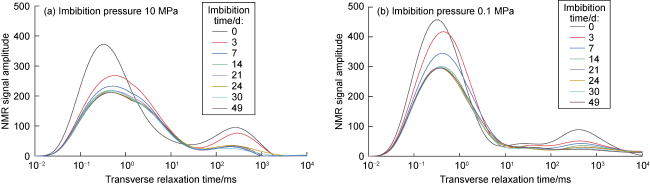
Fig. 2. Distribution of NMR T2 spectrum in imbibition experiment under different pressures. |
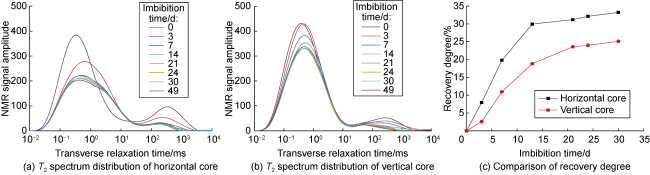
Fig. 3. Comparison of T2 spectrum distribution and oil recovery degree of core imbibition experiment in different directions. |
According to the centrifugal method in the industry standard SY/T 5971-2016 “the performance evaluation method of clay stabilizer for fracturing, acidizing and water injection in oil and gas fields” [15], bentonite and core powder swelling comparison experiment was carried out. The experimental results show that clear water, clay stabilizer (volume fraction of 0.1%, 0.3%, 0.5%) and integrated fracturing fluid system (clear water+0.3% friction reducer+0.1% clay stabilizer+0.3% oil displacement agent) do not cause significant swelling of core powder. The clay minerals in the cores from Well X-1 are mainly illite and illite-smectite mixed layer, and the hydration is not obvious on macro scale. According to the industry standard SY/T 5163-1995 “X-ray diffraction analysis method for relative content of clay minerals in sedimentary rocks” [16], the clay minerals in the core of Well X-1 were extracted to make dry and wet samples. The crystal lattice spacing of dry and wet clay minerals in contact with fracturing fluid for different contact durations was measured, calculated and compared by using X-ray diffraction (XRD), and the swelling degree of clay minerals under hydration was evaluated from the microscopic point of view. Fig. 4 shows the XRD test results of clay minerals in the core of Well X-1. It can be seen that the hydration swelling phenomenon is not obvious near the corresponding crystal lattice spacing of 1.1 nm in the illite and illite-smectite mixed layer, and thus the porosity and permeability reduction effect caused by clay swelling is weak. After fracturing, the critical fluid volume and soaking time should be optimized to ensure the full utilization of the imbibition effect.
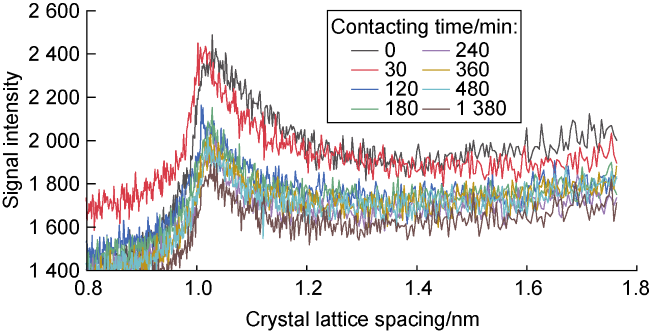
Fig. 4. XRD test results of clay minerals in core of Well X-1. |
1.2. Simulation of forced imbibition
The imbibition experiment shows that the amount of imbibed fluid continues to increase with time, but after reaching a certain time point, the imbibition gradually weakens or even tends to stop, which is the critical point of imbibition The critical imbibition intensity refers to the imbibed fluid volume per unit rock area when imbibition critical point is reached. In order to make full use of imbibition effect, the imbibition chart of the core from the target formation is usually used to optimize the soaking time of shale oil well after fracturing, and the key is to characterize the influence of imbibition pressure on the critical imbibition intensity. Jiang et al. [17] introduced the capillary bundle model proposed by Leverett into dimensionless time model for spontaneous imbibition proposed by Mason, and combined with the variation law of average pore radius with net pressure, built a dimensionless time model for forced imbibition considering the influence of pressure to predict the critical imbibition point at reservoir scale. The average pore radius is calculated according to the Klinkenberg permeability and gas slippage factor, so the model is applicable to the reservoir where the gas permeability decreases with the increase of displacement pressure.
Analysis of experimental results on shale cores of Well X-1 shows that the relationship curve between gas permeability and the reciprocal of average displacement pressure is contrary to the typical curve of gas slippage effect, that is, the gas permeability of cores increases with the increase of displacement pressure (Fig. 5 ). Shen et al. [18] found through the North American shale core experiments that the shale core has the characteristics of developed nano-size pore throat, strong gas adsorption, strong stress sensitivity and non-Darcy flow of fluid, which lead to the deviation of the gas slippage effect characteristic curve, but the phenomenon that increasing in core gas permeability with the increase of displacement pressure is not observed. Combined with NMR results and reservoir lithofacies characteristics, it is believed that the above situation is mainly caused by core stress sensitivity and bedding development. The reservoir in the target area is of laminated lithofacies with developed horizontal beddings. The rock is characterized by medium elastic modulus, high Poisson's ratio, and low mechanical brittleness index. Triaxial tests show that, with plastic failure dominated, the pore space corresponding to the secondary peak area of NMR T2 spectrum curve represents beddings and natural fractures. When the displacement pressure increases, the opening of beddings and natural fractures leads to the increase of gas permeability.
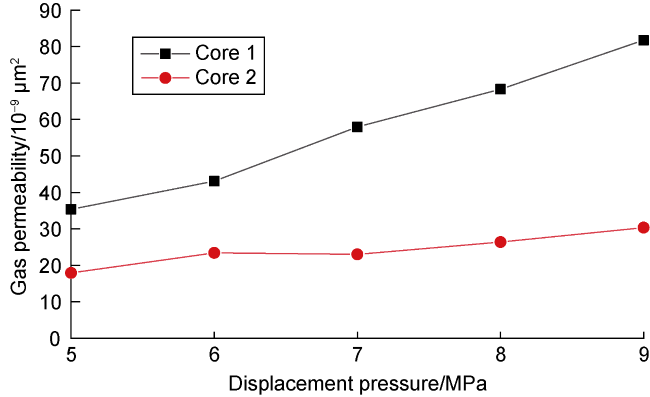
Fig. 5. Variation curve of core gas permeability with displacement pressure (core 1 is horizontal core, and core 2 is vertical core). |
Due to the above characteristics of core gas permeability, it is impossible to calculate the average pore radius based on Klinkenberg permeability and gas slippage factor, or to predict the critical imbibition point and critical imbibition intensity at the reservoir scale using the dimensionless time model for forced imbibition with consideration of pressure effect. Therefore, this paper proposed a prediction method of critical imbibition point and critical imbibition intensity at the reservoir scale based on reservoir numerical simulation method, which uses the idea of introducing pore throat characteristics into the dimensionless time model for forced imbibition proposed by Jiang et al. [17], and obtains capillary pressure characteristic curve and relative permeability characteristic curve by establishing a core scale reservoir simulation model to fit the results of forced imbibition experiments.
The radial grid core model was established by using the GEM component simulator of CMG software. There are 33 grids in the radial direction with size of 0.033 m, 1 grid in the circumferential direction, 110 grids in the longitudinal direction with size of 0.1 m. The porosity is 3.2% and the permeability is 81×10−9 μm2, the water saturation is 47.2%, and the crude oil is simulated with n-dodecane. Under the imbibition pressure of 10 MPa, the core model was used to simulate the influence of five capillary pressure characteristic curves and initial capillary pressure on the core imbibition displacement process, and the sensitivity analysis was carried out (Figs. 6 and 7 ). It can be seen that the core imbibition process is highly sensitive to the form of capillary pressure characteristic curve. By adjusting the form of capillary pressure curve, the imbibition rate, critical imbibition intensity and oil recovery degree can be effectively changed. The initial value of capillary pressure plays a leading role in the imbibition displacement process. With the increase of the initial capillary pressure, the core imbibition displacement rate, the critical imbibition intensity and the oil recovery degree get greater.
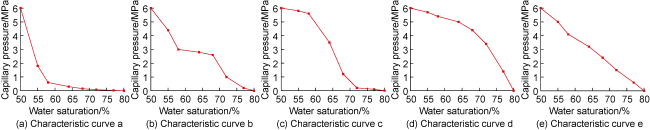
Fig. 6. Capillary pressure characteristic curve for sensitivity analysis. |
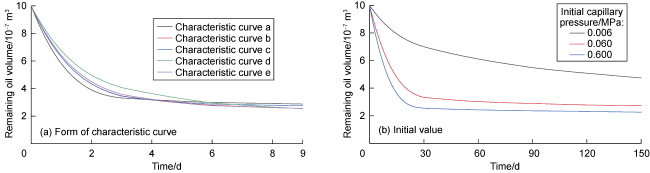
Fig. 7. Effects of curve form and initial value of capillary pressure on imbibition displacement. |
From the fitting results between simulation results of the core model and the imbibition experimental results, it can be seen that the simulation results are in good agreement with the experimental results, which proves the reliability of the core model (Fig. 8a ), and the capillary pressure characteristic curve and relative permeability characteristic curve are obtained (Fig. 8b , 8c ). Because the results of imbibition experiment reflect the characteristics of imbibition pressure, critical imbibition point and critical imbibition intensity, the capillary pressure characteristic curve and relative permeability characteristic curve obtained by fitting could characterize the two physical processes of imbibition and flow and reflect the imbibition pressure, critical imbibition point and critical imbibition intensity at reservoir scale, and could be used for large scale reservoir simulation.
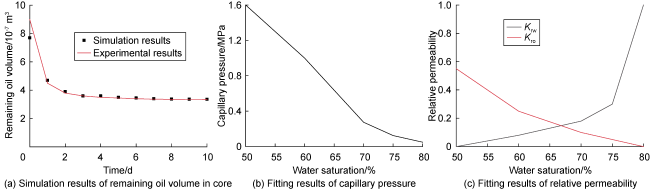
Fig. 8. Fitting results of core scale experiment. |
2. Optimization method of fluid volume intensity for SRV fracturing
To optimize the intensity of fracturing fluid, three requirements should be met: (1) To meet the demand of EUR, fracture parameters and fracturing treatment scales should be optimized. (2) To meet the demand of oil displacement through imbibition, the fracturing fluid volume intensity should be controlled around a critical value to avoid either insufficiency of imbibition displacement caused by insufficient fluid amount or increase of costs and potential of formation damage caused by excessive fluid amount, which can be realized based on the optimization of fracturing fluid volume intensity. (3) To meet the demand of supplementing formation energy, the pore pressure of shale oil reservoir can be improved to a certain extent within the imbibition involving area, which can be achieved through the comprehensive optimization of fracturing fluid volume intensity and soaking time.
2.1. Modeling
The geological structure models (including fault model and horizon model) of the target shale oil reservoir were established based on well and seismic data, by using Petrel software. The fault model was established based on the fault data of seismic interpretation, and the horizon model was established based on the horizon data of seismic interpretation and the drilling layered data. Based on the geological structure models, the attribute model of the target shale oil reservoir was established, which includes sedimentary facies, porosity, permeability, saturation, total organic carbon content, etc. The input values of the target formation in X-1 well block are as follow, the pressure coefficient is 1.05-1.15, the effective porosity is 3.2%-3.9%, the gas permeability is (17.9-81.7)× 10−9 μm2. The total organic carbon content is 2.68%- 3.27%, the oil saturation is 48.4%-52.8%, the crude oil density is 0.860-0.864 g/cm3, and the crude oil viscosity is 28.2-32.6 MPa·s.
CMG software was used to establish the reservoir numerical model, and Fracman fracturing simulation software was used to simulate the distribution of hydraulic fractures and the pressure distribution near the fracture wall and water saturation distribution at the end of fracturing.
2.2. Optimization of fracture parameters
The production data of X-1 well block was used for the history matching of the reservoir model, and the reliability of the model was verified. Then based on the reservoir model and economic evaluation model, the fracture parameters were simulated and optimized, including the number of fractures (or cluster spacing), half-length of support fracture, fracture conductivity and the corresponding data of diverting fractures taking the EUR of single well as the optimization goal.
Reservoir simulation results show that the number of fracturing clusters, half fracture length, fracture height, and conductivity have significant impacts on the EUR. Taking 3×10⁴ m3 of single-well EUR in the target block as the target, considering the fracturing treatment cost, the cluster number is optimized to be around 200, half fracture length is optimized to be 200-220 m, fracture height is optimized to be 20-30 m, and conductivity is optimized to be 5 μm2·cm (Fig. 9 ).
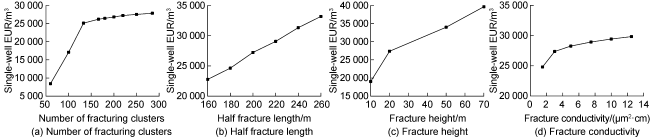
Fig. 9. Optimization results of fracturing parameters. |
2.3. Optimization of fluid volume intensity
2.3.1. Conventional numerical simulation optimization
Based on the above optimized fracture parameters, Meyer fracturing simulation software was used to simulate the propagation of single-cluster fractures in Well X-1 under different fracturing scales. Under the confining pressure of 30 MPa, the elastic modulus of rock cores from target formation is 26.19-40.28 GPa, with an average of 32.98 GPa; the Poisson's ratio ranges from 0.235 to 0.279, with an average of 0.257; the mechanical brittleness index ranges from 0.42 to 0.50, with an average of 0.45. The whole target layer is in normal fault stress state, and the principal stress is arranged in descending order as follows: vertical stress, maximum horizontal principal stress and minimum horizontal principal stress. The maximum horizontal principal stress is 67.41-69.80 MPa, the minimum horizontal principal stress is 57.93-58.94 MPa, and the vertical stress gradient is 2.08-2.11 MPA/100 m. The horizontal stress difference is 8.91-9.64 MPa, with an average of 9.40 MPa. The stress difference coefficient is 0.16. Due to the stress shielding between the sublayers of the target formation, the fracturing treatment adopts the pumping schedule of high viscosity pad fluid + quick increase in pumping rate to promote the fracture to break through the lamina and propagate fully in the longitudinal direction, and gel fluid with multiple temporary plugging in the fracture to promote the fracture to break through multiple lithology in the longitudinal direction and achieve effective penetration. Aiming at the fracture parameters optimized above, the combination of fracturing treatment parameters was determined by simulation, especially the volume intensity of fracturing fluid. Based on optimized fracture parameters and fracture propagation situations, the required fracturing fluid volume is optimized to be 300-400 m3 (Fig. 10 ) for single cluster with the half fracture length of 200-220 m. The intensity of fracturing fluid can be then calculated with the length of horizontal section of the target well and the total number of fractures.
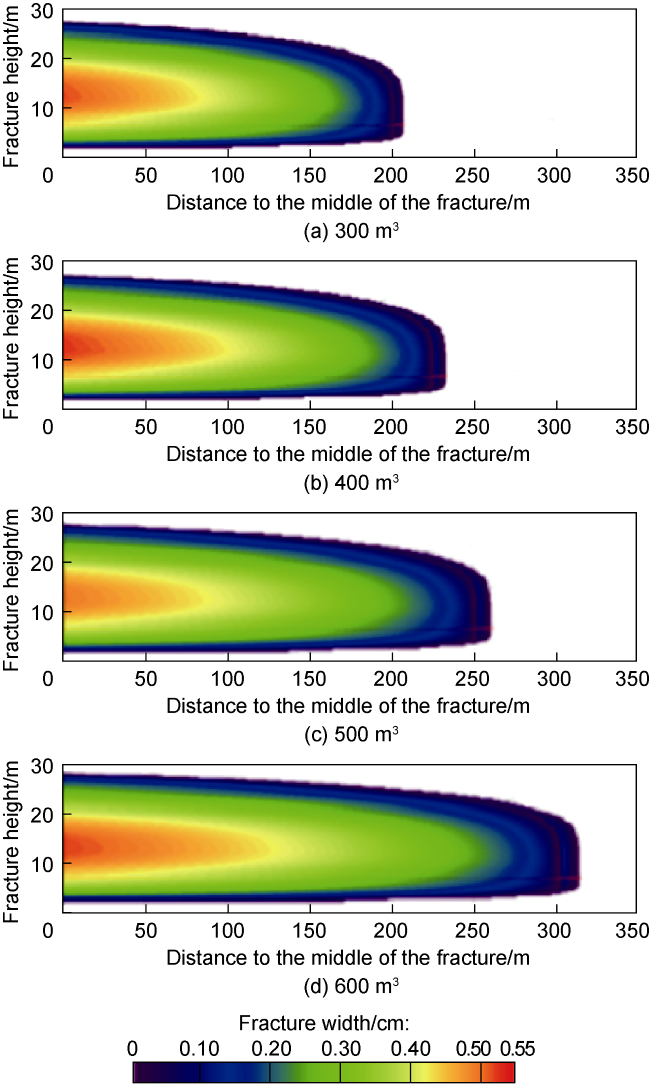
Fig. 10. Fracture simulation results under different fracuring fluid volumes. |
2.3.2. Numerical simulation optimization considering imbibition effect
The capillary pressure characteristic curve and relative permeability characteristic curve obtained from the core scale reservoir simulation model were introduced into the reservoir scale numerical model to characterize the imbibition effect. According to the location of the production well, the corresponding injection well was set. By controlling the water injection parameters, the process of fracturing fluid entering the formation under forced imbibition was equivalently simulated to enable the simulation of the imbibition process, post-fracturing oil-water distribution and post-fracturing productivity. The sensitivity analysis of capillary pressure characteristic curve, soaking time and soaking pressure was carried out. The results show that the imbibition process and its impact on post-fracturing producing could be effectively characterized by adjusting capillary pressure characteristic curve. The post-fracturing productivity could be increased by increasing soaking time and soaking pressure, while the increase amplitude gradually decreases (Fig. 11 ). The above laws are consistent with the core imbibition experiment. Compared with the simulation cases without considering imbibition effect, it can be seen that after the imbibition effect is characterized by the model, the post-fracturing productivity is significantly improved. For field application, the productivity after fracturing treatment can be effectively increased by appropriately increasing the volume intensity of fracturing fluid to supplement formation energy and increase soaking pressure and appropriately increasing soaking time.
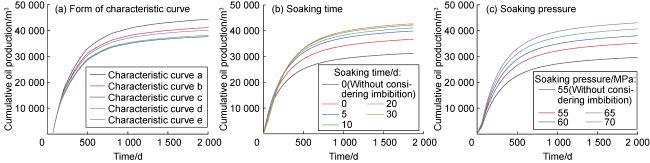
Fig. 11. Sensitivity analysis results of reservoir model to forced imbibition effect. |
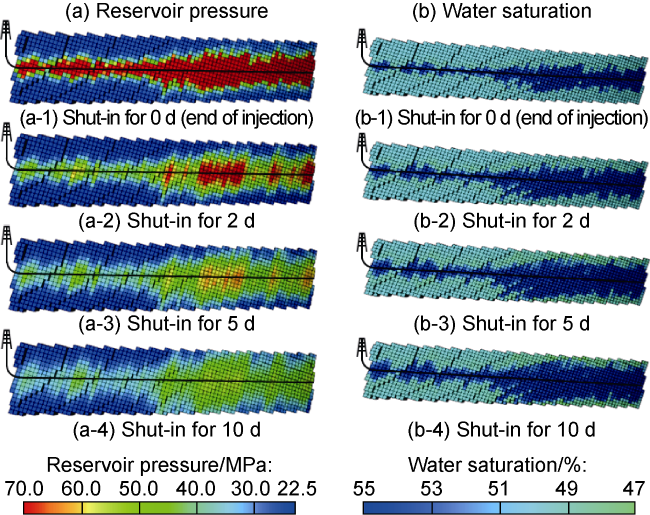
Fig. 12. Pressure and water saturation changes during well soaking. |
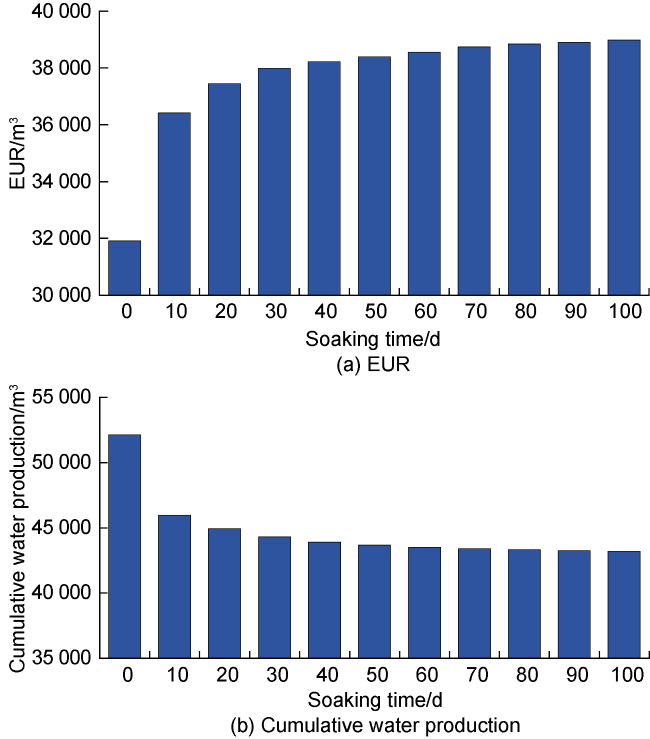
Fig. 13. Influence of soaking time on EUR and cumulative water production. |
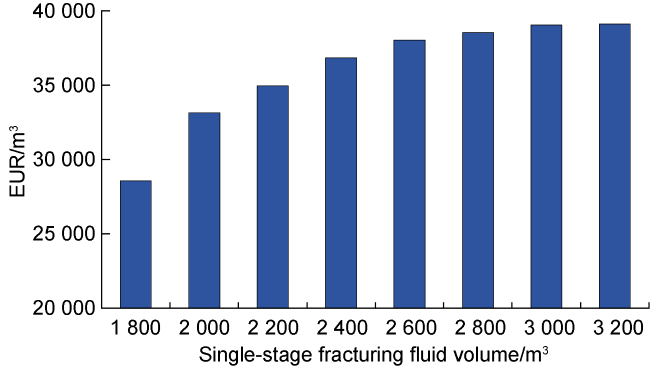
Fig. 14. Impact of single-stage fracturing fluid volume on EUR. |
The critical imbibition intensity is 40.0-43.3 m3/m based on the designed average section length of 60 m.
3. Field application
Well X-1 in the Block X of the target test is designed to be fractured in 33 stages, with an average of 6 clusters in single stage. The critical imbibition intensity optimized by the proposed method is 40.0-43.3 m3/m, and the soaking time is 20-30 d. The fracturing fluid volume intensity optimized by the conventional numerical simulation method is 25.0-33.4 m3/m. The total fracturing fluid volume injected into Well X-1 during fracturing treatment is 87 615.8 m3, and the fluid injection intensity is 43.2 m3/m. After the well was put into production for 160 d, a small nozzle was used for flowback, and the oil production rate gradually increased. After the cumulative oil production reached 350 m3, the wellhead pressure still remained at about 6.7 MPa, and the well was still in the flowing state. The adjacent wells b-1 and b-2 are located in the same horizon and with the same formation pressure coefficient as Well X-1, while the volume intensity of fracturing fluid optimized without considering imbibition effect is 21.2 m3/m and 9.5 m3/m respectively. Wells b-1 and b-2 were not optimized for the soaking process, and the plug was drilled and blowout was conducted immediately after the completion of fracturing treatment. Well X-1 was designed to soak for 20-30 d. Considering that each stage of Well X-1 would be in the soaking state after the completion of fracturing treatment, the well was soaked only for 10 d after the completion of fracturing treatment. When the cumulative oil production of wells b-1 and b-2 reached 350 m3 and 48 m3 respectively, the wellhead pressure was not high enough to maintain the flowing, so the production was continued by mechanical pumping. After the cumulative oil production of wells b-1 and b-2 reached 1 400 m3 and 2 900 m3, the production was stopped due to insufficient formation energy. In comparison, after 400 d of production, Well X-1 still maintained stable production, with a daily oil production of about 10 m3 and tubing pressure of more than 1.5 MPa. The cumulative oil production of Well X-1 has reached 3 100 m3, while the continuous decline of water production did not have a significant impact on oil production. It can be seen that the effect of this method to optimize the fracturing fluid volume intensity of Well X-1 is remarkable.
4. Conclusions
The optimization of the volume intensity of fracturing fluid must consider that hydraulic fracturing should meet the needs of EUR, oil displacement through imbibition, and supplementing formation energy. Furthermore, the volume intensity of fracturing fluid should be controlled around the critical imbibition intensity to avoid either insufficiency of imbibition displacement caused by insufficient fluid amount or increase of costs and potential of formation damage caused by excessive fluid amount. Fracturing fluid volume intensity is positively correlated with single-well EUR and has an optimal value above which the single-well EUR increase rate keeps decreasing. By appropriately increasing the volume intensity of fracturing fluid to supplement formation energy and increase soaking pressure, and appropriately increasing the soaking time, the productivity after fracturing can be effectively increased.
This paper took Well X-1 in the Biyang Sag of the Nanxiang Basin as an example, and comprehensively applied the integrated optimization method combining geological modeling, reservoir numerical simulation, and fracture simulation and imbibition experiment to develop an optimization method for the volume intensity of fracturing fluid in shale oil reservoirs. Field test results prove the practicality of this optimization method of fracturing fluid volume intensity on significant enhancement of shale oil well production. It is highly applicable to shale oil reservoirs with low hydration swelling of clay minerals and the need to improve reservoir energy and oil recovery through post-fracturing soaking and imbibition.
Nomenclature
Kro, Krw—relative permeability of oil phase and water phase, dimensionless;
S0—integral area of T2 spectrum curve of initial core sample;
S1—integral area of T2 spectrum curve of oil-saturated core sample;
Si—integral area of T2 spectrum curve of core sample after imbibition;
Ro—oil recovery degree of imbibition test, %.