

Introduction
Unconventional oil and gas reservoirs are characterized by low permeability, making hydraulic fracturing a crucial method for enhancing their productivity [1]. The process involves transporting proppants deeper into the induced fractures and ensuring their long-term stability at the intended positions. This effectively increases the conductivity of the fractures, enhances the overall permeability of the reservoir, and releases the hydrocarbon production potential, thereby achieving the objective of increased output [2]. Improving the transport efficiency of proppants, maintaining stable placement within fractures, and achieving optimal packing density and porosity have persistently posed challenges for researchers [3⇓⇓-6]. In the past few decades, extensive studies have been conducted to effectively address the issue of proppant transport efficiency, with the majority consensus highlighting fluid viscosity as a pivotal factor [7-8]. Higher viscosity of the fracturing fluid enables the proppants to be transported over greater distances; however, it also leads to more residuals after flowback, with higher viscosity fluids leaving behind a larger amount of residue. High-viscosity fracturing fluids have difficulties in forming complex fracture network and it may cause severe reservoir contamination, thereby reducing fracture conductivity [9⇓-11]. On the other hand, low-viscosity fracturing fluids readily create complex fractures, but proppants may settle rapidly during transportation, accumulating near the wellbore and failing to penetrate deeply into the fracture system, or effectively supporting the fractures [12]. Consequently, enhancing the transport efficiency of proppants in clear water or low-viscosity fracturing fluids has become a crucial research focus recently.
The hybrid fracturing technology combining fibers with high-viscosity fracturing fluid can enhance porosity and fracture conductivity in the proppant placement zone, but this technology primarily relies on high-viscosity fluids, which is not suitable for creating complex fractures in volume hydraulic fracturing operation [13⇓⇓-16]. With advancements in fracturing techniques, the current practice of employing low-viscosity slickwater combined with fibers for large-scale volume fracturing to induce intricate fracture networks has emerged as a pivotal approach to enhance the production from unconventional hydrocarbon reservoirs. However, the migration distance of proppants carried by slickwater is limited, and after the commencement of production, frequent backflow of proppants results in sand production issues, which not only decreases productivity but also damages production equipment, posing severe safety risks [17-18]. Incorporating fibers into slickwater increases the transport distance of proppants, with fibers forming a loose, jagged channel of considerable thickness atop sand deposits, thereby improving fracture conductivity. Nonetheless, fiber loss in conventional slickwater formulations is substantial, which impedes the formation of fiber-proppant agglomerate and limits the effectiveness of fibers.
To address the aforementioned issues, this paper proposes a structure stabilizer. Based on microstructural observations and indoor performance evaluation experiments, the mechanism of proppant placement under the influence of the structure stabilizer is analyzed, and the effects of the stabilizer on parameters such as fiber escape rate, proppant placement height, fracture conductivity, critical sand production velocity, and proppant transport capability are examined.
1. Experiments
1.1. Materials and equipment
The experimental materials include: (1) Graphene, inorganic salts, anionic surfactants, non-ionic short-chain alkyl glucosides and polyacrylamide produced by Chengdu Kolon Chemicals Co., Ltd.; (2) Drag reducer (polyacrylamide emulsion), gel breaker and polyester fibers (6 mm in length) supplied by Chengdu Laweps Tech Co., Ltd.; (3) Quartz sand ranging from 0.109 mm to 0.212 mm (70-140 mesh) utilized in field hydraulic fracturing operation; (4) Distilled water prepared in the laboratory.
The experimental instruments include: a high-speed stirrer manufactured by Zhongshi Machinery Co., Ltd.; a custom-made 200 mm×300 mm×5 mm visualized proppant settling device; an API (American Petroleum Institute) flow conductivity testing instrument; a 3 000 mm×400 mm×5 mm simulated proppant transport device; a ZEISS EVO MA15 scanning electron microscope produced by German company Zeiss; and standard laboratory glassware.
1.2. Experimental procedures
1.2.1. Preparation of structure stabilizers
Mix graphene, water and inorganic salt, and agitate at 2 000 r/min for 2 h to form a uniform slurry. Add anionic surfactant, non-ionic short-chain alkyl glycoside and polyacrylamide in turn while agitating for 5-30 min. Preserve the prepared stabilizer in a sealed bottle.
1.2.2. Microstructure observation
For the purpose of concise description, a mixture of pure quartz particles with slick water is termed the conventional proppant system, the system composed of fibers, quartz particles and slick water is referred to a fiber-enhanced proppant system, and the system composed of fibers, structure stabilizer, quartz particles and slick water is designated as the stabilized proppant system. In this context, surface graft modification of the fibers involves the attachment of specific, strongly polar long-chain groups onto the fiber surfaces, which can enhance their hydrophilic properties. Modified fibers can disperse uniformly in slick water during a period of 3 s to 5 s. All fibers used were modified fibers. Add 15 g quartz sand and 0.1 mL drag reducer emulsion into 100 mL water and stir 2 min to form the conventional proppant system. Add 15 g quartz sand, 0.45 g fiber and 0.1 mL drag reducer emulsion into 100 mL water, and stir 2 min to form the fiber-enhanced proppant system. Add 15 g quartz sand, 0.45 g fiber and 0.1 mL drag reducer emulsion into 100 mL water and stir till they are mixed uniformly, then add 0.3 mL structure stabilizer and continue stirring another 2 minto form the stabilized proppant system. Observe the microstructures of the three proppant systems using scanning electron microscopy (SEM).
1.2.3. The effect of structure stabilizers on fiber escape rate
Add 16.00 g quartz sand, 0.08 g fiber, 0.1 mL drag reducer and 0.1 mL gel breaker into 100 mL water, and mix them thoroughly into a fiber-enhanced proppant system. On the basis of this proppant system, add the structure stabilizer at mass fractions of 0.1%, 0.2%, 0.3%, 0.4% and 0.5%, respectively, and mix into five stabilized proppants systems. Put the systems in a water bath maintained at 80 °C for 1 h. Collect the fibers escaping from the liquid, dry, and weigh them. Compute the fiber escape rate by using Eq. (1), and analyze the fiber escape behavior at different concentrations of the structure stabilizer.
1.2.4. Evaluation of proppant placement height
Utilize a visualized proppant settling device (Fig. 1 ) to observe the proppant placement height. The experimental procedure comprised the following steps: (1) Add 300 mL deionized water, 90 g quartz sand, 0.3 mL drag reducer and 0.3 mL gel breaker into a 1 000 mL beaker, andput the beaker under a magnetic stirrer set at 600 r/min to make a conventional proppant system. (2) Repeat Step (1) and add 0.3% fibers to prepare a fiber-enhanced proppant system. (3) Repeat Step (1), and add fibers at mass fractions of 0.1%, 0.2% and 0.3% for three fiber-enhanced proppant systems, receptively. After stirring thoroughly, add 0.3% structure stabilizer to make three stabilized proppant systems. (4) Pour the five proppant systems into a visualized device, respectively, and observe and record the placement height of the proppants after one hour.
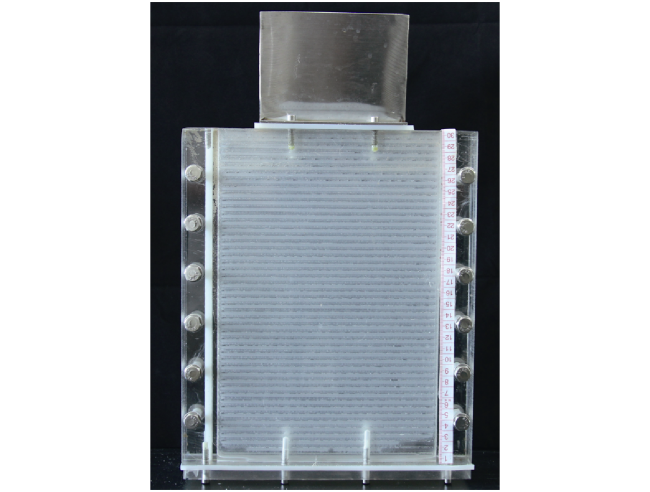
Fig. 1. Photograph of the visualized proppant sedimentation device. |
1.2.5. Flow conductivity test
Conduct flow conductivity tests on stabilizing and conventional proppant systems using an API flow conductivity tester. (1) Add 120 g quartz sand, 0.3 mL drag reducer and 0.3 mL gel breaker into 300 mL water, and agitate at 600 r/min to formulate a conventional proppant system. (2) Pour the sample into a visualized proppant settling device and place it into a 70 °C water bath for 2 h till the system is completely broken, thus completing the preparation of the test sample. (3) Without disturbing the proppant placement structure, move the sample into an API flow conductivity tester and following applicable procedures to evaluate the flow conductivity of the proppant system under varying closure pressures. (4) Repeat Step (1) and add 0.6 g fibers to make a fiber-enhanced proppant system. (5) Repeat steps (2) and (3). (6) Repeat Step (4) and add 2 mL structure stabilizer to make a stabilized proppant system. (7) Repeat steps (2) and (3) again.
1.2.6. Critical sand production flow rate test
Evaluate the sand control performance of stabilized proppants system using an API flow conductivity tester. (1) Add 72 g quartz sand, 0.3 mL drag reducer and 0.3 mL gel breaker into 300 mL water, and agitate at 600 r/min to prepare a conventional proppant system. (2) Repeat Step (1), and add 0.3%, 0.4%, 0.5% and 0.6% fibers, respectively, and 0.3% structure stabilizer, to formulate four stabilized proppant systems. (3) Place the samples into a 70 °C water bath for 2 h till completely gel broken. (4) Move the samples into an API flow conductivity tester and evaluate the impact of varying fiber mass fractions on the critical sand production rate at different closure pressure.
1.2.7. Proppant transport capability testing
Evaluate the proppant transport capability of stabilized and conventional proppant systems by using a simulation device (Fig. 2 ). The experimental procedure includes: (1) Inspect the sealing integrity of the experimental device. (2) Add 30 kg quartz sand into 200 L water. After mixing, add 200 mL drag reducer and 200 mL gel breaker into the mixture, and mix them into a conventional proppant system. (3) Repeat Step (2), add 90 g fibers and 600 mL structure stabilizer, and mix them into a stabilized proppant system. (4) Open the inlet and outlet valves, start the screw pump, and inject the conventional proppant system into the model at 15 L/min. (5) Use a high-definition camera to capture the movement of the proppants in the simulated fracture, and record the experimental data. (6) Inject the stabilized proppant system into the model, and repeat steps (4) and (5).
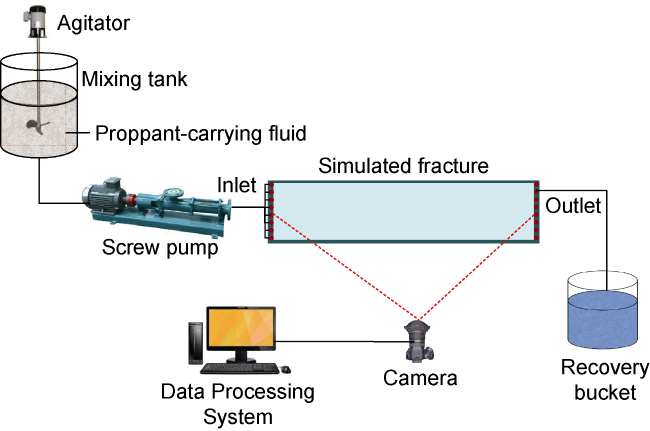
Fig. 2. Proppant transport capability experiment system. |
2. The mechanism of efficient placement of proppants
2.1. The mechanism of structure stabilizer
As illustrated in Fig. 3 , the structure stabilizer interacts with fibers on one hand, and on the other hand, it engages in the network structure of drag reducer, forming cage-like "spider webs". These webs can capture Proppants embedded within this cage-like "spider web" cluster together, which effectively minimizes the escape quantity of fibers from the proppant in slick water, increases the particle spacing of proppants, and enhances the bulk volume of the proppant.
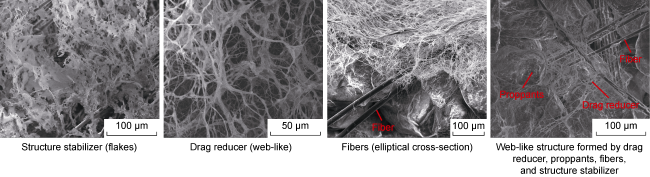
Fig. 3. Schematic diagrams illustrating the interaction among structure stabilizer, fibers, and quartz sands. |
SEM observation (Fig. 4 ) reveals that in the conventional proppant system, the web-like structure of the drag reducer is adsorbed onto the surface of quartz sands, which are compactly arranged with spacing at 50-100 um. In the fiber-enhanced proppant system, the web-like structure of the drag reducer is adsorbed onto the surface of quartz sands with spacing at 58 μm, while the fibers exhibit a smooth surface. In the stabilized proppant system, through the effect of the fiber structure stabilizer, the drag reducer is not only absorbed onto the surface of quartz sands, but also onto the fiber surfaces. The spacing between quartz sand grains is 110-200 μm, nearly 2-4 times that observed in the conventional proppant system, which effectively improves the flowing pathways.
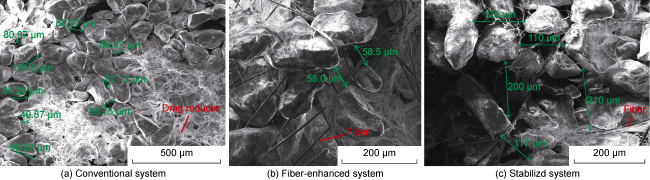
Fig. 4. SEM photos of proppant systems. |
2.2. Forces on proppants
During the settling process, fiber-enhanced proppants are primarily influenced by gravity, buoyancy, and drag force from slickwater. Due to the significantly higher density of proppants compared to fibers, the settling velocity of proppants is much faster than that of fibers, and fibers tend to float atop the proppant bed, leading to poor sand-carrying efficiency. The structure stabilizer enhances the interaction between fibers and proppants, and facilities the formation of fiber-proppant agglomerates. Compared with proppants alone, fiber-proppant agglomerates exhibit lower density, larger volume, and larger contact with fluid, thereby augmenting buoyancy and drag force. Consequently, the settling rate of proppants slows down, and more proppants are carried into deeper fracture sections.
3. Experimental results and discussion
3.1. Fiber escape rate variation
Under different mass fractions of structure stabilizers, the escape of fibers in low-viscosity slickwater is illustrated in Figs. 5 and 6 : When no structure stabilizer is added, the fiber escape rate is 53.0%; as the mass fraction of the structure stabilizer increases, the fiber escape rate decreases; when the mass fraction of the structure stabilizer up to 0.3%, the escape rate drops to 5.0%. Further increments in the mass fraction of the stabilizer result in negligible changes in the escape rate, indicating that the optimal mass fraction of the structure stabilizer is 0.3%. All following experiments were conducted by using the same parameter settings.
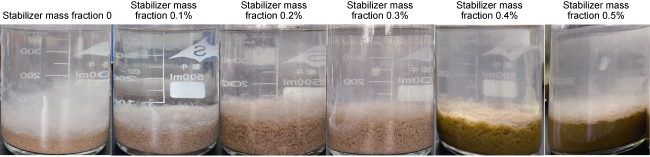
Fig. 5. Experimental results of escapable fiber at different mass fractions of structure stabilizer. |
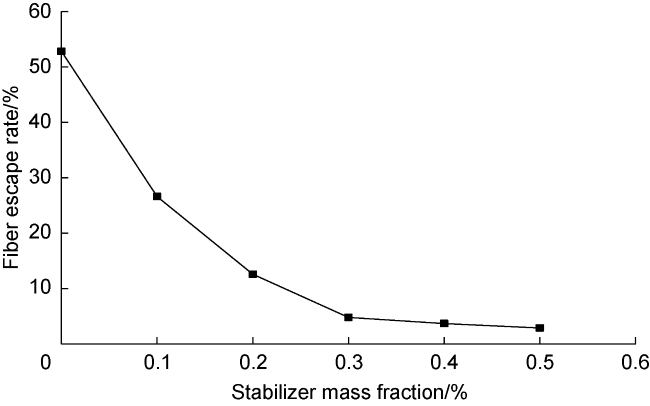
Fig. 6. Structure stabilizer mass fraction vs. fiber escape rate. |
3.2. Proppant placement height variation
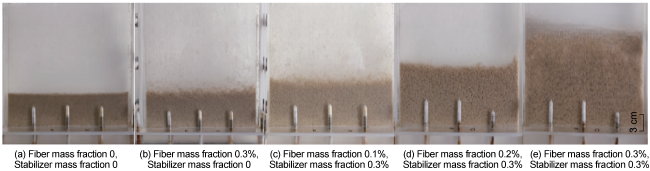
Fig. 7. Experiment result of different formula proppants after 1 h of sedimentation in a visualized settling device. |
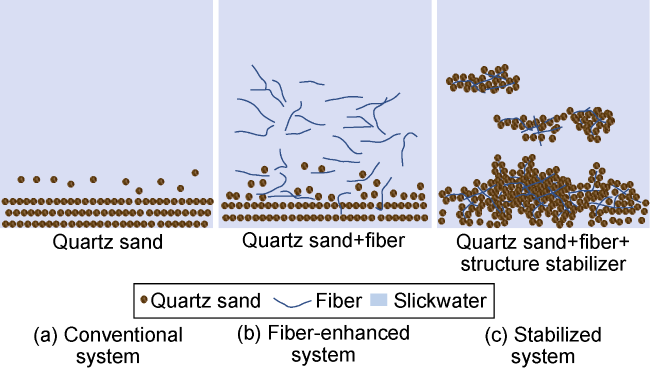
Fig. 8. Schematic diagrams of proppant settling. |
3.3. Variation of proppant conductivity
The impact of fracture closure pressure on the conductivity of various proppant systems (Fig. 9 ) illustrates that, as fracture closure pressure increases, the conductivity of the proppant systems shows a declining trend. At the same closure pressure, the stablized proppant system exhibits the highest conductivity, the fiber-enhanced proppant system has the lowest, and the difference between the conventional and the fiber-enhanced systems is relatively small. When the closure pressure is below 30 MPa, the conductivity of the stabilized proppant system increases by 10% to 20%, whereas the conductivity of the fiber-enhanced system decreases by approximately 10% relative to the conventional one.
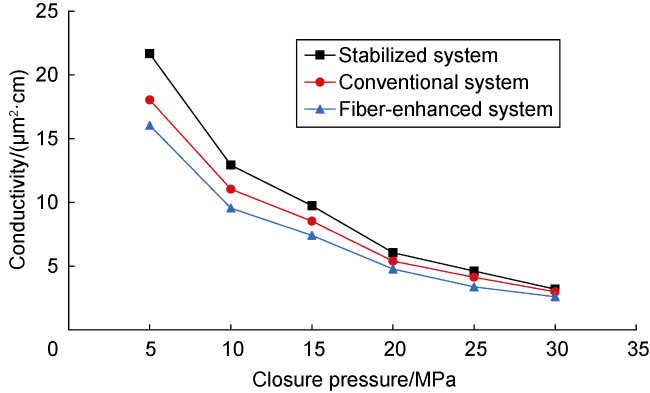
Fig. 9. Impact of closure pressure on the conductivity of different types proppant systems. |
3.4. Variation of critical sand production flow rate
Critical sand production flow rate of proppants reflects their resistance to fluid flushing. A higher critical flow rate indicates greater resistance, making it less likely for proppants to flow back and more conducive to enhancing the long-term productivity of a production well. The effect of closure pressure on critical sand production flow rate at varying fiber mass fractions (Fig. 10 ) illustrates that increases in both fiber mass fraction and closure pressure lead to a higher critical sand production flow rate. Without fibers, the critical flow rate for the conventional system is 5 mL/min. However, when fiber mass fraction is increased to 0.4%, under a closure pressure of 5 MPa, the critical flow rate surges to 200 mL/min, which is 40 times that of the conventional system. Furthermore, as the closure pressure continues to rise, the critical flow rate for the proppants keeps increasing.
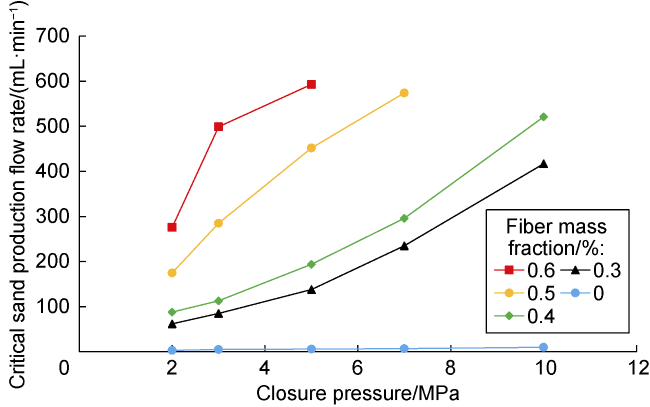
Fig. 10. Influence of closure pressure on the critical sand production flow rate. |

Fig. 11. Proppant placement shapes from experiments on critical sand production flow rate. |
3.5. Proppant transport capability
The proppant placement profiles (Fig. 12 ) for conventional and stabilized proppant systems show that the peak placement height of the proppants carried by the stabilized system moved forward by 20% more than that carried by the conventional system, with an increase in stacking height by 93% more than the later. The formation of fiber-proppant agglomerates leads to loose packing of proppants, a larger proppant volume and pore space under the same conditions. In addition, the agglomerates have low density, and a significant difference between buoyancy and gravity, thereby enhancing their suspension capability and enabling the proppants to migrate over a greater distance.
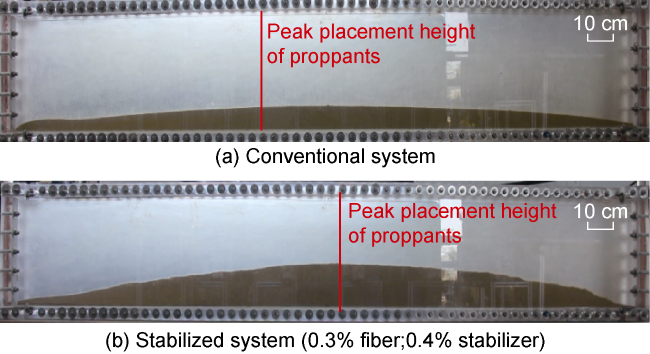
Fig. 12. Proppant placement profiles of different proppant systems. |
4. Field application
The stabilized proppant technology has been applied in 80 wells in tight gas, shale oil and shale gas fields in China, with remarkable results.
4.1. Application in tight gas wells
The stabilized proppant technology has been applied in 52 tight gas wells in the Sichuan Basin, resulting in a 30% increase in average daily gas production per well compared to conventional proppants, and a 70% reduction in the average sand production rate. Two wells, ZM220-5HF and ZM220-4HF drilled into the Zhongjiang tight sandstone gas reservoirs sharing the same microfacies and comparable geological conditions (Table 1 ) were selected in this application. For well ZM220-4HF, quartz sands with particle size ranging from 0.109 mm to 0.212 mm (70-140 mesh) and ceramic beads ranging from 0.212 mm to 0.425 mm (40-70 mesh) were mixed at a ratio of 8 to 2 to prepare a conventional system without fibers or structural stabilizer. For well ZM220-5HF, a stabilized system was injected, which is composed of quartz sands with particle size of 0.109 mm to 0.212 mm and that of 0.212 mm to 0.425 mm, also at a ratio of 8:2. 0.2%-0.4% of fibers and 0.3%-0.5% of structure stabilizers were co-injected throughout the process under the stabilized proppant system. 12.5 t of fibers and 57 t of structure stabilizers were used, and proppants injected into ZM220-5HF were 15% less than those into ZM220-4HF.
Table 1. Initial and steady production after fracturing by using different proppant systems in tight gas wells on the same well pad |
| Well | Density of drilling fluid/ (g·cm−3) | Poro- sity/% | Perme- ability/ 10−3 μm2 | Water saturation/% | Intensity of sand injection/ (m3·m−1) | Intensity of fluid injection/ (m3·m−1) | Propped fracture volume/ 104 m3 | Single fracture length/m | Initial dality gas production/ 104 m3 | Initial daily oil production/t | Sand production rate/ % | Cumulative gas production after 362 d/ 104 m3 |
|---|---|---|---|---|---|---|---|---|---|---|---|---|
| ZM220- 5HF | 1.83-1.88 | 7.7 | 0.06 | 39.7 | 2.27 | 15.7 | 240.21 | 232.62 | 9.9 | 5.0 | 0.73 | 2 725.2 |
| ZM220- 4HF | 2.00-2.06 | 7.5 | 0.10 | 44.0 | 2.62 | 16.5 | 211.10 | 216.82 | 2.8 | 2.3 | 2.72 | 1 067.5 |
Post-fracturing parameters indicate that, although the proppants injected into ZM220-5HF reduced by 15% and no ceramic proppants were used, the propped fracture volume achieved 240.21×10⁴ m3 with a single fracture length of 232.62 m. In Well ZM220-4HF, the propped fracture volume is 211.1×10⁴ m3 and a single fracture is 216.82 m long, induced by higher injection intensity and the use of ceramic proppants. The propped fracture volume is 12.1% larger and the single fracture length is 6.8% longer in ZM220-5HF than those in ZM220-4HF. Compared to Well ZM220-4HF, Well ZM220-5HF exhibites a 73.2% reduction in post-fracturing sand production rate, an initial daily gas production increased by 253.6%, and the initial daily oil production increased by 117.4%. After an equivalent production period of 362 d, the cumulative gas production of Well ZM220-5HF increased by 155.3% more than that of ZM220-4HF (Table 1 ), highlighting a significant enhancement in both production increase and sand control effectiveness.
4.2. Application in shale oil wells
The stabilized proppant technology has been applied in 12 shale oil wells drilled in the Jiyang reservoir in Shengli Oilfield, East China, with an overall positive effect. Taking well YY1HF as an example, this well is featured by a horizontal section of 1 811 m, which is primarily composed of classes I and II reservoirs. The well was fractured in 28 stages and 236 clusters. 25 of the 28 stages were stimulated by a stabilized proppant system, and the rest 3 stages were fractured by a fiber-enhanced system. All proppants are the mixture of quartz sands of 0.109-0.212 mm, larger quartz sands of 0.212-0.425 mm and ceramic particles of 0.212-0.425 mm, with an equal proportion of each type. In the stabilized proppant system injected into 25 stages, fibers and structure stabilizer were added throughout the fracturing process at 0.2% to 0.3% of fibers and 0.3% of structure stabilizer. In the fiber-enhanced system injected into the rest 3 stages, 0.2% to 0.3% fibers were added, but no structure stabilizer. The average sand injection intensity was 3.35 m3/m, and the fluid injection intensity was 41 m3/m. The fracturing operation was successfully completed as per design.
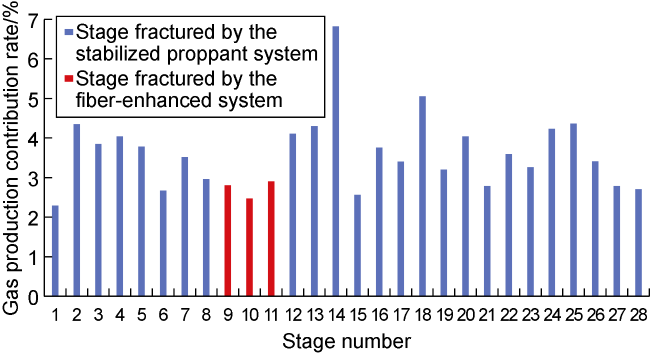
The production contribution of each fracturing stage, as monitored using chemical tracers, is illustrated in Fig. 13. It is evident that the oil production contribution rate for stages employing stabilized proppant system ranges from 2.49% to 6.82%, with an average of 3.70%. In contrast, stages utilizing fiber-enhanced proppant system show a production contribution rate ranging from 2.47% to 2.99%, and averaged 2.76%. The average oil production contribution rate by the stabilized proppant system is 34.06% higher than that of the fiber-reinforced system, indicating substantial enhancement in oil production.
Fig. 13. Oil production contribution rates of fractured stages in Well YY1HF. |
4.3. Application in shale gas wells
16 shale gas wells were fractured by using the stabilized proppant technology in Changning, Weiyuan, Luzhou and Zigong areas in the Sichuan Basin, and notable production enhancement was obtained. Taking well pad X in the southern Sichuan Basin as an example: there are 4 horizontal shale gas wells on the pad. Wells X-1HF and X-4HF were fractured by stabilized proppant system, while wells X-2HF and X-3HF were fractured by a self-suspending proppant system. The four horizontal wells share similar horizontal lengths, static reservoir properties and gas content, and they were all fractured in multiple clusters, at a high displacement and with the same fracturing parameters (Table 2 ). For wells X-1HF and X-4HF, the proppants are quartz sand of 0.109 mm to 0.212 mm and ceramic particles of 0.212 mm to 0.425 mm mixed at a ratio of 7 to 3. Fibers of 0.2% to 0.3% and structure stabilizer of 0.3% were injected throughout the fracturing process. Specifically, Well X-1HF consumed 7.145 t of fibers and 56 t of structure stabilizer, while well X-4HF used 8.400 t of fibers and 68 t of structure stabilizer. In contrast, wells X-2HF and X-3HF adopted the mixture of two kinds of proppants of 0.109-0.212 mm and 0.212-0.425 mm at a ratio of 7 to 3. No fiber or structure stabilizer was added.
Table 2. Reservoir and fracturing parameters of 4 wells on well pad X in the Southern Sichuan Basin |
| Well | TOC/% | Porosity/ % | Reservoir gas content/ (m³•t−1) | Brittle mineral/% | Stage length/m | Number of stages | Displacement/ (m3•min−1) | Intensity of proppant injection/(t•m−1) | EUR/ 108 m3 |
|---|---|---|---|---|---|---|---|---|---|
| X-1HF | 5.4 | 5.5 | 6.0 | 68 | 1 371 | 20 | 18 | 3.29 | 1.18 |
| X-2HF | 6.0 | 5.7 | 6.0 | 67 | 1 328 | 19 | 18 | 3.29 | 1.09 |
| X-3HF | 6.3 | 5.7 | 6.2 | 68 | 1 372 | 20 | 18 | 3.39 | 1.08 |
| X-4HF | 5.7 | 5.9 | 6.5 | 68 | 1 497 | 17 | 18 | 3.22 | 1.21 |
Based on geological and engineering parameters, the ultimate recoverable reserves in wells X-1HF, X-2HF, X-3HF and X-4HF are estimated to be 1.18×10⁸, 1.09×10⁸, 1.08×10⁸, and 1.21×10⁸ m3, respectively. The average ultimate recoverable reserves in wells X-1HF and X-4HF which were fractured by the stabilized proppant technology are 10.14% higher than those in wells X-2HF and X-3HF, proving a significant production enhancement effect.
5. Conclusions
Structure stabilizer as a special bridging molecular structure can create stable fiber-proppant agglomerates with polymers, fibers and quartz sands. Compared with a conventional proppant system, fiber-proppant agglomerates have lower density, a large volume, and large contact with fracturing fluid. And due to the enhanced buoyancy and drag force, proppants slowly settle down and can be carried into deep fractures. After settling, the fiber-proppant agglomerates can maintain the original structural integrity and also preserve the pore structure within the proppant agglomerates.
Fibers and structure stabilizer injected along with proppants into reservoirs can ensure the efficient placement of the proppants, reduce escape rate, and increase the volume occupied by the proppants in slickwater. This can significantly enhance the placement height and transport distance of proppants and fracture conductivity and decrease the flowback of the proppants. Experimental results indicate that the optimal mass fraction of the structure stabilizer is 0.3%. The application in 80 wells targeting tight gas, shale oil and shale gas has confirmed the good adaptability of the structure stabilizer, and the effectiveness for increasing production, cost reduction, and sand control.
Nomenclature
ϕ—fiber escape rate, %;
m1—fiber escape volume, g;
m2—total fiber amount, g.