

Introduction
Geological storage of CO2 is a key technology for reducing carbon emissions and achieving carbon neutrality [1⇓-3]. Multiple on-site tests and demonstrations of different scales have been conducted in countries and regions such as the United States, EU, and Australia [4⇓⇓⇓-8]. As of the end of 2022, there are a total of 65 CO2 capture, utilization, and storage (CCUS) projects in operation worldwide, including 13 projects with a capture capacity exceeding 100×104 t/a [3,9]. China has nearly 100 CCUS demonstration projects that have been put into operation and are under planning and construction. The projects that have been put into operation have a CO2 capture capacity of about 400×104 t/a, and an injection capacity of about 200×104 t/a [10].
Affected by human and geological activities, CO2 stored underground poses a risk of leakage and escape to shallow aquifers, soil, and atmosphere. The injection scale and intensity of large-scale CO2 storage projects have significantly increased, which may trigger leakage risks such as wellbore damage, crack opening, and fault activation. Monitoring CO2 storage projects, timely predicting and detecting risks such as leaks, is an important step in ensuring the safety, effectiveness, and sustainability of CO2 storage projects [11-12]. CO2 storage monitoring is also an important method for assessing and accounting for CO2 storage volume, providing effective information for CO2 storage projects to enter the carbon trading market [12]. At present, various tools and technologies have been developed for monitoring CO2 storage, which can be classified into atmospheric monitoring technologies, near-surface monitoring technologies, and underground monitoring technologies based on their spatial scopes [1,3]. Currently, most commonly used monitoring methods are unable to simultaneously meet real-time, large-scale, and long-term monitoring needs, and there are limitations such as low intelligence and weak planning of monitoring systems [1].
Spatial information technology aims to provide information about the Earth's surface, including all tools and technologies that can obtain information about the Earth's surface [13]. The key technologies include Global Navigation Satellite Systems (GNSS), Remote Sensing (RS), and Geographic Information Systems (GIS) [13]. Remote sensing technology is mainly used to obtain monitoring data. Global navigation satellite systems accurately locate monitoring points while obtaining data, and geographic information systems achieve storage, management, and analysis of relevant data [13]. At present, spatial information technology has been widely applied in fields such as urban planning, resource management, meteorology, and environment [14]. In recent years, spatial information technology has been applied to the monitoring of CO2 storage, providing new technological means for real-time, large-scale, and long-term monitoring. It can also be combined with various monitoring technologies to achieve integrated long-term and large-scale monitoring [11].
Multiple institutions and scholars in China and abroad have introduced and summarized the application of spatial information technology in CO2 storage monitoring. Jeyanny et al. [15] reviewed the application of remote sensing technologies and geographic information systems in the field of CO2 storage monitoring. The National Energy Technology Laboratory of the United States introduced the advantages, disadvantages, and related examples of the application of eddy covariance technique, interferometric synthetic aperture radar (InSAR) technology, and global navigation satellite system in CO2 storage monitoring in the Best Practices: Monitoring, Verification, and Accounting (MVA) for Geologic Storage Projects issued in 2017 [11]. Vasco et al. [16] introduced the application principles and examples of interferometric synthetic aperture radar technology and global navigation satellite systems in CO2 storage monitoring. Zhang et al. [17] introduced the applications of remote sensing technologies in CO2 storage monitoring. Zhang et al. [18] studied the eddy covariance technique and interferometric synthetic aperture radar technology for monitoring atmospheric CO2 flux. Zhao [19] investigated application of interferometric synthetic aperture radar technology and Global Navigation Satellite Systems in CO2 storage monitoring. Generally speaking, the above-mentioned institutions and scholars have only introduced some technologies, and there is still a lack of systematic analysis of the technical principles, applicable scenarios, and on-site applications of various spatial information technologies in the field of CO2 storage monitoring. This paper systematically analyzes the principles of various spatial information technologies and their applications in CO2 storage monitoring, identifies the challenges faced by spatial information technologies in CO2 storage monitoring, and predicts the future development of spatial information technologies in CO2 storage monitoring.
1. Present application of spatial information technologies in CO2 storage monitoring
The application of spatial information technology in CO2 storage monitoring mainly includes three sectors: monitoring data acquisition, positioning and data transmission, data management and decision support. These are achieved through five types of technologies: eddy covariance technique, remote sensing (RS) technology, Geographic Information System, Internet of Things (IoT) technology, and global navigation satellite system. Fig. 1 shows the spatial distribution and relationship of each sector in the application of spatial information technology to carbon storage monitoring. The monitoring data obtained through different means such as eddy covariance monitoring and remote sensing technology needs to be combined with spatial positioning technology and integrated with the Geographic Information System for data management and analysis.
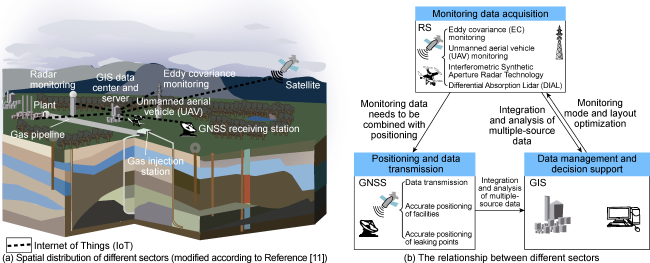
Fig. 1. Spatial distribution and relationship of each sector in the application of spatial information technologies in carbon storage monitoring ( |
Table 1. Technical indicators, maturity, and application cases of spatial information technologies in carbon storage monitoring |
| Category | Technology | Monitoring parameters/functions | Technical maturity | Cases of application or validation |
|---|---|---|---|---|
| Eddy covariance method | Eddy covariance monitoring | CO2 flux [11] | Applied in carbon storage projects | (1) Applied to the CO2CRC Otway carbon storage project in Australia [20]; (2) Applied to the CO2 Enhanced Recovery Project of Farnsworth Oilfield in the United States [21] |
| Remote sensing technology | Differential absorption LiDAR monitoring | CO2 number density [11] | Applied in carbon storage projects | Applied to Kevin Dome carbon storage project in the United States [11] |
| Fourier transform infrared spectroscopy monitoring | CO2 concentration [22] | Pilot study | Technical verification at the site of natural CO2 seepage from the sub-surface in the Cheb Basin of Bohemia, Czech Republic [22] | |
| Tunable diode laser absorption spectrometer monitoring | CO2 concentration [23] | Applied in carbon storage projects | Applied to the Decatur Carbon Storage Project in the Illinois Basin of the United States [23] | |
| Raman LiDAR monitoring | CO2 concentration [17] | Pilot study | Technical validation conducted at Eumsong Environmental Impact Assessment testing facility in South Korea [17] | |
| Greenhouse gas laser imaging tomography monitoring | CO2 concentration [11] | Applied in carbon storage projects | Applied to the Decatur Carbon Storage Project in the Illinois Basin of the United States[11] | |
| Unmanned aerial vehicle remote sensing (UAVRS) | CO2 concentration [11] | Pilot study | (1) Testing UAVRS data transmission in Barranquilla, Colombia [24]; (2) The UAV integration system assembled by Oklahoma State University is expected to be installed, tested, and optimized in the Farnsworth carbon storage project in the United States [11] | |
| Satellite spectral monitoring | CO2 concentration [17] | Under development | ||
| Hyperspectral imaging | Vegetation health [11] | Pilot study | Tested at ZERT Test Site in Montana, United States [11] | |
| Interferometric synthetic aperture radar technology | Ground deformation [11] | Applied in carbon storage projects | (1) Applied to In Salah CO2 storage project in Algeria [11]; (2) Applied to the CO2 enhanced oil recovery project of Kelly Snyder oilfield in the United States [25]; (3) Applied to the CO2 enhanced oil recovery project in Jingbian, China [26]; (4) Applied to the CO2 storage project of Aquistore in Canada [27] | |
| GNSS | GNSS monitoring | Ground deformation [11] | Applied in carbon storage projects | (1) Applied to the CO2 storage project of Aquistore in Canada [27]; (2) Applied to the CO2 enhanced oil recovery project in southern Texas of the United States [28] |
| GNSS positioning | Positioning | Pilot study | Tested the integration of CO2 sensors and GNSS receivers in Jakarta, Indonesia [29] | |
| IoT technology | Wireless sensor network | Data transmission | Under development | |
| Geographic Information System | Geographic Information System | Data management and decision support | Applied in carbon storage projects | Applied to the Decatur Carbon Storage Project in the Illinois Basin of the United States [30] |
The application of spatial information technology in the field of carbon storage monitoring in China is still in its early stage. According to literature research, only the interferometric synthetic aperture radar technology has been applied to the CO2 enhanced oil recovery project in Jingbian, China, up to now [26].
1.1. Acquisition of monitoring data
The data acquisition of spatial information technology is mainly achieved through methods such as eddy covariance monitoring and remote sensing technology. Eddy covariance monitoring is a micro meteorological technique used for direct and high-speed measurement of gas, heat, and momentum transfer between the Earth's surface and atmosphere [31]. Remote sensing technology is a comprehensive earth observation technique that detects and identifies targets at a certain distance based on information such as electromagnetic radiation from ground objects [11,32 -33]. Due to its wide coverage and fast information acquisition, remote sensing technology has been widely applied in fields such as climate, resources, and disaster monitoring. Remote sensing monitoring technologies can be divided into multiple categories, including near-ground monitoring, high-altitude monitoring (UAVs), and space monitoring (artificial satellites, space stations) according to their work platforms [33].
At present, spatial information technologies that have been applied to obtain CO2 geological storage monitoring data include near-ground eddy covariance monitoring, differential absorption LiDAR monitoring, UAV monitoring, interferometric synthetic aperture radar technology, global navigation satellite systems and others [11]. Table 2 summarizes the software and hardware requirements and monitoring time and space range of each monitoring method, among which multiple technologies can balance real-time, large-scale, and long-term monitoring needs. A specific analysis of the principles and applications of the six mature technologies is provided below.
Table 2. Software/hardware requirements and space/time ranges of spatial information technologies for data acquisition in carbon storage monitoring |
| Technology | Software and hardware requirements | Monitoring range of time and space |
|---|---|---|
| Eddy covariance monitoring | Hardware: 3D acoustic anemometer, gas analyzer [31]; Software: Signal processing software (converting electrical signals into physical parameters, removing peak values from raw data, correcting raw data, etc.), inversion algorithms for evaluating leak position [31,34] | Space: Several square meters to several square kilometers [11,31]; Time: 10-20 records are made per second on average, and the carbon flux for a specific time period is calculated by integrating instantaneous data [11,31] |
| Differential absorption LiDAR monitoring | Hardware: Pulse laser transmitter, Differential absorption LiDAR monitoring receiver [11]; Software: Algorithm for inverting CO2 concentration from differential absorption data [35] | Space: Several square meters to several square kilometers [11]; Time: The data sampling interval is a few minutes [36] |
| Fourier transform infrared spectroscopy monitoring | Hardware: Interferometer, infrared detector [22]; Software: Spectral algorithm for samples [22] | Space: Several square meters to several square kilometers [22]; Time: A complete collection sequence takes 10 min [22] |
| Tunable diode laser absorption spectrometer monitoring | Hardware: Tunable infrared laser, detector [23]; Software: Algorithm for inverting CO2 concentration [23] | Space: The detection distance of the system installed on site for the Decatur carbon storage project in the Illinois Basin of the United States is 100 m [23]; Time: With high temporal resolution, suitable for continuous monitoring [37] |
| Raman LiDAR monitoring | Hardware: Laser, detector and others [36]; Software: Algorithm for calculating CO2 concentrations[38] | Space: The detection distance in pilot test is 2 km [38]; Time: The data sampling interval is a few minutes [39] |
| Greenhouse gas laser imaging tomography monitoring | Hardware: Laser transceiver, reflector, weather station[11]; Software: Cloud-based software tools (used for data processing, storage, propagation, and nearly real-time generation of two-dimensional maps of CO2 concentration)[11] | Space: Verified on-site, the detectable range is 0.2 km2 [11]; Time: Capable of providing real-time CO2 concentration feedback [11] |
| UAVRS | Hardware: CO2 sensors, UAV platforms [11]; Software: Visualization of monitoring data on maps | Space: Pilot tests show the UAV can be deployed for data transmission within an altitude range of 0-120 m [24]; Time: Inspection intervals can be set according to needs |
| Satellite spectral monitoring | Hardware: Satellite, spectrometer [17]; Software: Algorithm for calculating CO2 concentrations [17] | Space: Several hundred square meters to several square kilometers [40]; Time: Passive remote sensing technology is subject to impacts of the return cycle [40] |
| Hyperspectral imaging | Hardware: Spectral imaging sensor [11]; Software: Image denoising, inversion, and visualization | Space: Several square meters to several square kilometers [11]; Time: Usually, signals are recorded on a daily basis [11] |
| Interferometric synthetic aperture radar technology | Hardware: Interferometric synthetic aperture radar [17]; Software: Algorithm for inverting ground deformation | Space: With millimeter level resolution, it can cover an area of 1×10⁴ km2 [11]; Time: Determined by the satellite access cycle of carrying radar, usually with a time interval of day [11] |
| GNSS monitoring | Hardware: Satellite, signal receiving station Software: Algorithm for inverting ground deformation | Space: With millimeter level resolution, it can cover the entire world [11]; Time: Available for continuous observation |
1.1.1. Near-surface eddy covariance monitoring
Based on eddy related techniques and micro meteorology, the eddy covariance method is a real-time non- destructive measurement method for material transfer between ecosystems and the atmosphere, and has become a commonly used tool for evaluating CO2 exchange between terrestrial ecosystems and the atmosphere. The eddy covariance method measures meteorological parameters such as CO2 gas concentration, moisture content, wind speed and temperature in the atmosphere using instruments installed on towers or mobile platforms. Then, the CO2 flux is obtained by calculating the covariance between CO2 concentration and instantaneous wind speed [31]. The instruments of a basic Eddy covariance measurement station include one three-dimensional acoustic anemometer and one gas analyzer [31]. Eddy covariance monitoring can provide CO2 flux data within a range of several kilometers and is widely used in regional CO2 flux monitoring. It can estimate CO2 distribution through footprint functions (a function that describes the spatial distribution of sources or sinks and the relationship between flux observations) [31,34].
The eddy covariance method has been used to estimate the baseline CO2 concentration for geological storage monitoring, and to evaluate the location and amount of leaks [31]. The US Department of Energy listed the eddy covariance method as a recommended monitoring method in 2012 [11,31]. The advantage of the eddy covariance method is that it measures a large spatial range and can provide continuous measurement data [11]. The challenge of its application lies in the need for effective data processing methods to determine the location and amount of leakage, and the natural spatiotemporal changes of CO2 flux have a certain impact on the detection of CO2 leakage signals [11]. The eddy covariance method can be combined with methods such as soil carbon flux tracer analysis to improve its ability to detect CO2 leakage [11].
The CO2CRC Otway carbon storage project in Australia stores CO2 in depleted natural gas reservoirs and uses the eddy covariance method for monitoring [20]. In the months leading up to the injection of CO2, the eddy covariance method was used to measure the baseline CO2 flux in the region. The results showed that the background value of CO2 concentration was high, and the range of CO2 flux variation between the surface and atmosphere was large [11]. Etheridge et al. [20] noted that the region has the smallest change in natural CO2 flux during the drought period, making it the best time to monitor CO2 leakage. The CO2 Enhanced Recovery Project of Farnsworth Oilfield in the United States has also used the eddy covariance method to measure the fluxes of CO2 and CH4 in the atmosphere and identify any potential point source leaks [21].
Lewicki et al. [34] verified the ability of the eddy covariance method in evaluating leak location and quantifying leak volume through on-site experiments. The experiment was conducted in a farmland in Bozeman, Montana, USA with continuous release of CO2 from shallow horizontal wells during the experimental period [34]. The error between the estimated release rate (0.32 t/d) using the eddy covariance method and the measured release rate (0.30 t/d) is about 7% [34]. Once a leak is detected, the least squares inversion of the CO2 flux measured by the eddy covariance method and the constructed footprint function can be used to evaluate the leak location [34]. Experimental results of Lewicki et al. [34] revealed that the eddy covariance method can detect and determine leakage signals and locations of moderate or higher severity. Lewicki et al. [41] developed a method for designing an eddy covariance monitoring network to improve the accuracy of CO2 leakage signal monitoring. They used the monitoring network to infer the distribution of CO2 surface flux and the relationship between usage sites, and then drew a space-time distribution map of CO2 leakage flux. Balancing the number and location of various eddy monitoring stations and establishing a monitoring network with multiple flux towers is an important means to expand the spatial range of CO2 flux monitoring and improve the ability to assess the location of surface CO2 leaks [41].
1.1.2. Differential absorption LiDAR monitoring
Differential absorption LiDAR monitoring (DIAL) is the most mature lidar technology for monitoring atmospheric gas composition [17,42]. DIAL emits two wavelengths of pulse laser, with the first wavelength associated with the molecular absorption characteristics of CO2, and the second wavelength least affected by the CO2 absorption characteristics [11,17]. The pulse laser output by the laser emitter is scattered by atmospheric aerosols, and the scattered light signal is collected by the DIAL receiver. If the two wavelengths are close enough in the spectrum, the only difference between the return signal and the emission signal is that one of the lasers is affected by the absorption of CO2 molecules [11,17]. The CO2 number density can be calculated using the DIAL equation [11].
The Kevin Dome carbon storage project in the United States applied DIAL technology from July 11 to August 4, 2013, during which measurement were conducted in 17 nights [11,43]. The project has verified the automatic scanning and monitoring function of DIAL. On the evening of July 27, 2013, DIAL monitored data for 90 minutes in the northeast direction of approximately 100°, and then automatically adjusted the launch direction to collect data for 90 minutes in the northeast direction of 90° [11,43]. By using DIAL instruments to scan a certain spatial area of the project site, a spatial map of CO2 number density within approximately 4 square kilometers of the Kevin Dome project site was created [11,43]. The measurement results of DIAL can be used to identify potential leaks in different areas, as well as to verify whether the CO2 concentration in the storage location and its surrounding environment is at a safe level [11,43].
1.1.3. Unmanned aerial vehicle remote sensing
By utilizing unmanned aerial vehicle, remote sensing sensor, telemetry and remote control, communication, differential global positioning system and remote sensing application technologies, UAVRS technology uses UAVs as remote sensing platforms, integrates high-performance small sensors, and achieves the acquisition and processing of remote sensing data. In CO2 geological storage projects, UAVRS technology is mainly used to directly detect and quantify CO2 leakage into soil and atmosphere [11,44⇓ -46].
Because of its advantages of fast speed and high efficiency, UAVRS has been widely used in the field of oil and gas pipeline monitoring. In practice, scholars have found that the key of this technology is not only on the design of UAV construction, but also on the design of monitoring paths and algorithms [47⇓⇓⇓⇓-52]. Park et al. [52] used laser sensing to obtain the concentration of leaked gas in pipelines, and infrared sensing to obtain thermal image information of pipelines. They developed a remote real-time monitoring system for gas leaks and pipeline appearance using UAVs, which can efficiently and accurately monitor and diagnose pipeline leaks, corrosion, and cracks. Li et al. [51] investigated applications of UAVRS on pipeline safety monitoring in Southwest and Northwest China, and proposed that UAVRS has good application prospects in oil and gas pipeline inspections. Yan et al. [50] proposed a new mixed integer nonlinear programming model, and validated the model through one virtual pipeline network and one actual pipeline network in order to achieve comprehensive optimization of UAV monitoring of oil and gas pipeline networks. At present, UAV inspections have been applied commercially in some countries. UAVs can regularly perform image recognition and data collection in well sites, pipelines and geological storage areas, identifying risks through big data analysis, reducing labor costs, and improving working environments and conditions [53-54].
The UAVRS technology is currently in the feasibility testing stage. Oklahoma State University in the United States has developed an integrated system for direct detection and quantification of CO2 leakage into soil and atmosphere using surface sensors and UAVs. Because of the capacity, durability, and stability of the Skywalker X-8 UAV platform, it is used for the integrated system and is expected to be installed, tested, and optimized for use in the Farnsworth carbon sequestration project [11]. Piñeres-Espitia et al. [24] tested the data transmission of UAVRS monitoring in Barranquilla, Colombia. The UAV was equipped with an MQ135 gas detector and a low-cost E34-2G4H20D RF data transmission module. The test results showed that the UAV could achieve data transmission in an altitude range of 0-120 m.
1.1.4. Interferometric synthetic aperture radar technology
Interferometric synthetic aperture radar technology can be used to measure ground deformation caused by CO2 injection [16,19]. Interferometric synthetic aperture radar technology relies on the phase delay of reflected microwave or radar waves to evaluate the displacement of surface monitoring points, with an accuracy of millimeter level and can be deployed for large-scale surface observation [16,19,55]. Both airborne and satellite systems can achieve this technology [16]. However, InSAR has limitations: it is susceptible to the influence of terrain conditions, vegetation coverage, and land use efficiency. In areas with complex terrain conditions, high vegetation coverage, and high land use efficiency, significant errors may occur. The measurement of ground deformation is affected by local subsidence and uplift caused by groundwater extraction and re-injection, as well as geological activities, and therefore cannot accurately reflect the impact of CO2 injection [11].
Interferometric synthetic aperture radar technology has been applied in the In Salah CO2 storage project in Algeria [11,16,19,56⇓ -58]. The monitoring results of the In Salah project show that the surface above all three injection wells has been uplifted, with an average uplift rate of 3 mm/a [11,16,19,56⇓ -58]. By using geomechanical models, the ground deformation monitored by interferometric synthetic aperture radar technology can be inverted, revealing signs of CO2 migration along faults/fractures [11,16,19,56⇓ -58]. In the United States, the Kelly Snyder Oilfield CO2 Enhanced Recovery Project used InSAR to measure ground deformation during fluid injection and production processes. The results showed a surface elevation of 10 cm between January 2007 and March 2011 [25]. The CO2 enhanced oil recovery project in Jingbian, China used interferometric synthetic aperture radar technology to measure ground deformation, but no obvious regular upward or downward trend was observed [26]. The Aquistore carbon storage project in Canada has deployed 9 interferometric synthetic aperture radar reflectors over a range of 6.5 km2 to measure ground deformation [27]. Currently, multiple research institutions are researching the use of interferometric synthetic aperture radar monitoring data and geomechanical models to achieve inversion of CO2 underground flow processes [57].
1.1.5. Global Navigation Satellite System monitoring
GNSS can also be used to measure ground deformation caused by CO2 injection [16,19]. GNSS is an absolute positioning technology that uses the measurement range of four or more satellites to uniquely define the position of a target point on the Earth's surface, thereby achieving monitoring of surface displacement [16,19]. The monitoring data of surface displacement can be combined with reservoir numerical simulation and geomechanical simulation to invert the change process inside the reservoir [16,19].
The Aquistore carbon storage project in Canada has deployed eight receiving stations of global position system (GPS) over an area of 6.5 km2 to measure ground deformation [27]. A CO2 enhanced oil recovery project in southern Texas, USA also uses GPS to measure ground deformation caused by CO2 injection. This project has set up three GPS receiving stations for continuous measurement [28].
1.1.6. Hyperspectral imaging
Hyperspectral imaging can assess the impact of CO2 leakage on ecosystems. Vegetation growth is easily affected by the increase in CO2 content in the soil, and vegetation spectra can be used as independent indicators to determine the possibility of underground CO2 leakage [11,59]. In actual measurements, preliminary investigations should be conducted to determine baseline conditions, including seasonal changes at the monitoring location, as well as natural changes in temperature, humidity, light, and nutrient availability at that location.
Male et al. [59] injected pure CO2 gas into a carbon storage site for 29 consecutive days at the ZERT test site in Montana, USA, to observe the health of the covering vegetation. It was found that there were signs of stress in some vegetation spectra within 4 d after injection. In addition, the CO2 concentration required to cause this change was estimated. For monitoring vegetation spectra, it is necessary to focus on determining the relationship between soil CO2 concentration changes and vegetation cover types, as well as the specific mechanisms of plant stress caused by soil ecosystem changes due to CO2 leakage [11].
1.2. Positioning and data transmission
The accuracy of geographic positioning is crucial for determining the location of leaks in carbon storage project [11]. The efficient transmission of monitoring data is a key technology for achieving real-time and intelligent carbon storage monitoring, and provides a basis for timely analysis and decision-making. Geolocation and data transmission are mainly achieved through GNSS and IoT technologies, respectively.
1.2.1. Global Navigation Satellite System
The Global Navigation Satellite System (GNSS) refers to a global satellite system used for navigation and positioning measurements. It utilizes satellite signals to transmit real-time information, which is received by ground receiving equipment to calculate geographic location information [60]. Currently, commonly used GNSS includes GPS from the United States, Glonass from Russia, Galileo from Europe, and the COMPASS system from China.
GNSS has the advantages of high precision, all-weather, continuous 3D positioning, and no need for communication [61]. By combining CO2 sensors with GNSS receivers, real-time and accurate measurement of CO2 concentrations can be achieved, and CO2 concentration can be correlated with location information [29].
Yola et al. [29] tested the combination of CO2 sensors and GNSS receivers in Jakarta, Indonesia: CO2 concentration monitoring and movement speed (vehicle speed observed in km/h) recording were conducted using one survey vehicle on two main roads in Jakarta. CO2 sensor MH-Z19C and real-time dynamic GNSS (RTK GNSS) U-Blox F9P were used in the test, the latter equipped with GNSS Trimble NetR9 receiver [29].
1.2.2. Internet of Things (IoT)
In recent years, research has begun on the use of IoT technology for data transmission in the field of carbon storage monitoring. The core of IoT technology is Wireless Sensor Network (WSN), which helps achieve real-time data transmission from sensor nodes to centralized servers with the lowest failure rate and the lowest implementation difficulty [62]. IoT technology can remotely perceive or control objects through the existing Internet network infrastructure, thus integrating the physical world more directly into computer-based systems, improving efficiency, accuracy and economic benefits, and reducing human involvement [63].
Mateev et al. [63] designed a distributed Internet of Things system for monitoring CO2, which uses LoRaWAN communication protocol and LoRa remote RF technology, combined with distributed measurement equipment based on the Arduino platform [63]. The CO2 data obtained by this system can be used to accurately locate gas emission sources through a distributed ground sensor network and achieve real-time monitoring [63]. Ming et al. [62] designed a CO2 concentration monitoring architecture based on the Internet of Things, which achieves data transmission through the ESP8266 Wi-Fi module. The system was applied to collect 2 880 data points at 30-s intervals within a time range of 10 d.
1.3. Data management and decision support
The effective management of carbon monitoring data is an important link in achieving the combination of different types of monitoring data and intelligent data processing, providing support for efficient decision-making. Data management and decision support are facilitated by the Geographic Information System and cloud computing services. Monitoring data from different sources combined with positioning information from global navigation satellite systems are integrated into the Geographic Information System through IoT technology, and then processed using cloud computing services (Fig. 2 ).

Fig. 2. Acquisition, transmission, and management of monitoring data. |
1.3.1. Geographic Information System
Geographic Information System (GIS) is a system composed of hardware, software, programs, and personnel used to facilitate the management, analysis, modeling, representation and display of geographic information related data, in order to solve complex problems related to resource planning and management [15,64]. GIS collects and pre-processes spatial data (including remote sensing data, GNSS data, etc.) from different sources, providing a platform for managing attribute data and location information in spatial analysis [13,15].
The Decatur carbon storage project in the Illinois Basin of the United States used GIS to compare CO2 concentration data measured using Greenhouse gas laser imaging tomography (GreenLITE) technology with spatial distribution of CO2 concentration estimated based on CO2 soil carbon flux data [30]. Among them, the CO2 soil carbon flux data is the average data of spatial point over two days; The CO2 concentration data measured by GreenLITE is a two-dimensional concentration measured every 10 min [30]. The GIS analysis results show that the GreenLITE measurement results are consistent with the estimated results based on soil carbon flux data [30].
The Decatur Carbon Storage Project in the Illinois Basin of the United States integrated aerial images with GIS databases [30]. GIS software can compare photographic images from multiple time points on the screen and visualize site areas along with maps, such as local infrastructure, project wells, on-site sampling locations, and other relevant spatial information [30]. In some cases, the Decatur carbon storage project combined digital aerial photographs of the site with relevant GIS data and engineering computer-aided design (CAD) drawings to plan upcoming industrial construction and abandon selected near-surface monitoring devices [30].
1.3.2. Cloud computing services
Because of the increase in monitoring data volume and sources, it is crucial to store data in an orderly manner for efficient data analysis and visualization, which is crucial for monitoring carbon storage projects [62]. Therefore, cloud computing services have begun to be applied to carbon storage monitoring projects.
When designing CO2 concentration monitoring architectures based on the Internet of Things, Ming et al. [62] and Mateev et al. [63] all used cloud computing services for data storage and processing. When using GreenLITE technology to measure CO2 concentration in the Decatur Carbon Storage Project in the Illinois Basin of the United States, cloud based data processing and storage software can generate a two-dimensional map of CO2 concentration in almost real-time [30].
2. Challenges faced by spatial information technologies in CO2 geological storage monitoring
Spatial information technology can balance real-time, large-scale, and long-term monitoring needs. Different spatial information technologies have distinct technical advantages and challenges (Table 3 ). Generally speaking, spatial information technology still faces challenges in accurate data acquisition, efficient data processing, and collaboration among different monitoring technologies.
Table 3. Technical advantages and challenges of different spatial information technologies |
| Technology | Advantages | Challenges |
|---|---|---|
| Eddy covariance monitoring | Large measurable spatial range and the ability to provide continuous measurement data [11] | Huge storage spaces are required for massive measurement data (with data collection frequency of 10 Hz or 20 Hz); Effective data processing methods are needed to determine the location and amount of leakage, and the natural space/time variation of CO2 flux has a certain impact on the detection of CO2 leakage signals [11,31] |
| Differential absorption LiDAR monitoring | Relatively low cost and high mobility [11] | The natural space/time variation of CO2 flux has a certain impact on the detection of CO2 leakage signals [11] |
| Fourier transform infrared spectroscopy `monitoring | Capable of monitor multiple gas components simultaneously [17] | Temperature, humidity, and other meteorological conditions can affect the accuracy of measurements [17] |
| Tunable diode laser absorption spectrometer monitoring | Handheld instruments can be used for convenient and flexible monitoring [17] | Short distances for accurately detecting concentrations [23] |
| Raman LiDAR monitoring | Less instruments and low cost required [17] | The Raman echoes of CO2 are very weak and difficult to be extracted from the background light waves [17] |
| Greenhouse gas laser imaging tomography monitoring | This is an automated monitoring technology that can monitor and visualize real-time changes in atmospheric CO2 concentration, helping to reduce environmental monitoring costs [11] | Due to the need for denoising, correction, and other processing of laser signals, high requirements are placed on information processing equipment and algorithms |
| UAV remote sensing monitoring | Fast monitoring, high efficiency and lower labor costs [47⇓⇓⇓⇓⇓⇓-54] | Smaller monitoring range |
| Satellite spectral monitoring | Wide monitoring range with no need for on-site equipment [17] | Susceptible to disturbances of aerosols under low resolution (1-10 km) conditions [17] |
| Hyperspectral imaging | Wide monitoring range | The accuracy of passive optical remote sensing inversion is relatively low and is greatly affected by the inversion model; The development time of active remote sensing is relatively short, and the technological maturity is low |
| Interferometric synthetic aperture radar technology | Available to monitor large-scale millimeter level surface deformation [11] | Significant errors may be observed in areas with complex terrain conditions, high vegetation coverage, and high land use efficiency [11] |
| Global Navigation Satellite System Monitoring | Available to monitor large-scale millimeter level surface deformation [11] | High requirements for inversion algorithms |
| Global Navigation Satellite System Positioning | Combining CO2 sensors with GNSS receivers can accurately determine the CO2 concentration at specific locations in real time [29] | High equipment requirements |
| Wireless sensor network | Can achieve remote sensing and control, improve monitoring efficiency, accuracy and economy, and minimize human involvement [63] | Vulnerable to interference with low confidentiality |
| Geographic Information Systems | Capable of integrating spatial data from different sources to facilitate spatial analysis of data [15] | Regular maintenance and updates of the system are required |
2.1. Accurate acquisition of monitoring data
Accurate acquisition of monitoring data is a prerequisite for the effective application of spatial information technology. The design and selection of hardware directly determine the accuracy and precision of monitoring results. The monitoring purpose, the sensor carrying platform, and the characteristics of carbon storage sites will all affect the selection and installation of spatial information technology facilities and devices. For different monitoring purposes and different platforms (such as UAVs or satellites at different heights), it is necessary to select sensors with appropriate accuracy. For different monitoring sites, it is necessary to choose spatial information monitoring technologies that match them. Some remote sensing technologies are very sensitive to temperature, humidity, and other meteorological conditions (such as Fourier transform infrared spectroscopy monitoring technology), so they are not suitable for carbon storage sites with rapidly changing meteorological conditions. Based on the spatial characteristics of carbon storage sites, it is necessary to choose equipment installation methods that are suitable for them. For example, interferometric synthetic aperture radar technology is suitable for areas with flat terrain, low vegetation coverage, and limited land use. Therefore, permanent reflectors need to be built in areas with high vegetation coverage to achieve accurate data acquisition [11]. For seabed carbon storage, monitoring techniques commonly practiced on land, such as the eddy covariance method and UAV remote sensing technology, cannot be applied in seabed carbon storage monitoring due to the limitations of platforms and the barriers from seawater. At present, the main method for monitoring seabed carbon storage is sonar remote sensing (single beam scanning sonar, multi-beam sonar, synthetic aperture sonar, and others), which achieves monitoring of seabed CO2 storage leakage by distinguishing the acoustic impedance difference between water and gas [65].
The setting of monitoring points can also affect the accuracy of monitoring data acquisition. When using the eddy covariance method to monitor CO2 flux, it is necessary to establish multiple monitoring towers to form a monitoring network in order to maximize the accuracy of the spatial distribution of CO2 flux data and achieve precise positioning of leakage locations.
2.2. Efficient processing of monitoring data
The effective utilization of spatial information monitoring data is based on accurate and efficient data processing, including the correct use of environmental baseline values at monitoring stations, inversion algorithms, and the high-performance storage and calculation of data from different sources.
In the process of monitoring data analysis, it is necessary to synergistically analyze the monitoring data during carbon storage and the environmental baseline data before project implementation, in order to eliminate the impact of natural space/time changes on CO2 leakage signals.
The analysis process of spatial information technology usually relies on inversion algorithms. When the CO2 flux measured by the eddy covariance method is used to evaluate leakage location, the least squares inversion of the footprint function is needed [34]. When interferometric synthetic aperture radar technology and global navigation satellite systems are used for surface deformation monitoring, inversion algorithms are also needed to obtain the distribution of CO2 underground. Therefore, it is necessary to establish an accurate inversion algorithm.
Spatial information monitoring data often comes from multiple different types of monitoring technologies, each of which generates a large amount of data, so it is a large-scale data body formed by the intersection of remote sensing science, geographic information science and other sciences. Therefore, establishing effective data storage and computing capabilities for a large number of different data types is the key to efficient processing of spatial information monitoring data. The challenges faced by space/time big data processing and analysis mainly come from the scale and diversity of data. Massive data requires powerful computing and storage resources for processing. The data is inconsistent in quality and may contain inaccurate, incomplete and noisy information, which negatively affect the accurate analysis of the data. Therefore, integrating space/time data from different sources (with different data formats and coordinate systems) is a complex problem. The visualization of space/time data requires professional design to consider the complexity of time and space. Analyzing space/time data typically requires the application of complex mathematical and statistical models to consider the correlations between time and space. Long-term data storage and backup also requires appropriate storage devices and strategies.
2.3. Collaboration of different monitoring technologies
As an emerging monitoring technology, spatial information technology requires interactive verification with current mature monitoring technologies to ensure the accuracy of its data and the credibility of its results, providing a foundation for its large-scale application. The collaboration of different monitoring technologies is the key to the effective application of spatial information technologies.
There are more than ten monitoring technologies applied in carbon storage projects, but they cannot be collaborated directly for there is no interoperability standard for the results obtained from each technology. In some projects, although multiple monitoring technologies are used integratedly, the selection of technologies lacks specific theoretical basis and is only a simple attempt to choose the optimal solution, which increases unnecessary human and material costs in the process. To solve this problem, it is necessary to establish unified standards to promote the collaborative operation of various monitoring technologies, thereby improving the credibility and accuracy of monitoring results.
3. Future development of spatial information technologies in CO2 geological storage monitoring
3.1. Establishment of optimization design methods and standards for spatial information technology monitoring programs
In terms of selecting spatial information technology, it is urgent to establish guidelines for selecting different spatial information technologies based on different monitoring purposes and characteristics of carbon storage sites. Methods and standards for designing monitoring points for different spatial information technologies should be established, and monitoring point selection and monitoring intensity design techniques and methods should be optimized to lay a foundation for the large-scale promotion and application of spatial information monitoring technology.
In terms of the application of spatial information technology monitoring data, it is necessary to establish methods for applying spatial information technology monitoring data in carbon storage accounting, providing effective information for carbon storage projects to access the carbon market.
3.2. Establishment of a collaborative application method for cross-scale monitoring technologies
In terms of accuracy evaluation of spatial information monitoring data, the obtained data and the data obtained from different scales of spatial information technology shall be interactively verified on the basis of geographic information systems, to ensure the accuracy of spatial information technology in the process of large-scale application.
In the application of spatial information monitoring data, effective inversion of ground and even underground data based on spatial information monitoring data is achieved through the collaborative application of cross-scale monitoring technologies.
In terms of collaborative application of different monitoring technologies, it is necessary to establish communication protocols that adapt to monitoring data at different scales, provide basic guarantees for collaborative application of cross-scale monitoring technologies, and form design methods and standards for collaborative application of cross-scale monitoring technologies, so as to achieve efficient and low-cost collaborative application of spatial information technologies and other monitoring methods.
3.3. Collaborative application of spatial information technology with artificial intelligence and high-performance computing technology
In terms of data storage, it is necessary to combine spatial information technology with artificial intelligence and high-performance computing technology to form a multi-source data fusion and transmission technology for spatial information monitoring data and establish a distributed storage and visualization platform for large sample data.
In data processing, it is necessary to combine spatial information monitoring data with artificial intelligence and numerical simulation of CO2 storage leakage and migration transformation, to construct a comprehensive and multi-environment inversion model, to establish a digital twin system for the target geological body, to form a leakage risk prediction model, and to generate an intelligent warning platform for potential leakage risks.
3.4. Accelerate the application of spatial information technologies in China's carbon storage projects
On the basis of summarizing the experience of foreign space information technology application cases, adaptability evaluation and application of mature technologies should be carried out as soon as possible in the carbon storage projects of China, and domestic and independent space information technology monitoring equipment should be constructed to minimize technology application costs.
In terms of data processing and analysis in spatial information technology monitoring, it is necessary to establish domestically produced and independently developed industrial software, comprehensively utilize reservoir numerical simulation and digital twin technology, construct inversion algorithms targeting the characteristics of terrestrial sedimentary geological bodies in China, and form an intelligent data processing and analysis platform for spatial information technology.
It is necessary to strengthen the cooperation of Chinese oil and gas field enterprises with information technology companies, COMPASS satellite navigation system suppliers and other upstream and downstream space information technology enterprises, seek appropriate business models and project operation models, form innovative consortia with complementary advantages, and promote the coordinated development of space information technologies in the enterprises involved in carbon storage monitoring.
4. Conclusions
Spatial information technologies are important means of CO2 geological storage monitoring. Currently, the main spatial information technologies applied in the field of CO2 storage monitoring can be classified into five categories: eddy covariance technique, remote sensing technology, Geographic Information System, Internet of Things (IoT) technology, and global navigation satellite system. The monitoring data during the CO2 geologic storage monitoring process is acquired mainly through near-ground eddy covariance monitoring, differential absorption LiDAR monitoring, UAV remote sensing monitoring, interferometric synthetic aperture radar technology, global navigation satellite system monitoring, hyperspectral image monitoring and other technologies, which can simultaneously meet real-time, large-scale, and long-term monitoring needs. Monitoring data can be combined with inversion algorithms, reservoir numerical simulations, and other methods to evaluate the location of leaks and the underground flow process of CO2; The positioning and data transmission in the monitoring process of CO2 geological storage are mainly achieved through global navigation satellite systems and Internet of Things (IoT) technology, which can achieve efficient data transmission in a larger coverage range and precise positioning of monitoring points; The data management and decision support in the monitoring process of CO2 geological storage are mainly achieved through the Geographic Information System and cloud computing services. By combining monitoring data with geographic information for analysis, monitoring accuracy and efficiency can be improved.
Major challenges faced by spatial information technologies in carbon storage monitoring mainly include: For different monitoring purposes, platforms and sites, it is necessary to select spatial information technologies that match them to ensure the accuracy and precision of monitoring results; In response to the characteristics of diverse sources and large amounts of spatial information monitoring data, it is necessary to establish effective data storage and computing capabilities to ensure efficient analysis and processing of data; Spatial information technology shall be verified interactively with currently mature monitoring technologies to promote collaborative operations.
It is necessary to establish the design methods and standards for spatial information technology monitoring schemes and the collaborative application methods for cross-scale monitoring technologies, and realize the collaborative applications of spatial information technology with artificial intelligence and high-performance computing technologies, so as to achieve complementary and unified monitoring data, visual information exchange, precise location of leakage sites, efficient and intelligent monitoring, and accurate and timely prediction and warning. It is necessary to accelerate the application of spatial information technologies in China's carbon storage projects.